

HBAR noted a 20% rally during Wednesday’s intraday trading session. This double-digit gain was fueled by Nasdaq’s filing of a 19b-4 form with the US Securities and Exchange Commission (SEC) to list and trade Grayscale’s spot HBAR exchange-traded fund (ETF).
However, the rally appears to be losing momentum. Market indicators suggest that bearish sentiment is strengthening, putting HBAR at risk of losing recent gains.
HBAR Faces Downward Pressure as Market Sentiment Turns Bearish
HBAR’s negative Balance of Power (BoP) reading indicates weakening buying pressure among its spot market participants. At press time, this indicator, which compares the strength of an asset’s bulls and bears, is below zero at -0.09.
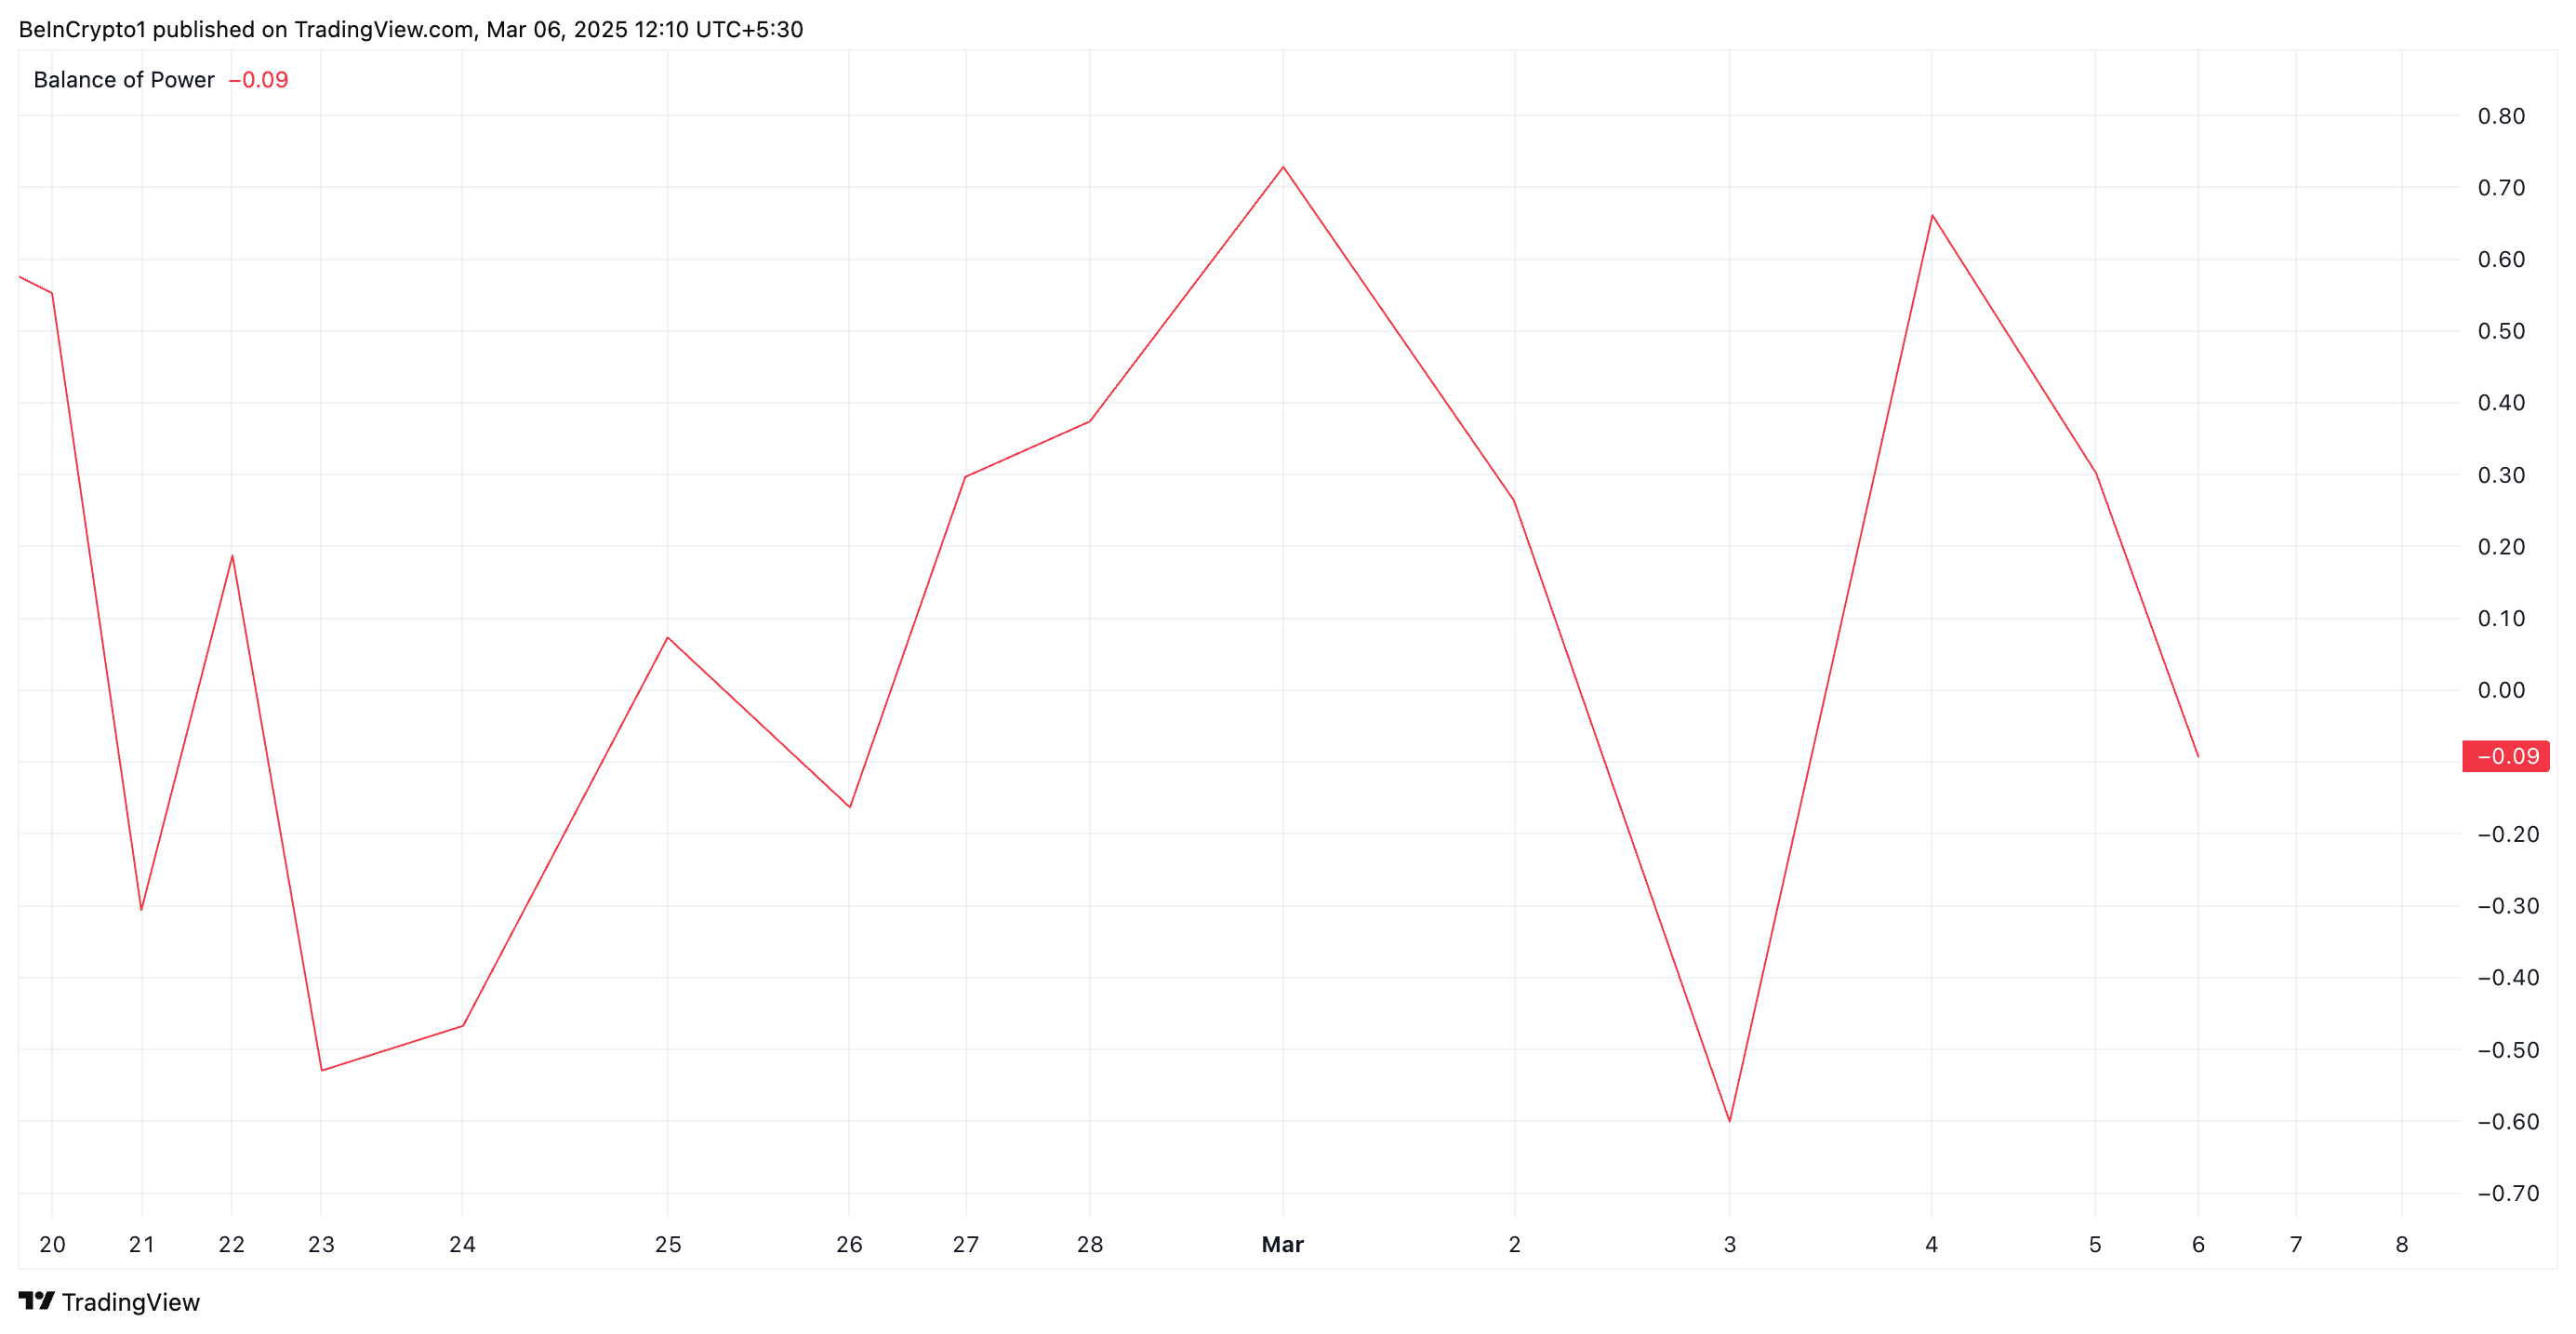
When an asset’s BoP is negative, its sellers exert more control over price action. This suggests weakening buying pressure in the HBAR market and hints at a potential continuation of the bearish momentum.
Moreover, HBAR’s Long/Short ratio indicates an increasing dominance of short positions, confirming the bearish sentiment among its futures traders. As of this writing, this stands at 0.98.
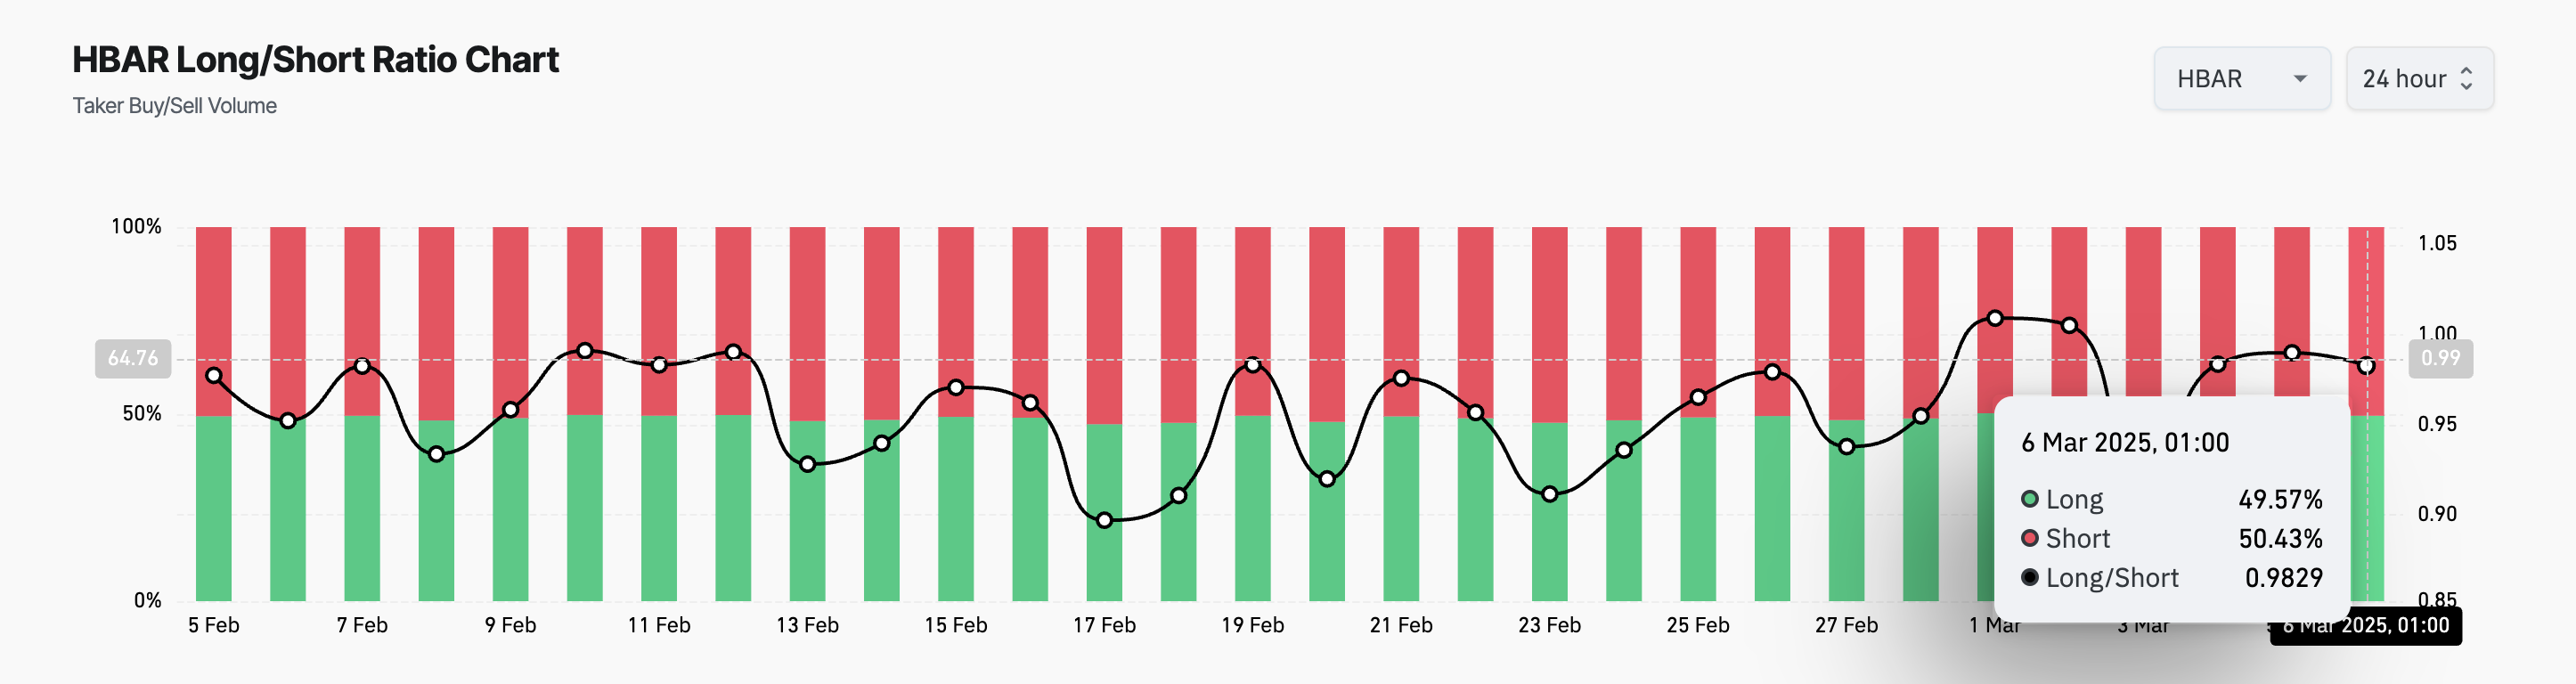
The Long/Short ratio measures the proportion of long positions (bets on price increases) to short positions (bets on price declines) in the market. When the ratio is below 1, it indicates that short positions outnumber long positions. It highlights the bearish sentiment among HBAR holders and increases the downward pressure on its price.
HBAR’s Fate Hangs in the Balance
HBAR exchanges hands at $0.24 at press time. On the daily chart, it trades above support formed at $0.22. If bearish pressure gains momentum, this level may fail to hold. HBAR’s price could decline further to $0.17 if the bulls cannot defend this support level.
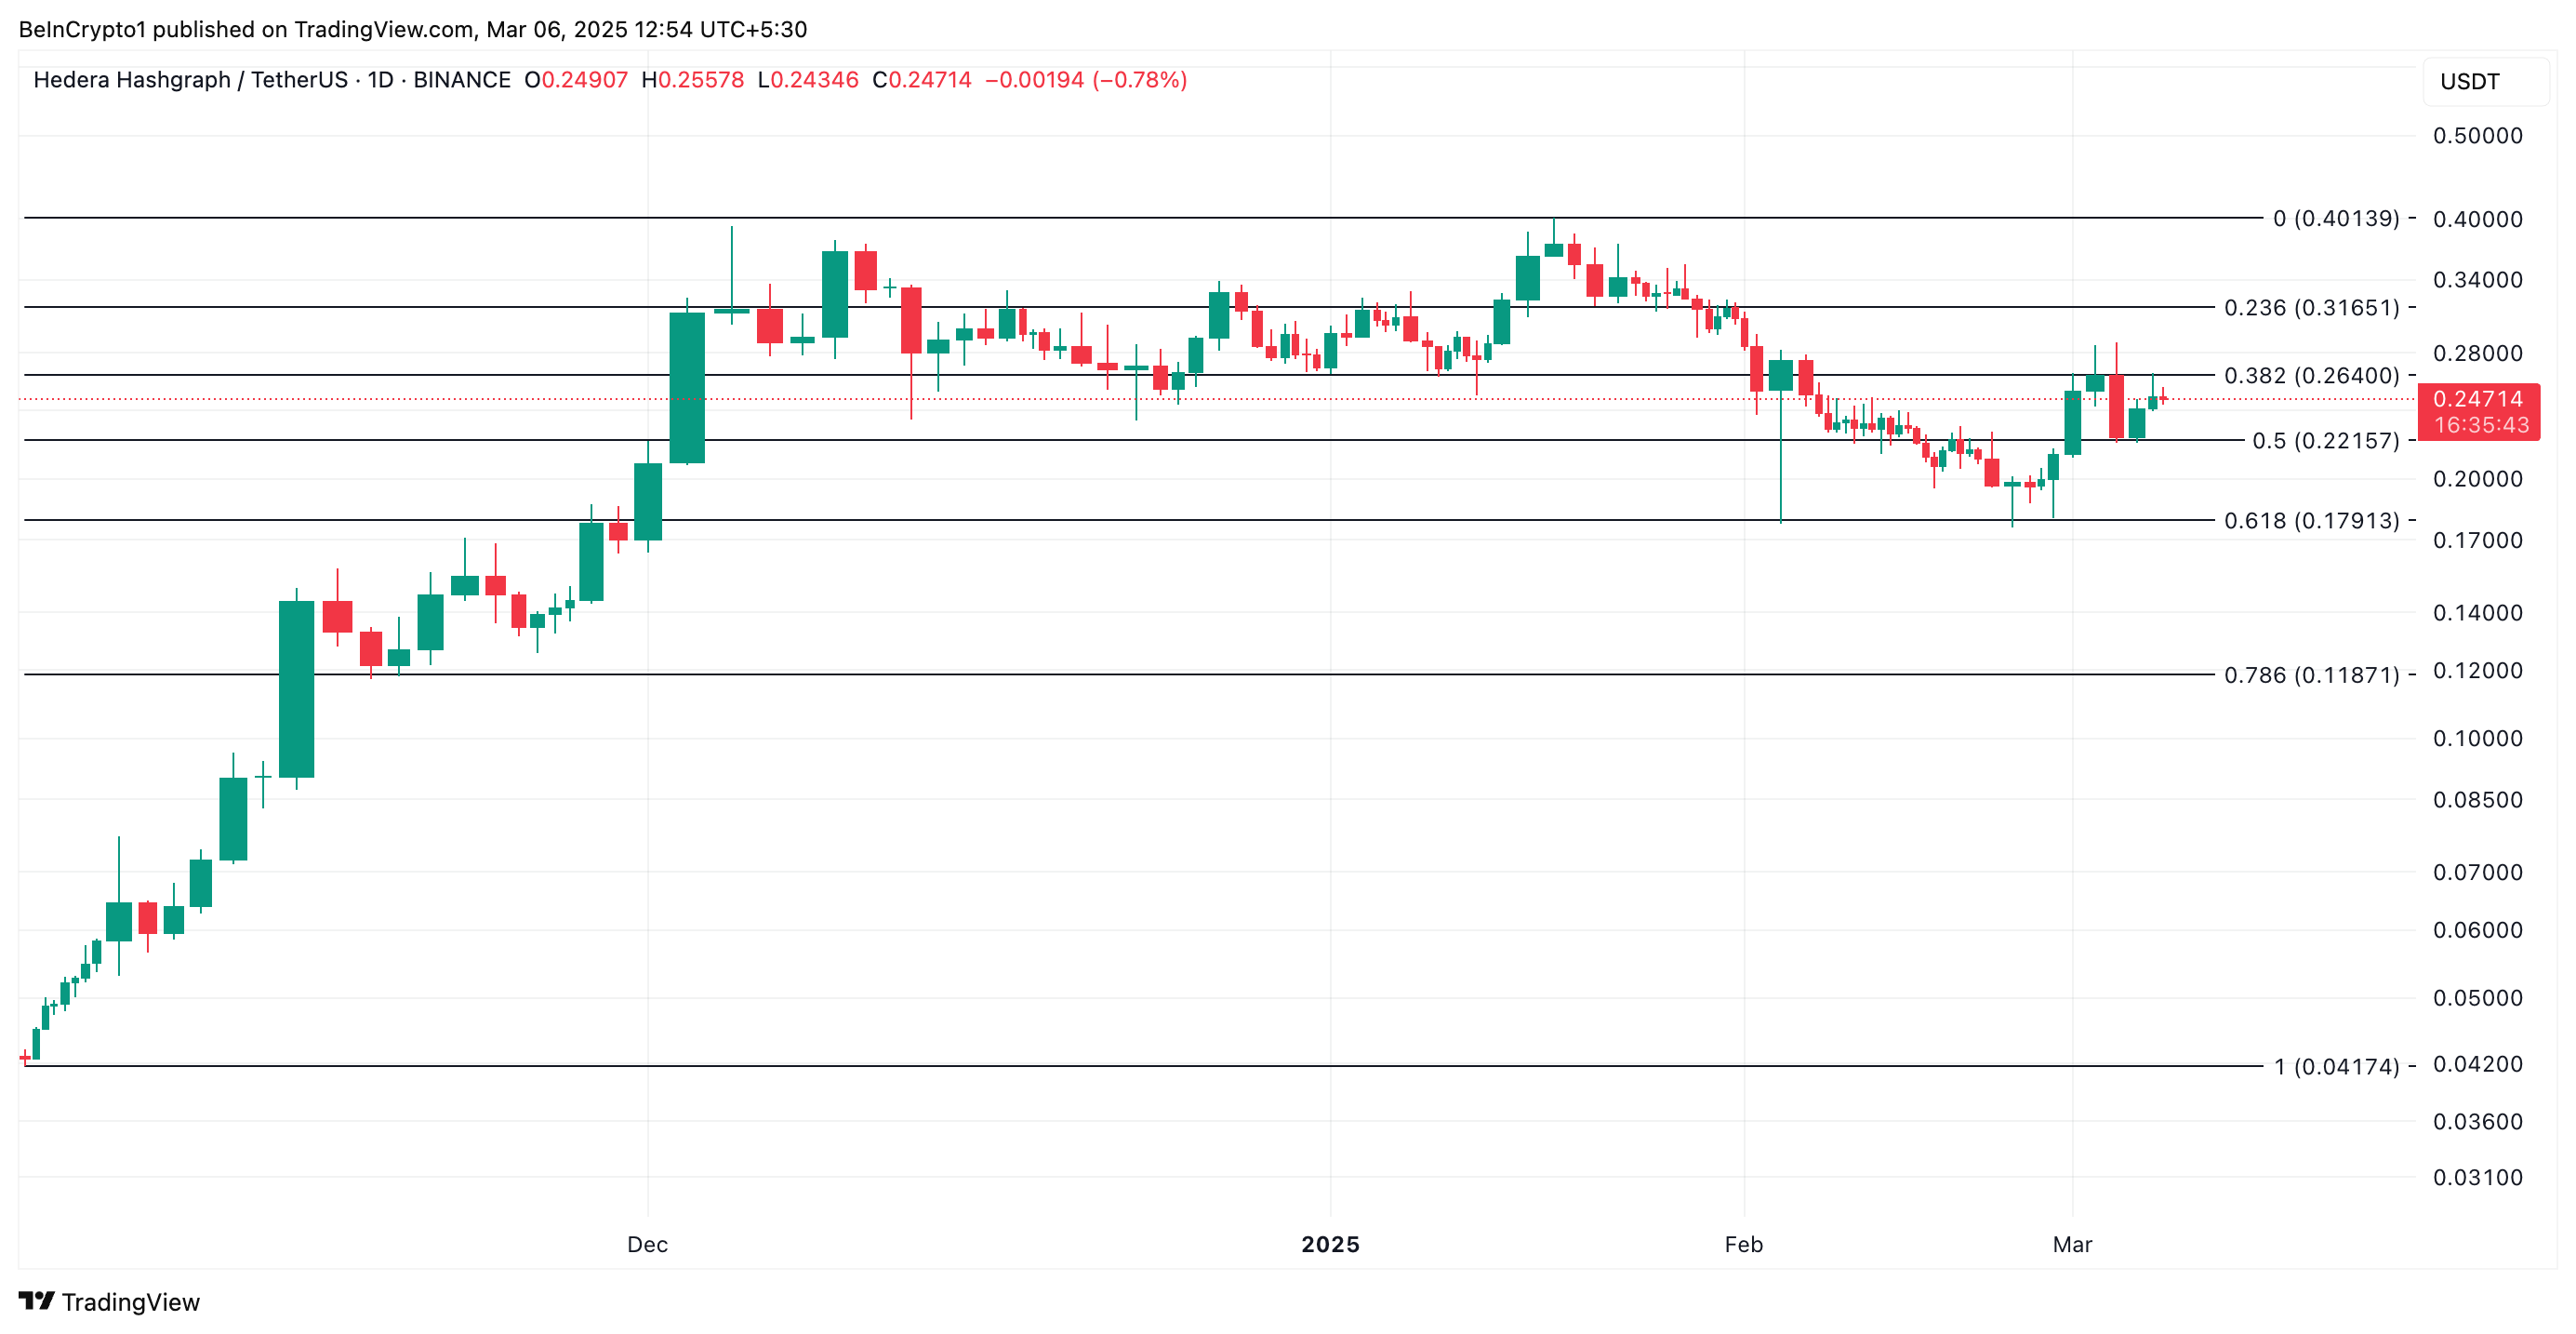
Conversely, a positive shift in market sentiment could prevent this. If new demand trickles into the market, HBAR’s price could breach resistance at $0.26 and rally toward $0.31.
Disclaimer
In line with the Trust Project guidelines, this price analysis article is for informational purposes only and should not be considered financial or investment advice. BeInCrypto is committed to accurate, unbiased reporting, but market conditions are subject to change without notice. Always conduct your own research and consult with a professional before making any financial decisions. Please note that our Terms and Conditions, Privacy Policy, and Disclaimers have been updated.