

Hedera (HBAR) defied the broader market downtrend yesterday. It surged nearly 10% after news broke that Nasdaq had filed a 19b-4 form with the US Securities and Exchange Commission (SEC) to list Canary Capital’s proposed HBAR exchange-traded fund (ETF).
However, this rally has been short-lived. HBAR’s price dropped by 7% in the past 24 hours, and technical indicators suggest further downside as demand for the altcoin remains weak.
Hedera Drops After ETF Hype Fades
On Monday, the US securities exchange Nasdaq filed with the SEC seeking approval to list Canary’s ETF, which is designed to hold the Hedera Network’s native token HBAR.
Following this development, the altcoin diverged from the broader market to record gains. Its price climbed from $0.209 to a 24-hour high of $0.226. However, with no demand to sustain the rally, HBAR’s price has since fallen slightly. It now trades at $0.190, down 7% over the past 24 hours.
BeInCrypto finds that significant bearish bias continues to trail the altcoin. This is evident from its negative Balance of Power (BoP) indicator on the 12-hour chart, which currently sits at -0.50.
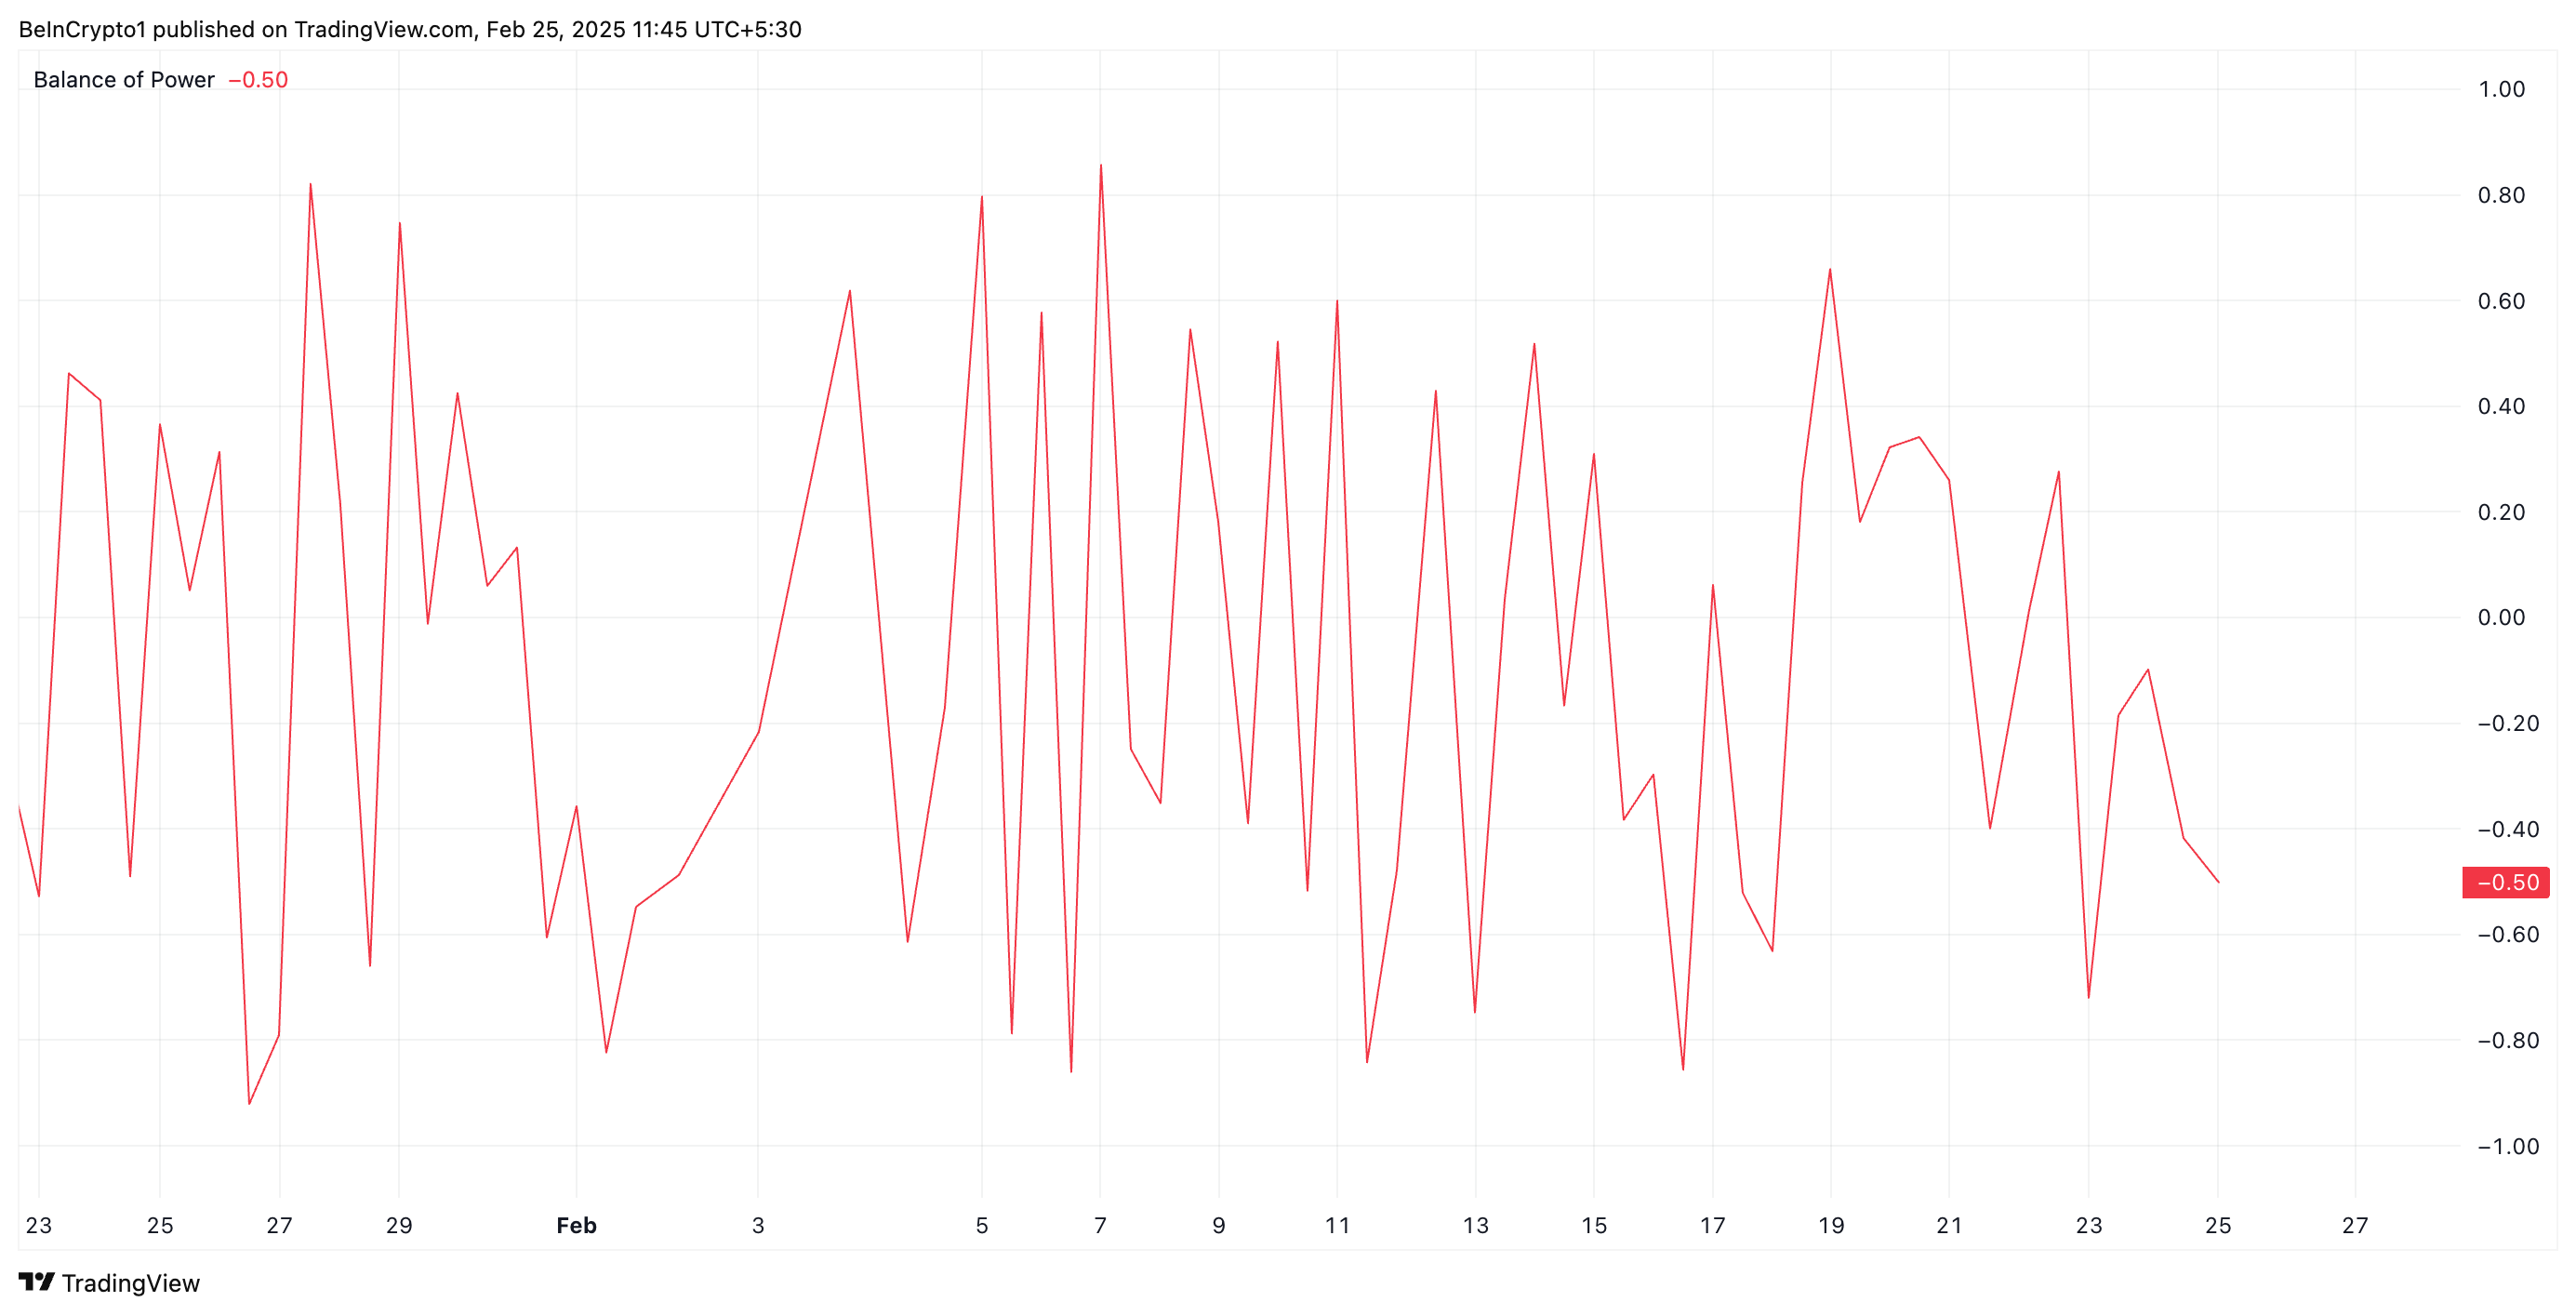
The BoP indicator measures the strength of buyers against sellers by analyzing price movements within a given period. A negative BoP value indicates that sellers are in control, suggesting bearish momentum and potential downward price pressure.
Moreover, HBAR’s Chaikin Money Flow (CMF) affirms this bearish outlook. It is in a downward trend below the zero line as of this writing.
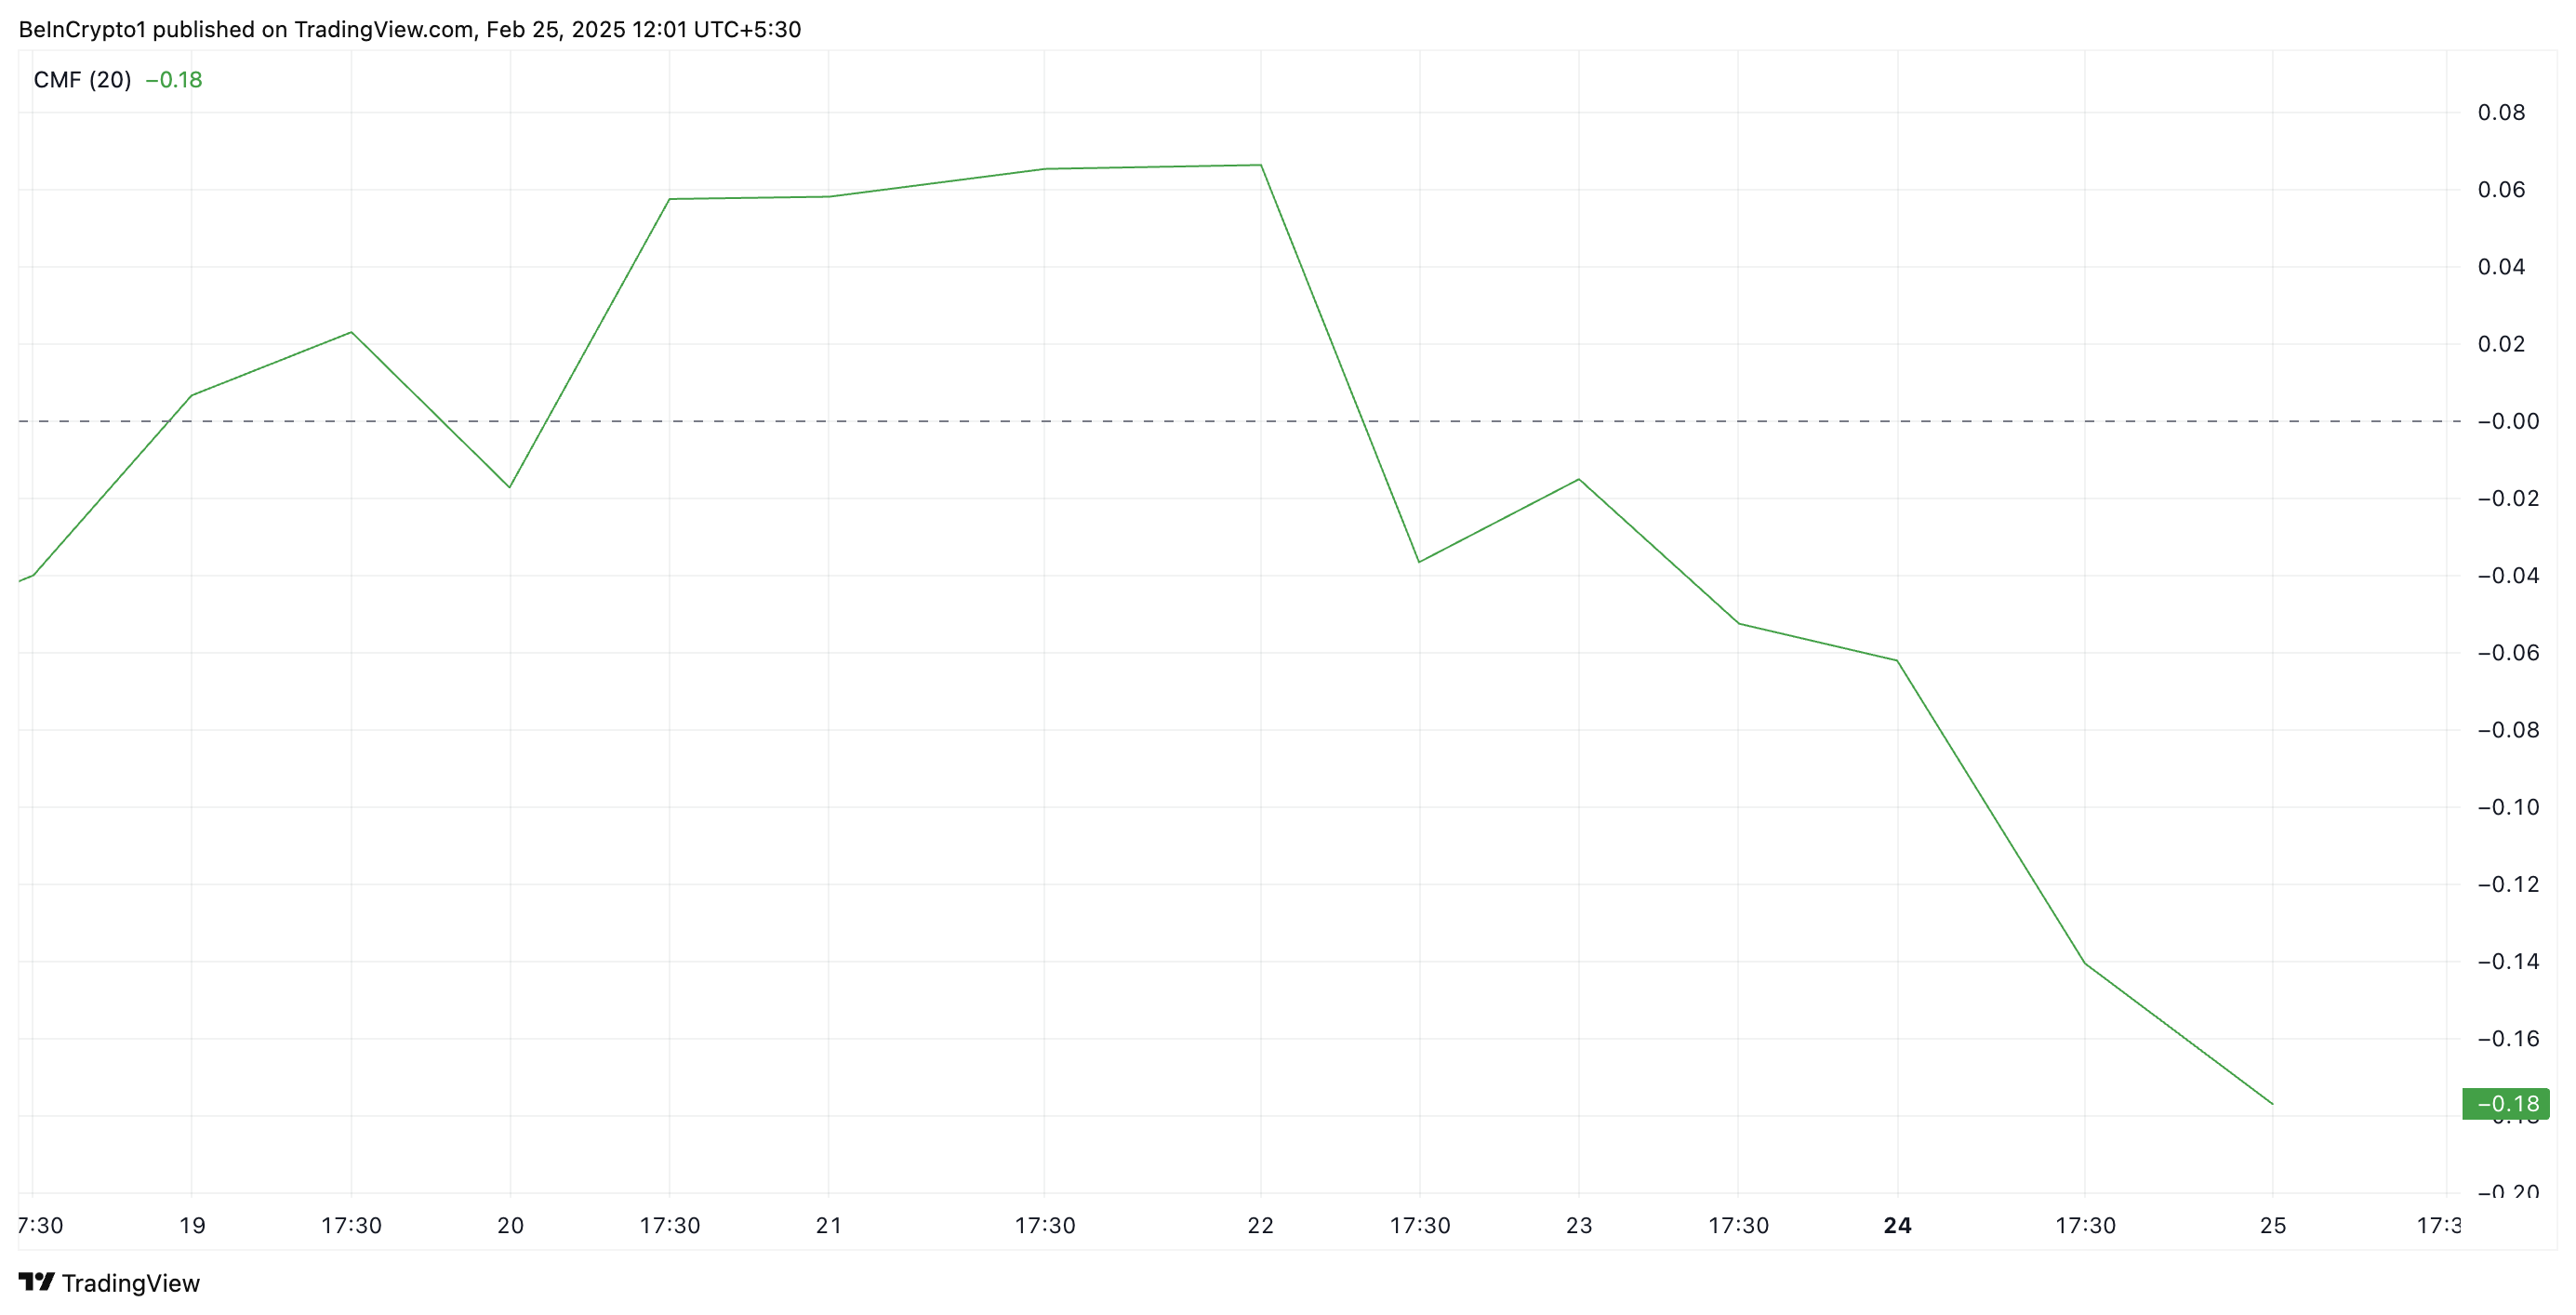
This momentum indicator measures money flows into and out of an asset. A negative CMF reading like this means that selling pressure outweighs accumulation efforts among market participants. It is a bearish setup that traders interpret as a signal to exit long positions and take short ones as they anticipate further price declines.
HBAR Faces Strong Resistance as Downtrend Persists
HBAR continues to trade below a descending trendline, keeping its price low since reaching its year-to-date high of $0.40. With waning demand and strengthening selloffs, HBAR’s price may remain below this trend line in the near term.
When an asset trades below a descending trendline, it indicates that bearish momentum is dominant, with sellers consistently driving prices lower. This suggests HBAR will remain in a downtrend until it breaks above the trendline with strong buying pressure.
If the decline persists, HBAR’s price could fall to $0.169.
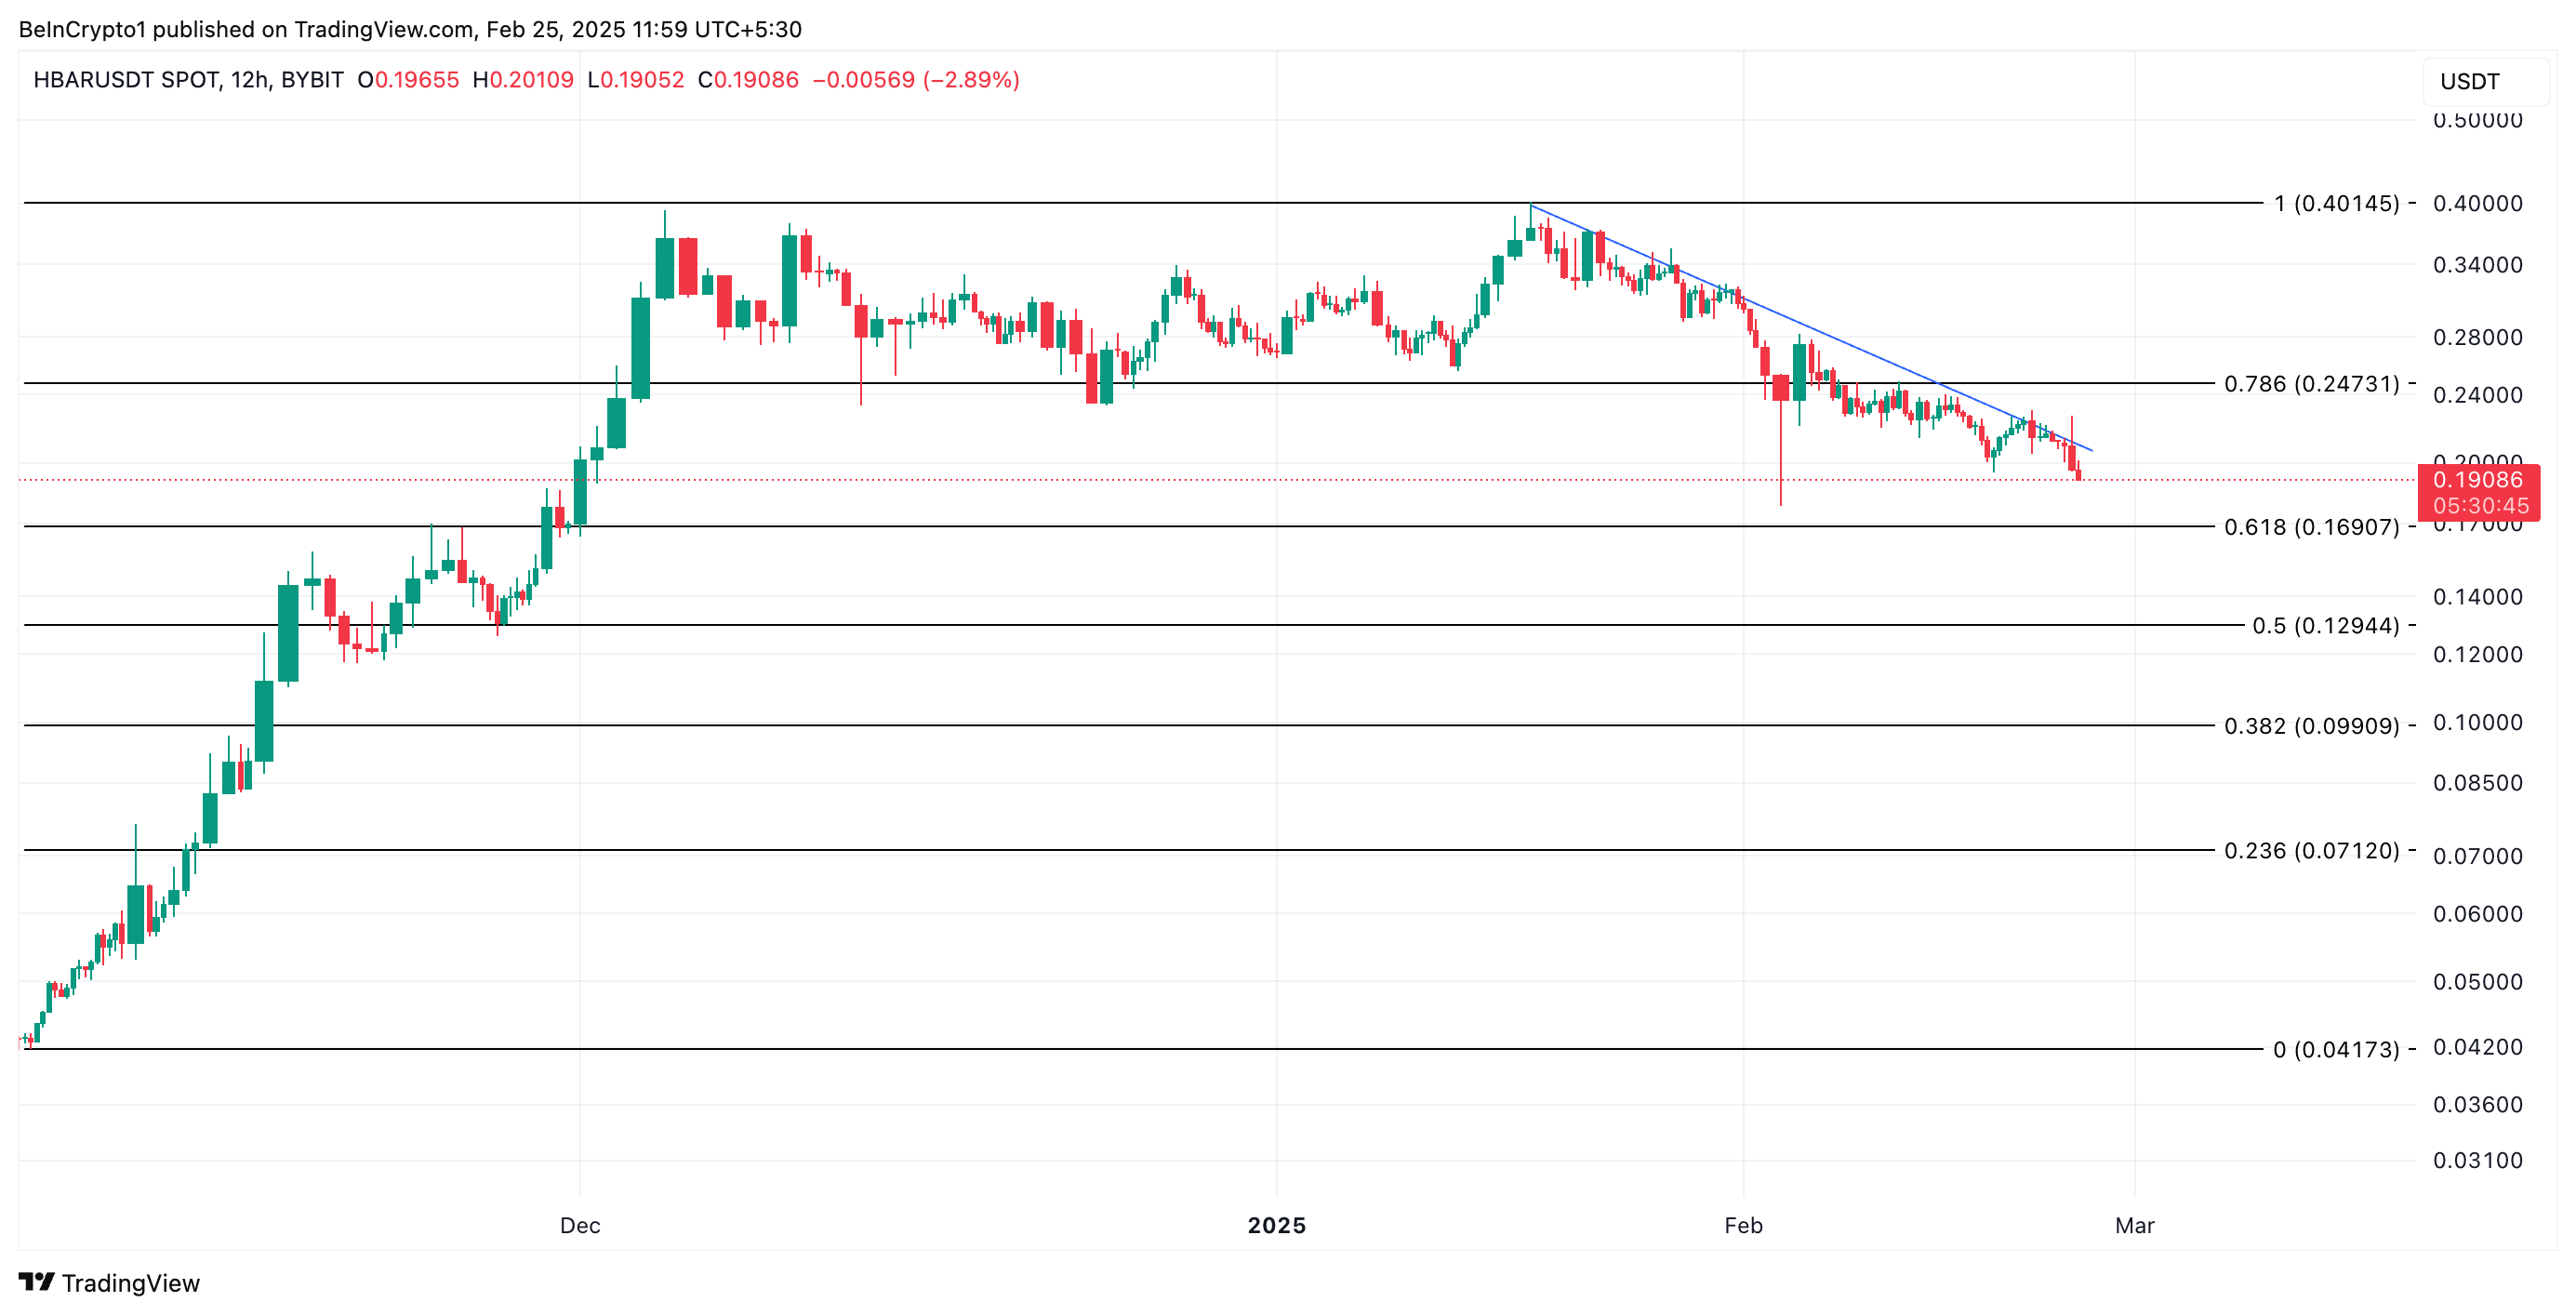
On the other hand, a spike in demand could reverse this trend and send HBAR upward to $0.247.
Disclaimer
In line with the Trust Project guidelines, this price analysis article is for informational purposes only and should not be considered financial or investment advice. BeInCrypto is committed to accurate, unbiased reporting, but market conditions are subject to change without notice. Always conduct your own research and consult with a professional before making any financial decisions. Please note that our Terms and Conditions, Privacy Policy, and Disclaimers have been updated.