
Over the past week, Hedera has recorded steady outflows from its spot market, signaling a lack of confidence among market participants.
The surge in selling pressure highlights the weakening demand for the altcoin, raising concerns about its ability to hold above the key $0.20 support level.
Hedera Outflows Signal Weak Demand
The past week has been marked by significant outflows from HBAR spot markets, with investors pulling over $17 million in the last seven days. According to Coinglass data, the altcoin has seen just one inflow during this period, with $1.78 million recorded on January 19.
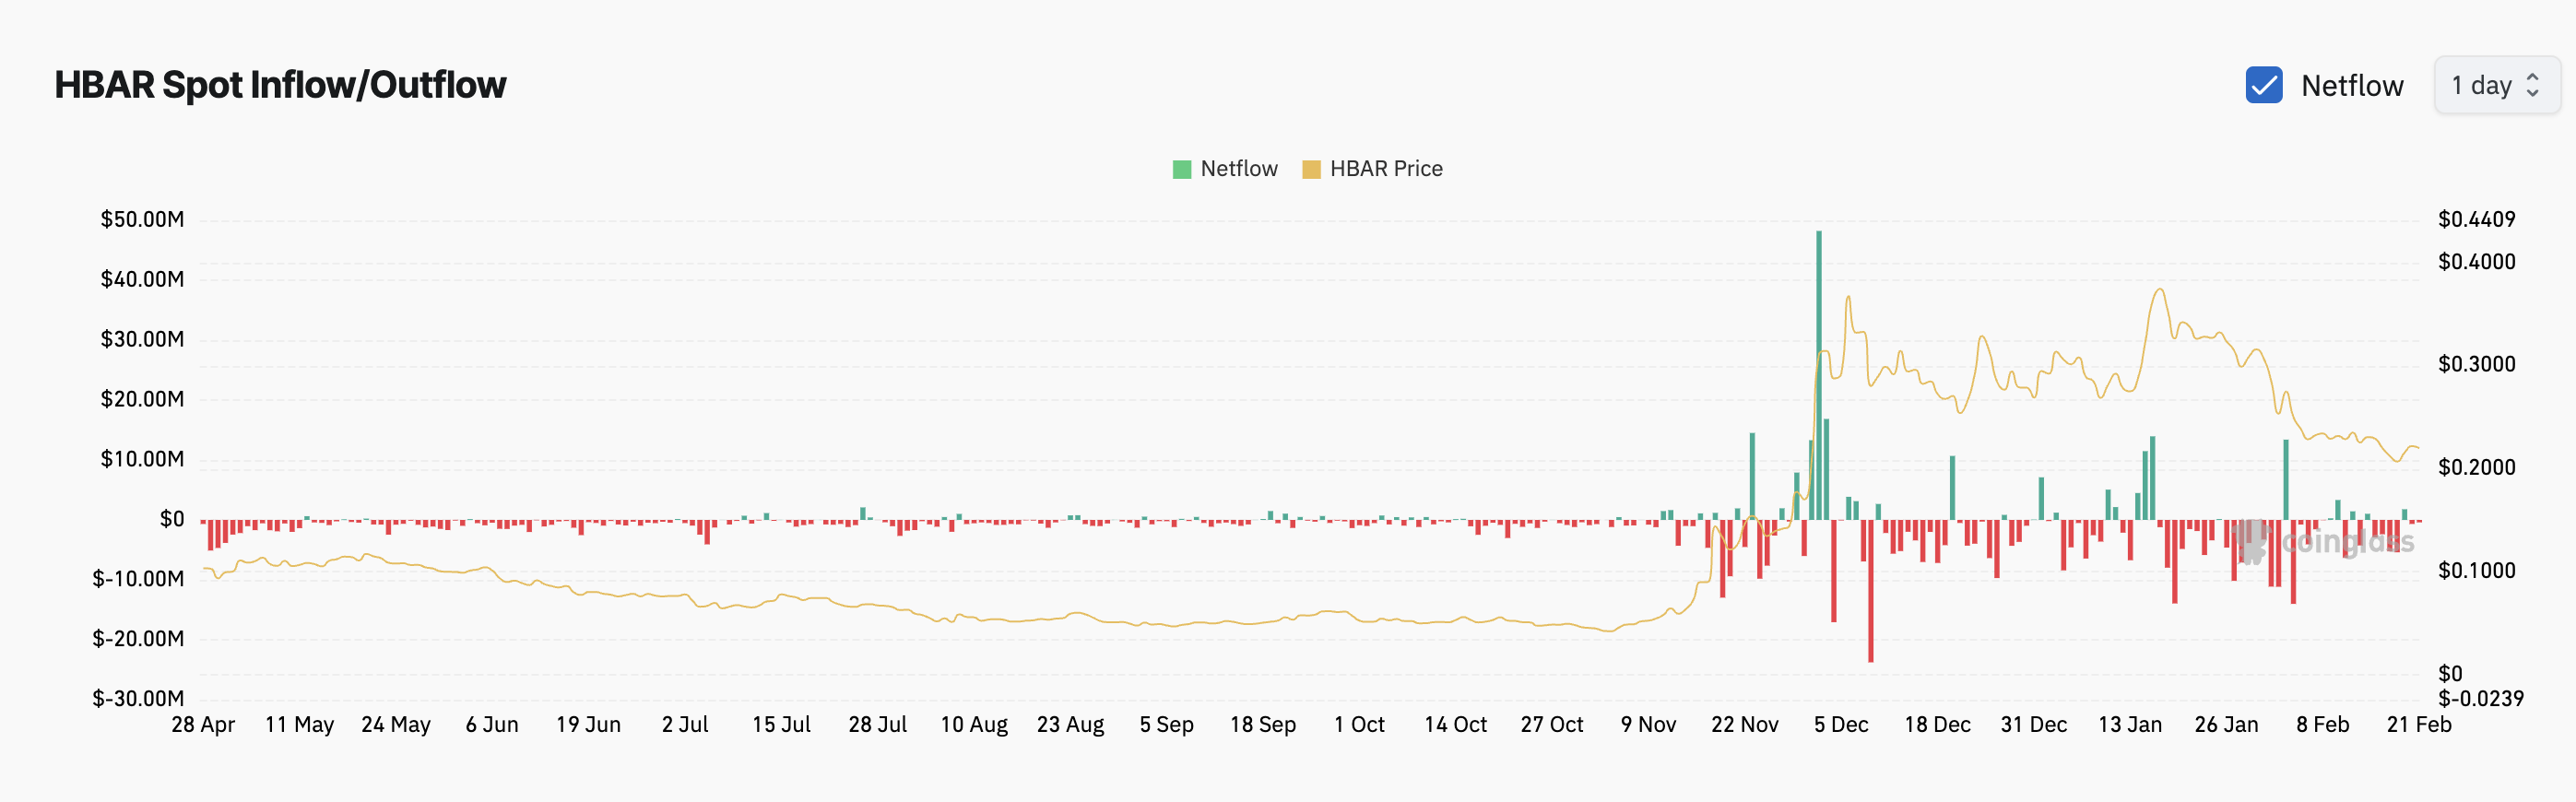
Spot outflows occur when an asset’s investors withdraw their capital from its spot markets, typically by selling their holdings and moving funds elsewhere. This signals weakening demand and increased selling pressure, which can drive the asset’s price lower.
HBAR’s consistent outflows suggest a bearish market sentiment as traders prefer to exit their positions rather than accumulate more of the asset.
Notably, the token’s negative weighted sentiment confirms this bearish market sentiment. According to Santiment, the on-chain metric, which analyzes social media and online platforms to gauge the overall tone (positive or negative) surrounding a cryptocurrency, has returned only negative values all week. This reflects the lack of optimism among HBAR holders about its future performance.
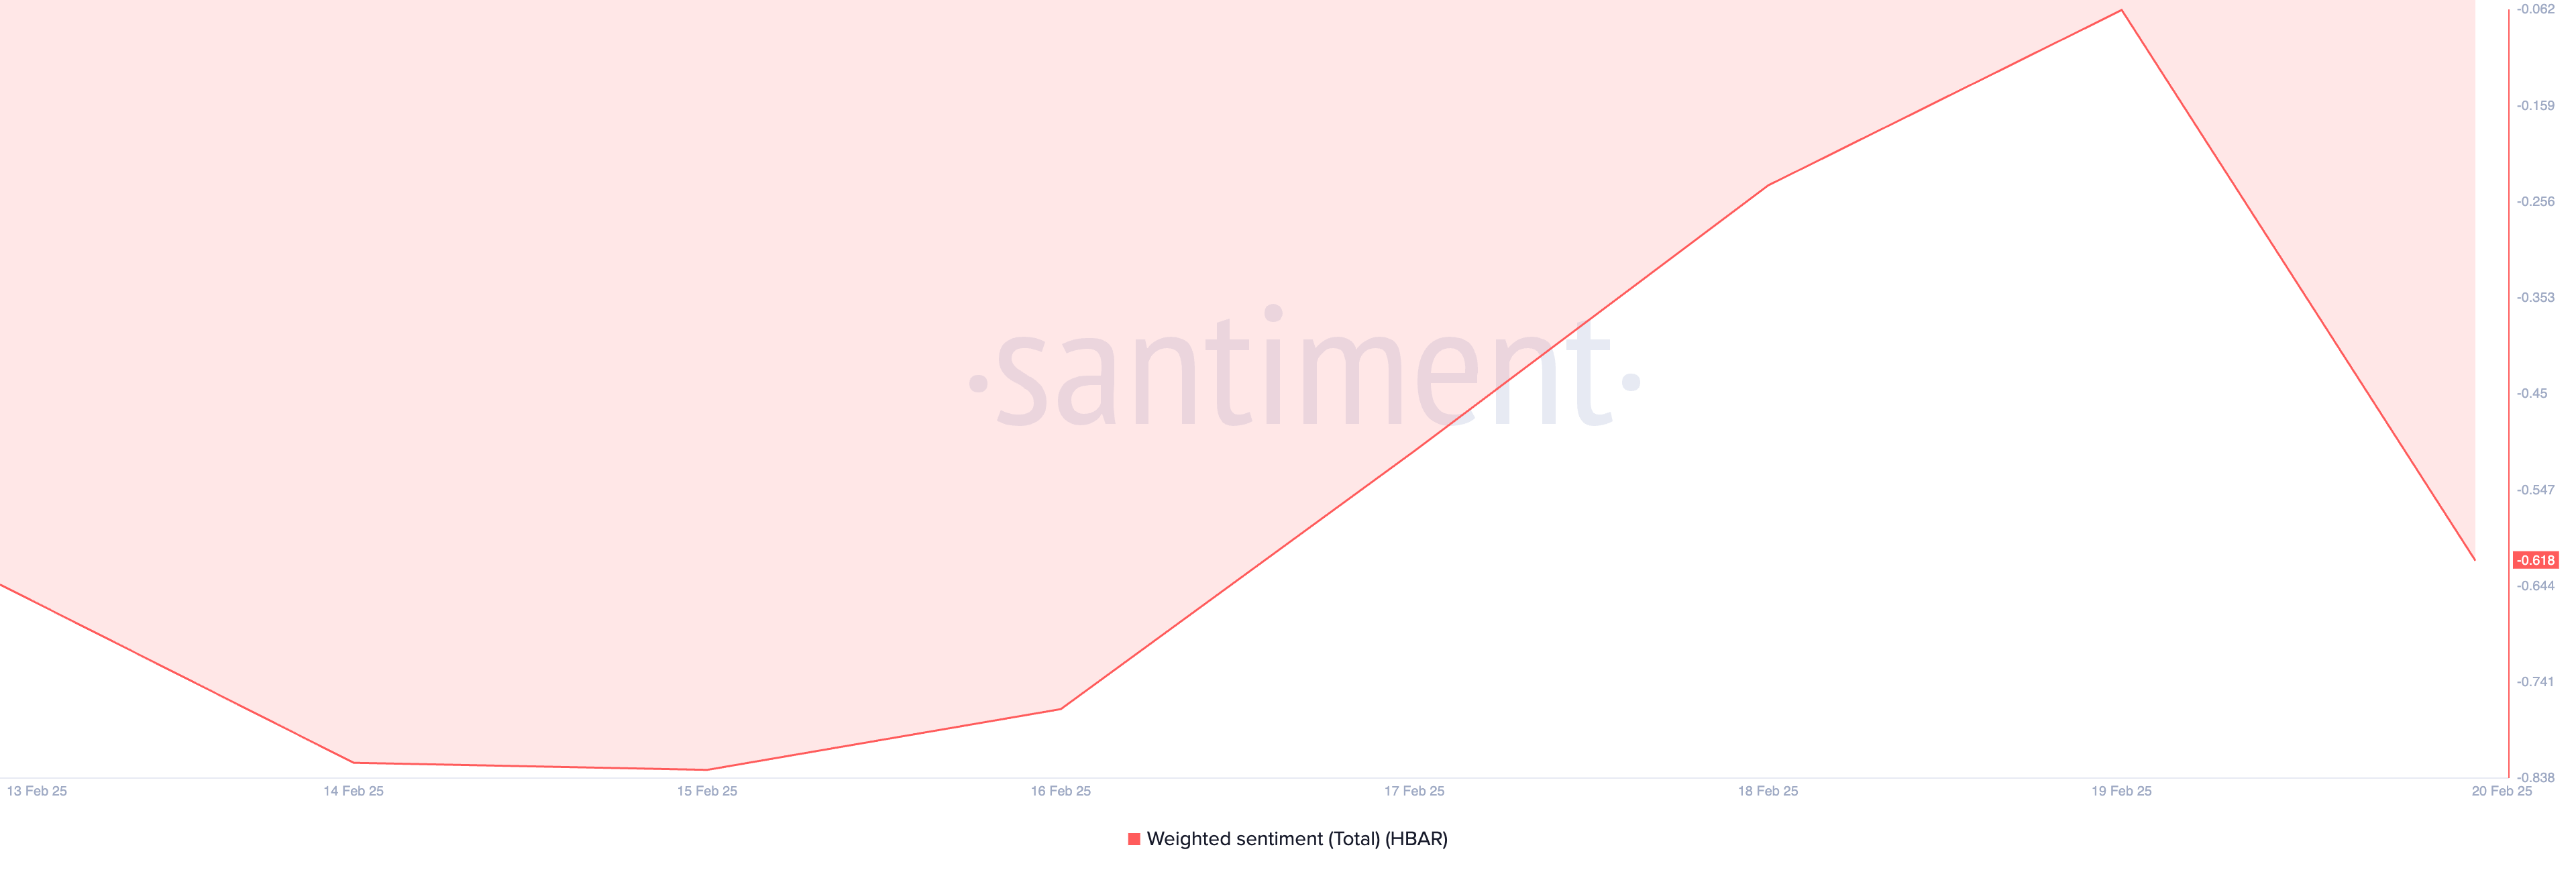
As of this writing, the token’s weighted sentiment is -0.61. When this metric’s value is negative, it indicates that overall market sentiment regarding the asset is bearish, with more negative discussions and outlooks outweighing positive ones. It hints at the likelihood of an extended price decline as traders remain unmotivated to open more trades.
HBAR Bears in Control: Can It Hold Above $0.20?
BeInCrypto’s assessment of HBAR’s performance on the daily chart reveals that since reaching a four-year high of $0.40 on January 17, it has trended below a descending trend line, confirming its price decline. Exchanging hands at $0.21 at press time, the token’s value has since plummeted by 48%.
When an asset trades below a descending trend line, it indicates a sustained downtrend, where selling pressure consistently exceeds buying activity. This suggests that HBAR struggles to rally above resistance, reinforcing the likelihood of a further price dip. If the struggle continues, its price could drop below the $0.20 price zone to trade at $0.17.
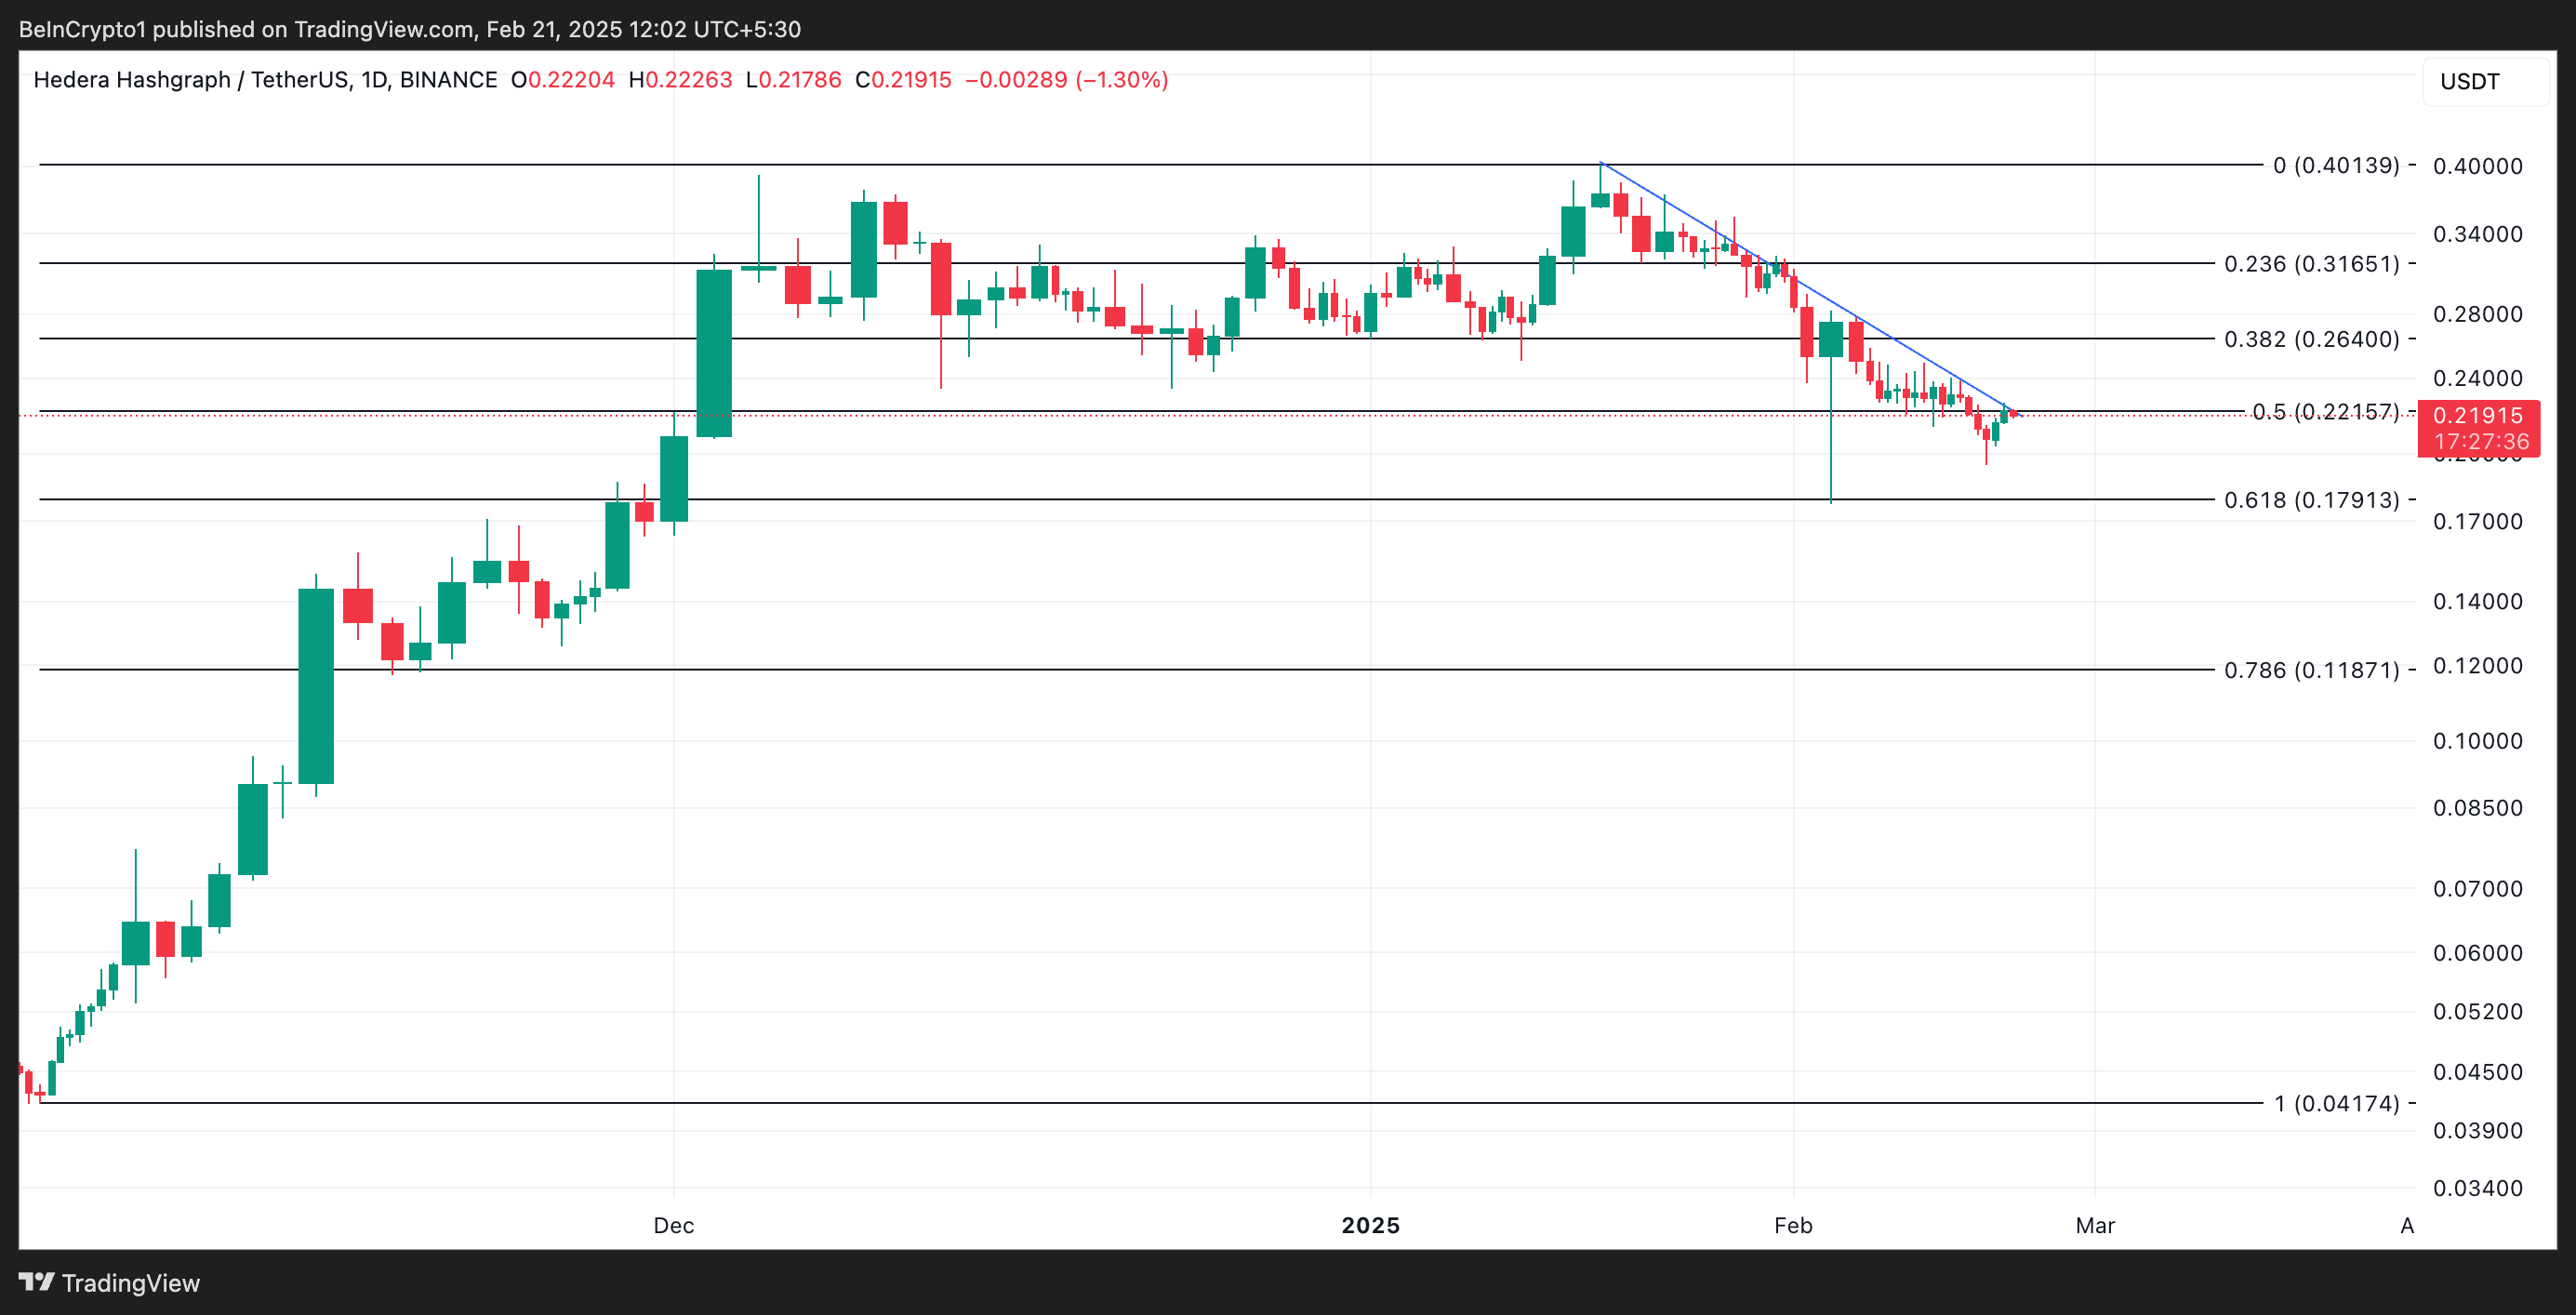
On the other hand, a resurgence in demand will invalidate this bearish projection. HBAR’s price could break above the descending trend line and climb to $0.26 if that happens.
Disclaimer
In line with the Trust Project guidelines, this price analysis article is for informational purposes only and should not be considered financial or investment advice. BeInCrypto is committed to accurate, unbiased reporting, but market conditions are subject to change without notice. Always conduct your own research and consult with a professional before making any financial decisions. Please note that our Terms and Conditions, Privacy Policy, and Disclaimers have been updated.