

Pi Network (PI) IoU price has experienced a sharp surge in recent days as anticipation builds for its Open Network launch on February 20. Between February 9 and February 12, PI skyrocketed by 78%.
However, it’s important to notice this is not a real price but an IoU price, which refers to the price of a token that represents an “I Owe You” (IOU) contract, commonly used for assets that are not yet fully tradable on exchanges.
PI DMI Shows The Trend Is Easing, But It’s Still Strong
The project’s upcoming launch has also attracted legal scrutiny, with experts issuing warnings about potential regulatory risks. As PI’s price momentum remains volatile, technical indicators now suggest that the asset could either extend its rally or face a significant correction.
Pi Network Directional Movement Index (DMI) shows a notable shift in momentum. The Average Directional Index (ADX) is currently at 46.6, down from 56.9 yesterday.
This comes after a rapid surge from 19.1 in just five days, highlighting a period of strong trend development. ADX measures the strength of a trend rather than its direction, with values above 25 typically indicating a trending market and readings above 50 suggesting an exceptionally strong trend.
The recent decline from its peak suggests that while the trend remains intact, its strength is starting to cool off, potentially signaling a transition phase.
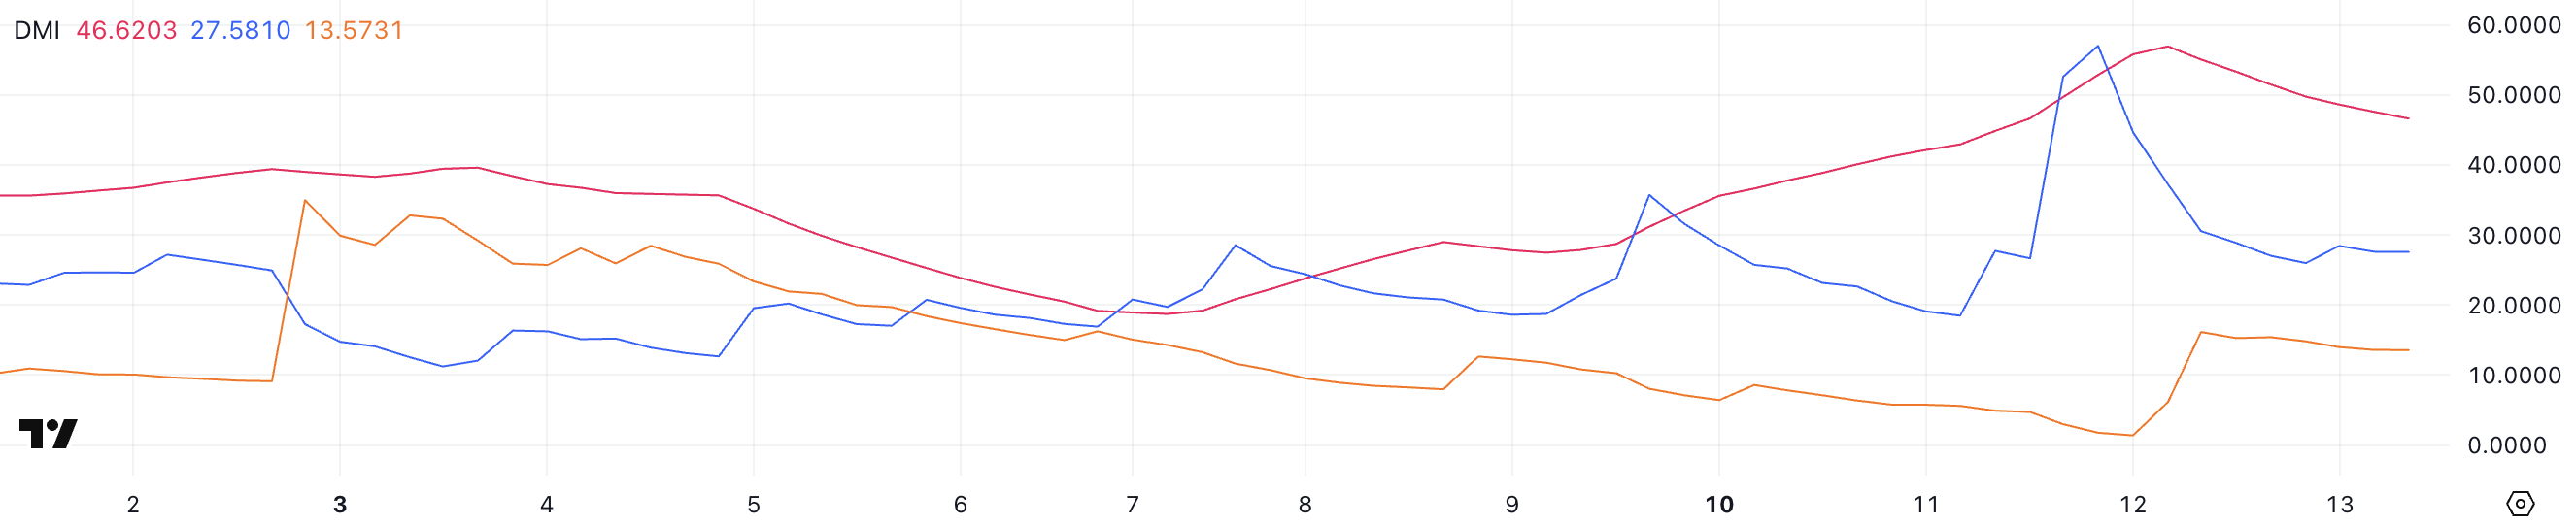
Meanwhile, the +DI (positive directional index) has fallen sharply to 27.5 after reaching 57 just two days ago, indicating that buying pressure has eased considerably.
At the same time, the -DI (negative directional index) has climbed to 13.5 from a low of 1.38, reflecting an uptick in selling pressure. Despite this shift, the uptrend remains intact as +DI is still above -DI, meaning buyers maintain control for now.
However, the sharp contraction in +DI and the rising -DI suggest that bullish momentum is weakening. If this trend continues, it could lead to a more balanced or even corrective phase for PI’s price movement.
PI RSI Is Now Neutral After Touching 92
PI’s Relative Strength Index (RSI) has seen a sharp decline, currently sitting at 54.8 after dropping from an extreme high of 92 just yesterday. RSI is a momentum oscillator that measures the speed and magnitude of recent price movements on a scale of 0 to 100.
Generally, readings above 70 indicate overbought conditions, suggesting that an asset may be overextended to the upside, while readings below 30 signal oversold conditions, implying potential undervaluation. A rapid drop from such elevated levels suggests a strong shift in momentum, often signaling profit-taking or the beginning of a consolidation phase.
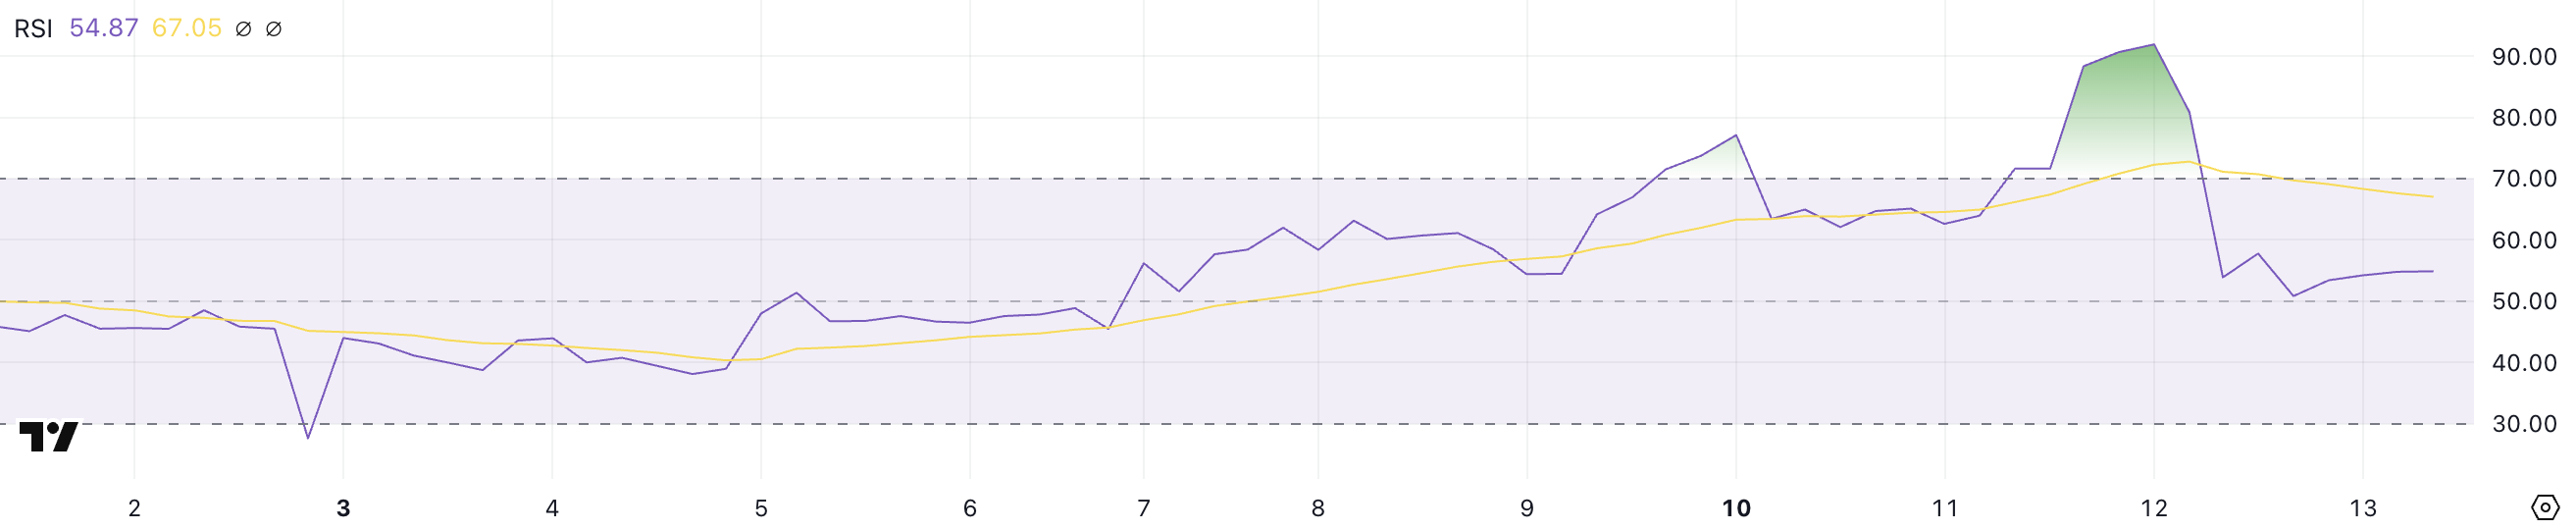
With PI RSI now at 54.8, the asset is back in a more neutral zone, meaning the intense buying pressure that pushed it into overbought territory has cooled off. While this doesn’t necessarily indicate a downtrend, it does suggest that the explosive rally may have lost steam.
If RSI stabilizes around this level or begins climbing again, it could indicate the continuation of an uptrend with more sustainable momentum. However, if it continues to decline toward 40 or lower, it may signal weakening bullish strength, increasing the risk of a deeper pullback.
PI Price Prediction: On Which Range Will PI Price Launch?
Pi Network price chart shows its Exponential Moving Average (EMA) lines indicate that bullish momentum remains intact, with short-term EMAs still positioned above the longer-term ones.
This alignment suggests that buyers continue to dominate, keeping the trend upward for now. If this positive momentum persists, PI could push toward a key resistance level at $68.7.
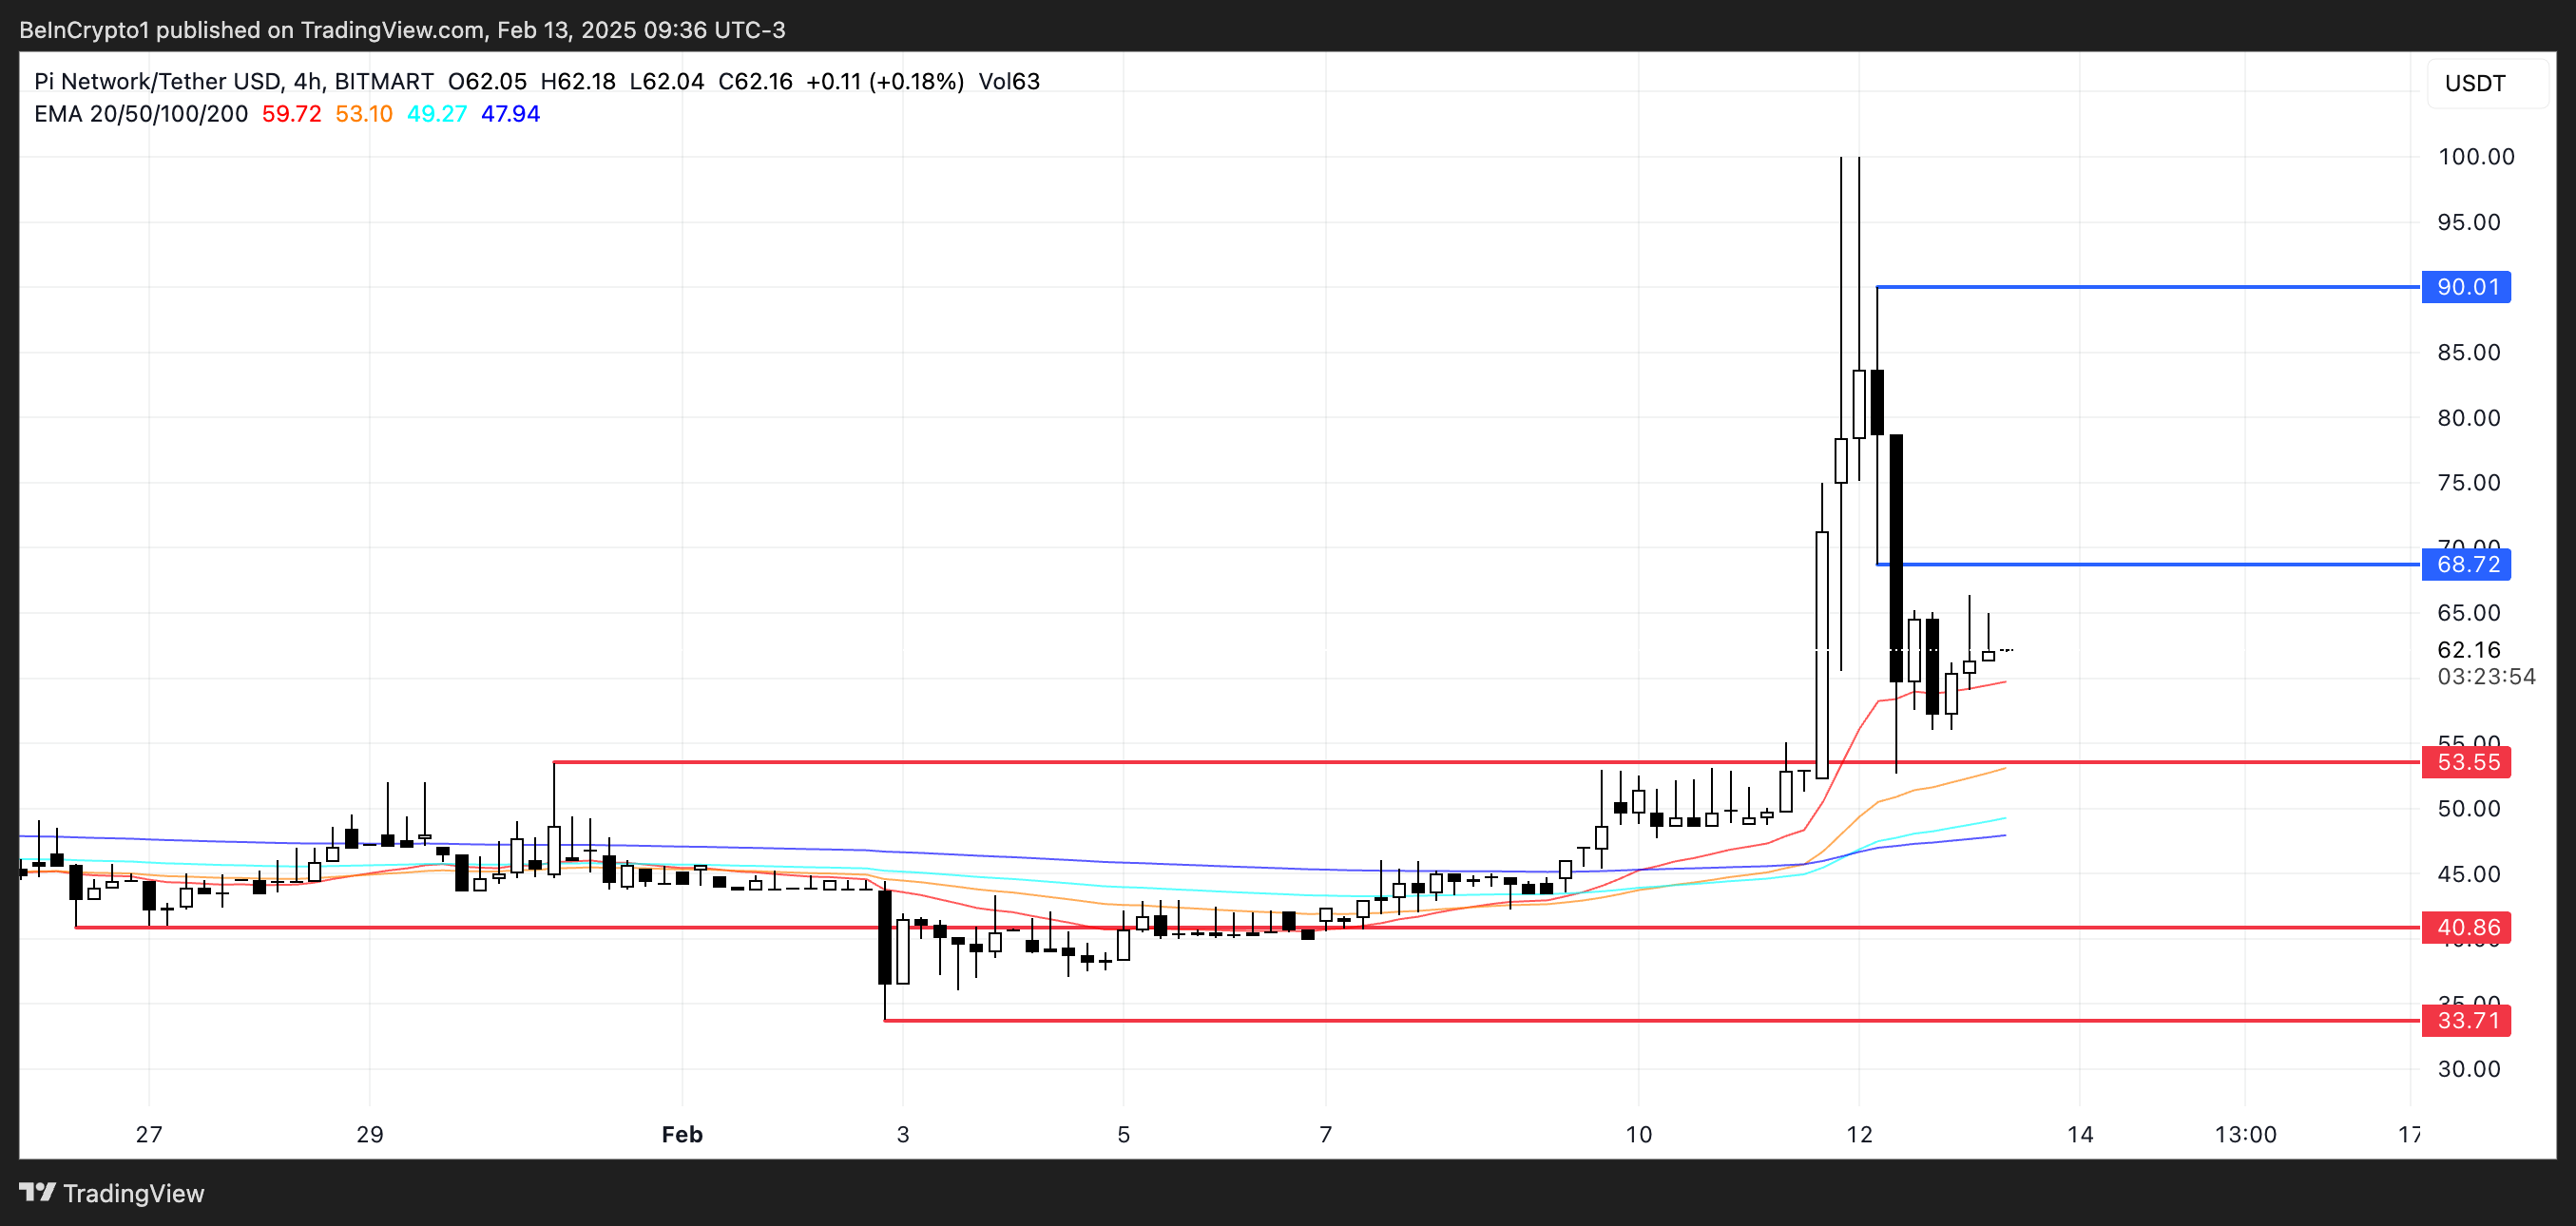
However, if enthusiasm for the altcoin fades, the price could face a pullback, testing the nearest support at $53.5.
Losing this level could trigger further downside, with PI price potentially falling to $40.8 and even $33.7, establishing the range between $40.8 and $68.7 as its potential price during launch.
Disclaimer
In line with the Trust Project guidelines, this price analysis article is for informational purposes only and should not be considered financial or investment advice. BeInCrypto is committed to accurate, unbiased reporting, but market conditions are subject to change without notice. Always conduct your own research and consult with a professional before making any financial decisions. Please note that our Terms and Conditions, Privacy Policy, and Disclaimers have been updated.