

Hedera (HBAR) price has experienced a sharp decline, dropping more than 13% in the last 24 hours and 19% over the past week. This downturn has pushed HBAR’s market cap down to $9 billion, causing it to lose the crucial $10 billion threshold.
Technical indicators, including a rising ADX and a bearish Ichimoku Cloud setup confirm the increasing strength of the current downtrend. With a recent death cross forming on its EMA lines, HBAR now faces critical support levels. At the same time, any potential recovery would need to reclaim key resistances to reverse the current bearish momentum.
Hedera ADX Indicates the Current Downtrend Is Strong
Hedera Average Directional Index (ADX) is currently at 43.3, a sharp rise from 11.4 just three days ago. This significant increase suggests that the strength of HBAR’s current trend is intensifying.
The ADX indicator measures trend strength without indicating direction, meaning it can apply to both upward and downward trends. Given HBAR’s ongoing downtrend, this surge in ADX reflects growing momentum in the current price movement, reinforcing the prevailing bearish sentiment.
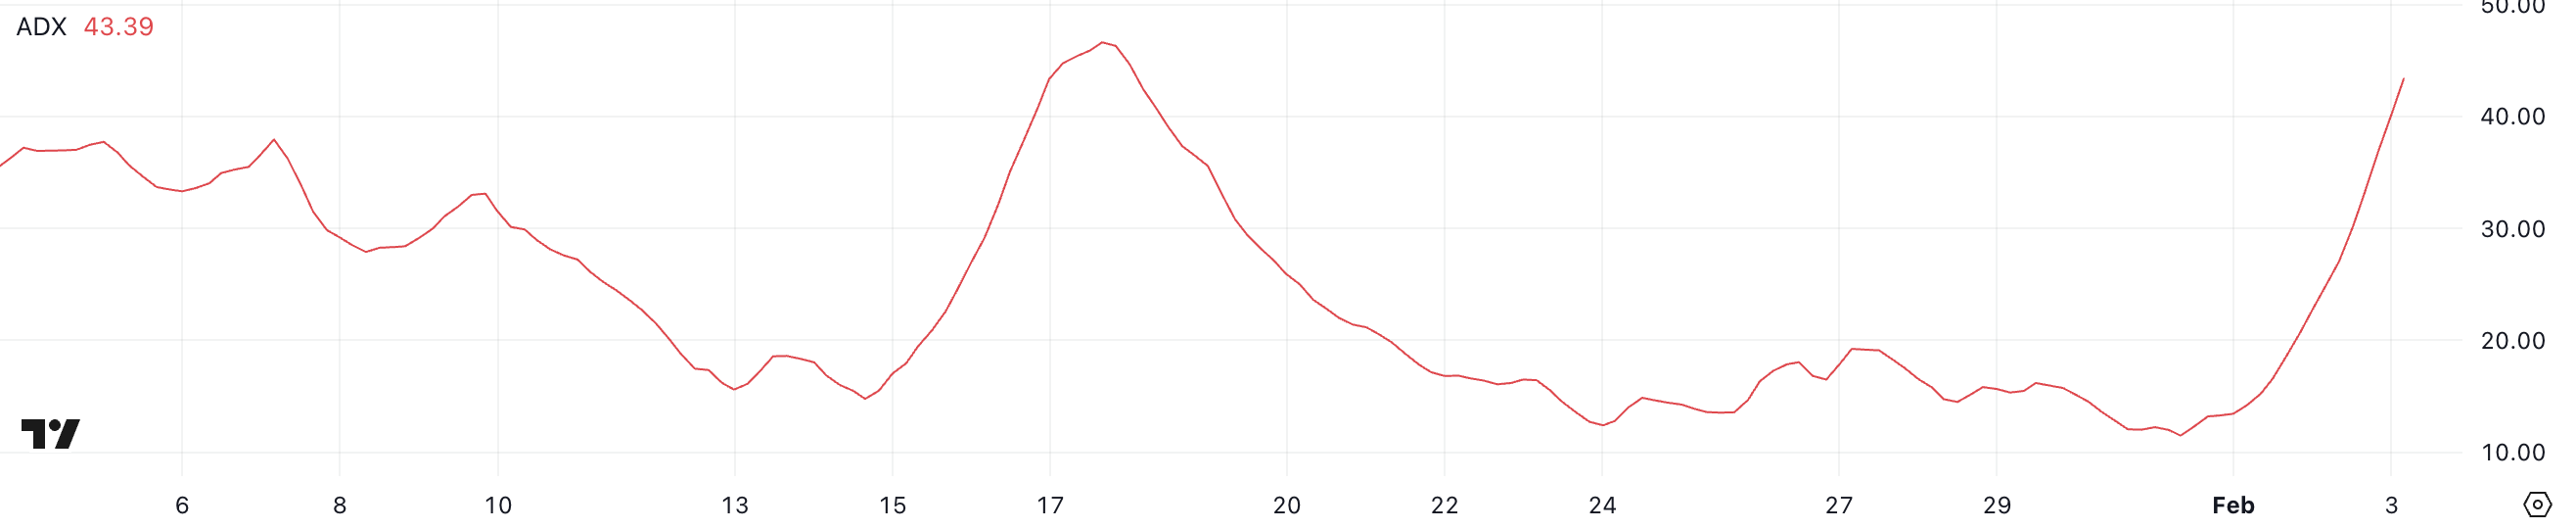
ADX values range from 0 to 100, with readings below 20 indicating a weak or non-existent trend, while values above 25 signal a strengthening trend. When ADX surpasses 40, it suggests a strong trend in place. With HBAR ADX now at 43.3, the downtrend appears to be gaining traction rather than weakening.
This could mean further downside pressure unless a significant shift in buying activity occurs. A high ADX in a downtrend often signals strong bearish momentum, making it difficult for the price to reverse in the short term without a clear change in market structure.
HBAR Ichimoku Cloud Shows a Bearish Setup
The Ichimoku Cloud on the HBAR chart signals a clear bearish trend. The price is currently trading below the cloud, which indicates a downtrend. Additionally, the cloud ahead is red, suggesting that bearish momentum is expected to continue. The Tenkan-sen (blue line) is below the Kijun-sen (red line), reinforcing the short-term bearish structure.
Meanwhile, the Chikou Span (green line) is also below the price action, confirming the overall downward bias. The recent sharp drop and subsequent weak rebound indicate that sellers remain in control.
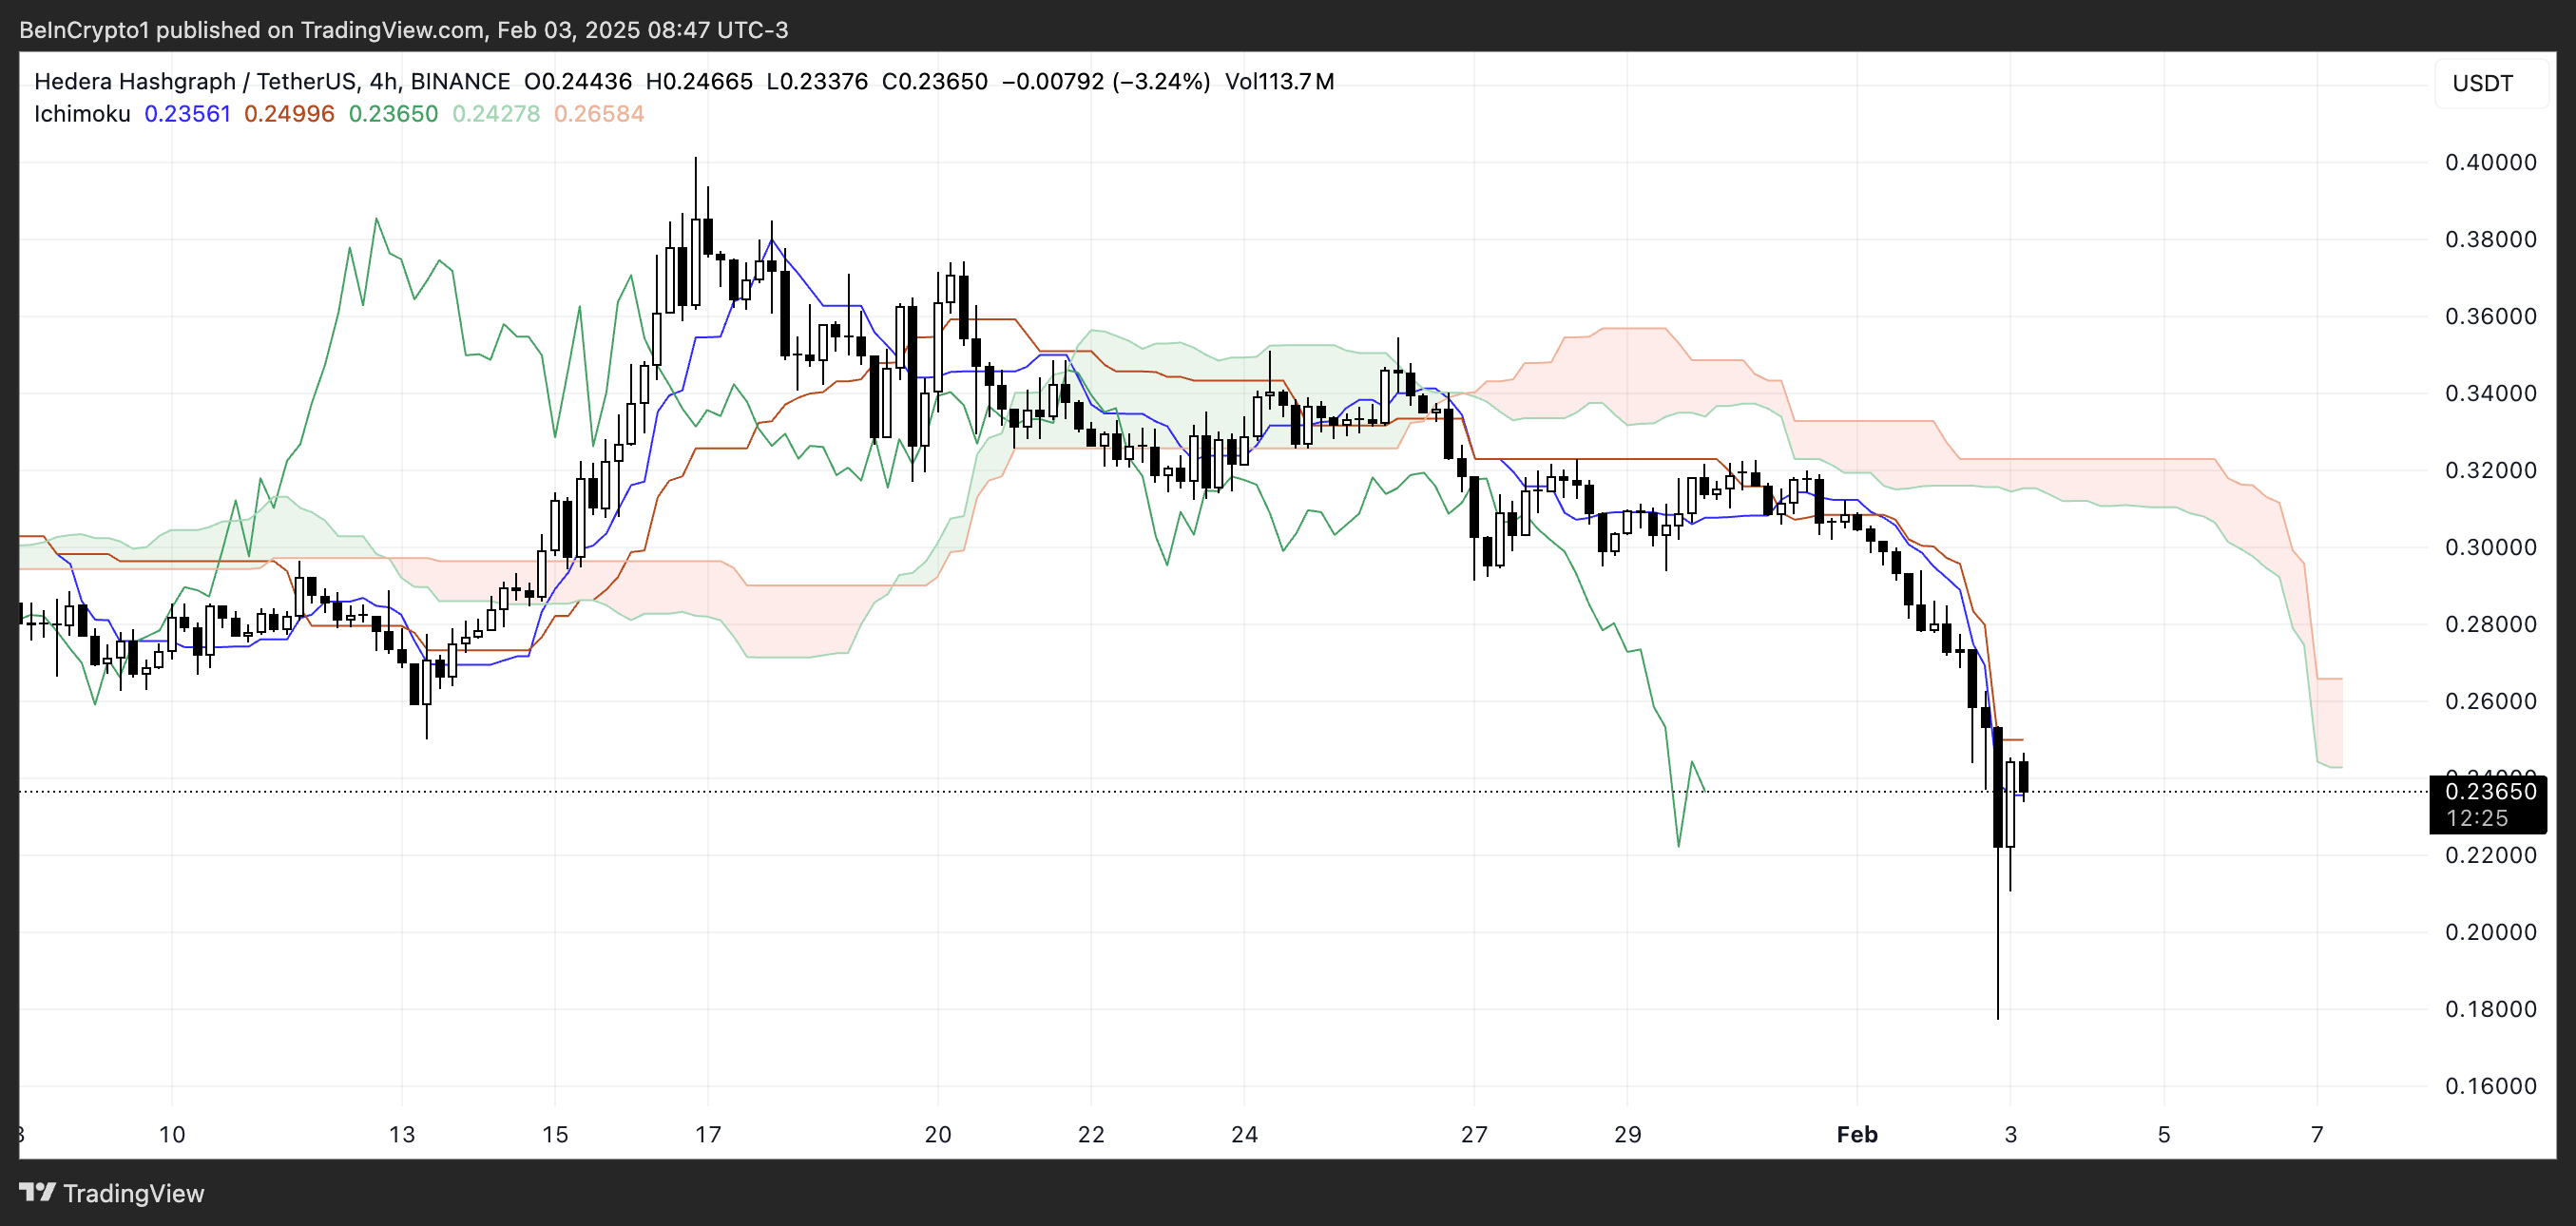
For HBAR price to reverse its bearish trend, it would need to reclaim the cloud and establish support above it. However, with the future cloud projected as bearish and the price failing to show signs of a strong reversal, further downside remains likely.
If selling pressure continues, HBAR may struggle to break above resistance levels near the Kijun-sen. On the other hand, a decisive push above the cloud could shift momentum, but at the moment, the Ichimoku Cloud setup favors continued downside movement.
HBAR Price Prediction: Can Hedera Fall Below $0.1 In February?
HBAR’s recent price action has taken a bearish turn, with its EMA lines forming a death cross in the last two days. This bearish crossover, where the short-term EMAs fall below the long-term EMAs, signals a potential continuation of the downtrend. If selling pressure persists, Hedera price could test its next key support at $0.125, a level that could determine whether further downside is imminent.
A break below this support would open the door for deeper declines, with $0.053 being the next major level of interest. Given the current structure, the bearish momentum remains strong unless a significant shift in trend occurs.
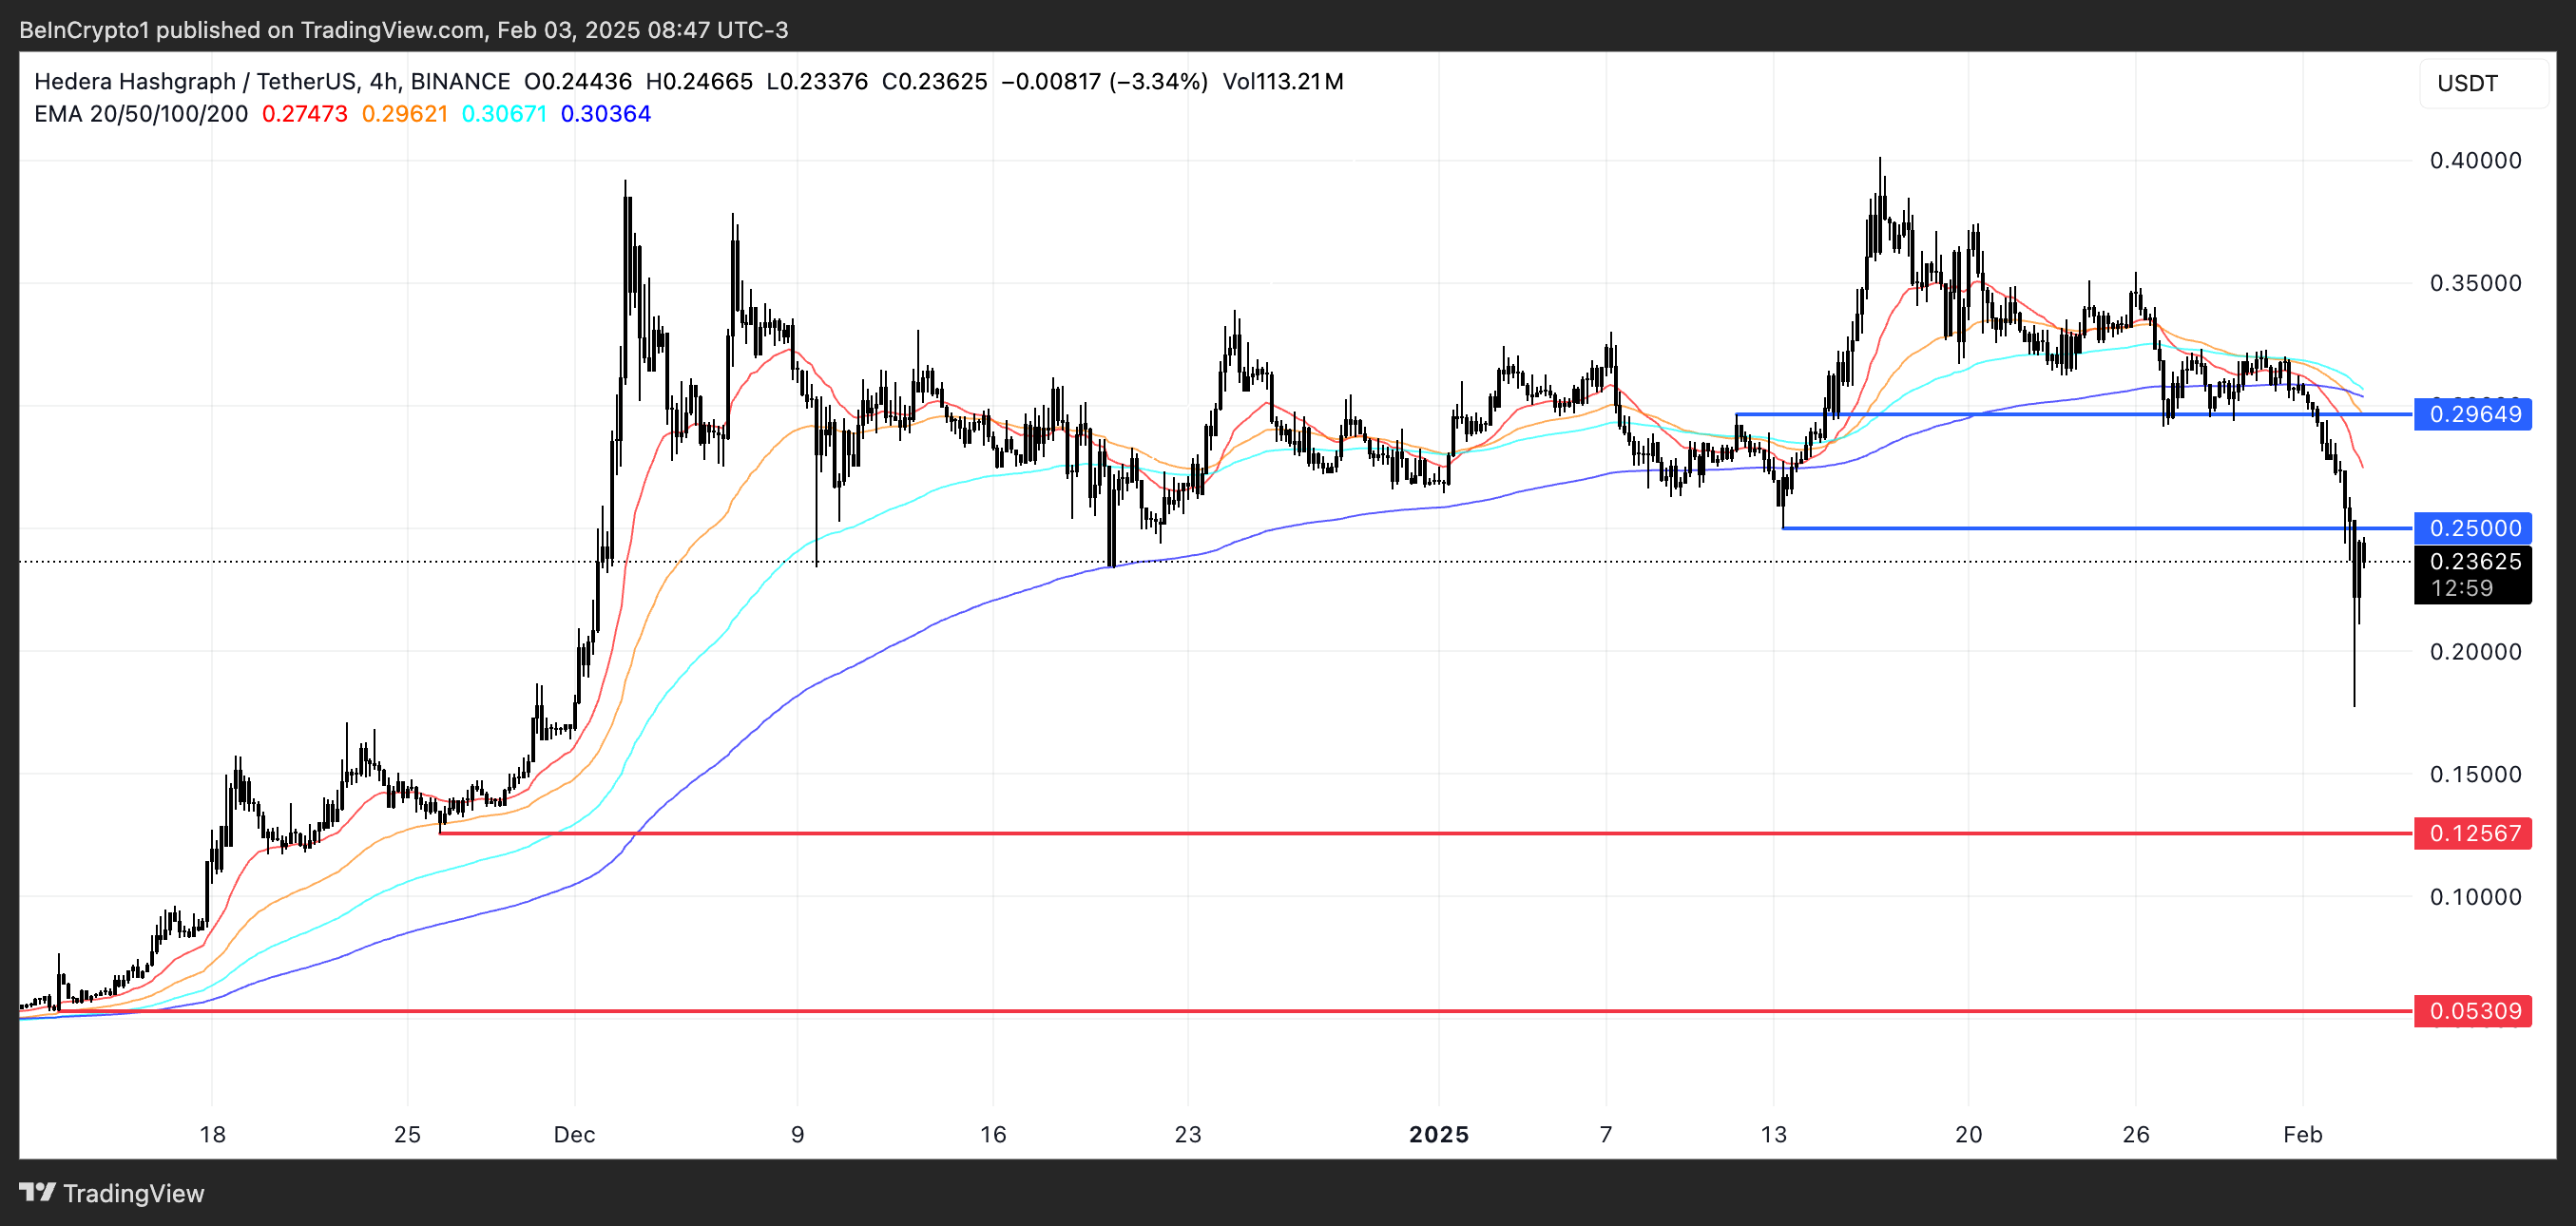
However, if HBAR price manages to regain its bullish momentum from previous months, reclaiming $0.25 as support would be the first sign of strength. A successful breakout above this level could lead to a move toward $0.29, a key resistance that, if breached, would likely fuel further upside.
Beyond that, HBAR could attempt to reclaim levels above $0.30 and even push toward $0.35, where stronger resistance would come into play. For this scenario to unfold, HBAR would need sustained buying pressure and a reversal in trend indicators, as the current setup still favors the downside.
Disclaimer
In line with the Trust Project guidelines, this price analysis article is for informational purposes only and should not be considered financial or investment advice. BeInCrypto is committed to accurate, unbiased reporting, but market conditions are subject to change without notice. Always conduct your own research and consult with a professional before making any financial decisions. Please note that our Terms and Conditions, Privacy Policy, and Disclaimers have been updated.