In light of these developments, full-time trader @cryptoMichNL stated that there are two possible scenarios for the Bitcoin price:💵 2,800,000 #USDC (2,809,588 USD) minted at USDC Treasury
— Whale Alert (@whale_alert) December 11, 2019
Tx: https://t.co/juPvMGZdJ7
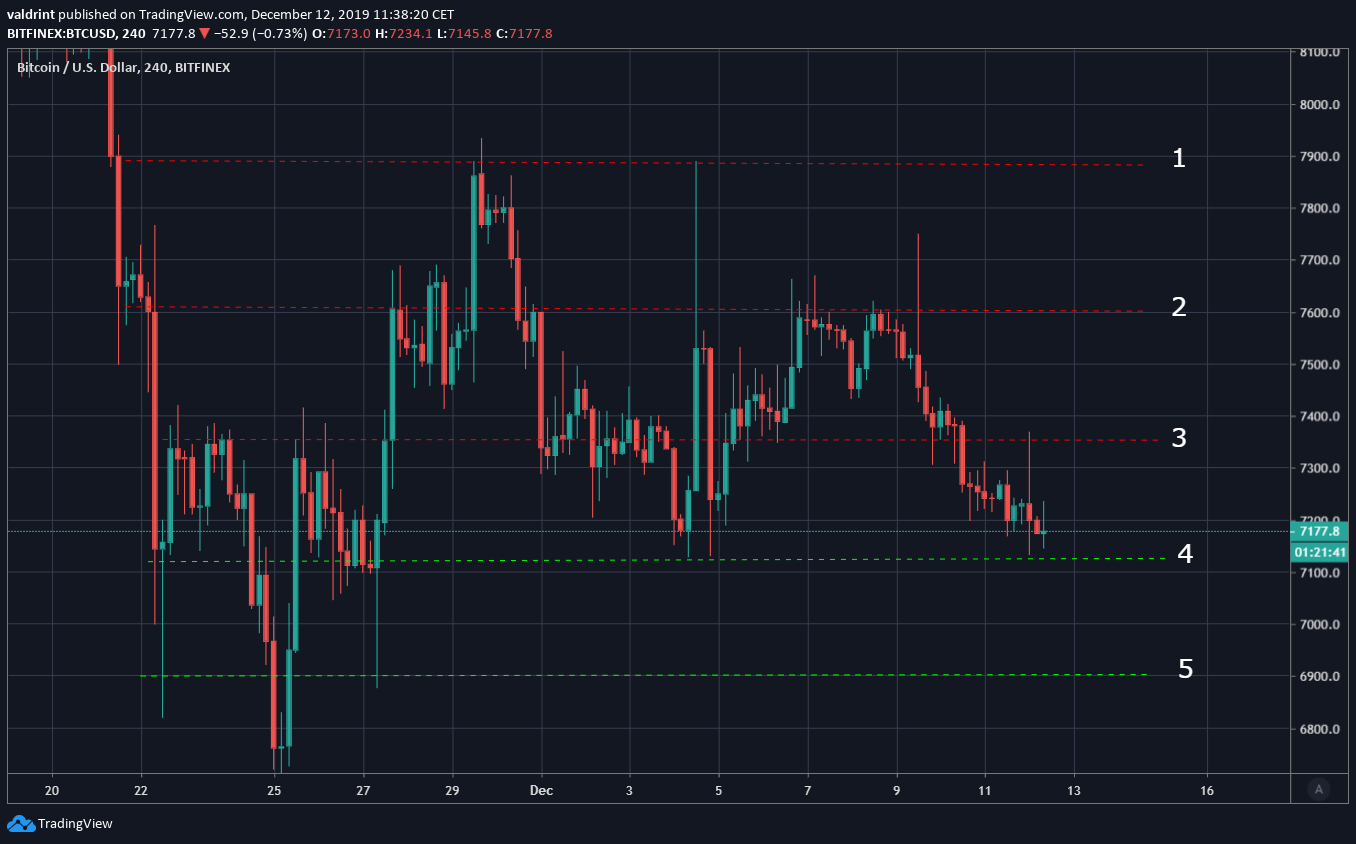
- The current support area at $7100 will hold the price and we will begin moving upward towards the range high at $7600.
- The support will not hold and we will decrease towards $6900 and, possibly, head lower towards the low $6000s.
Which one is more likely to occur? Continue reading below if you are interested in finding out.$BTC #BITCOIN
— Michaël van de Poppe (@CryptoMichNL) December 12, 2019
Boring & fragile markets here.
Either of the two.
1) If green holds, I'd want to see a break up during the day and then we can start aiming for the range highs again.
2) If not, then acceleration will likely occur again and then I'm aiming at a significant drop. pic.twitter.com/uGYfPQ2HqS
Bitcoin’s Trading Range
The Bitcoin price is trading inside a range between $6900-$7600 — with an upper limit of $7900 that was reached but could not be sustained. Currently, the price is trading inside the minor range between $7150-$7350, marked with (4) and (3). In the first scenario, the Bitcoin price will break out above (3) and head towards (2) at $7600. Depending on the strength of the breakout, the price an also reach (1) at $7900. All this movement can still be considered a retracement in response to the prior downward move. A breakout above $7900 would constitute a movement outside of the trading range and the possible beginning of the new upward move. In the second scenario, (4) fails to hold and we head towards (5) and $6900 and possibly lower. If we continue lower, the weekly chart gives us our possible targets.
The first support is found at $6600 at the wick low of November 25. Afterward, the price is likely to find support at $6000, at a confluence of the descending support line of the channel and previous support area.
However, this movement would have massive bearish implications. It would validate the resistance area at $7600, in which the price has not been able to reach a weekly close above, and cause the price to move below the 50- and 100-week moving averages (MA) — which have just made a bullish cross.

Verdict
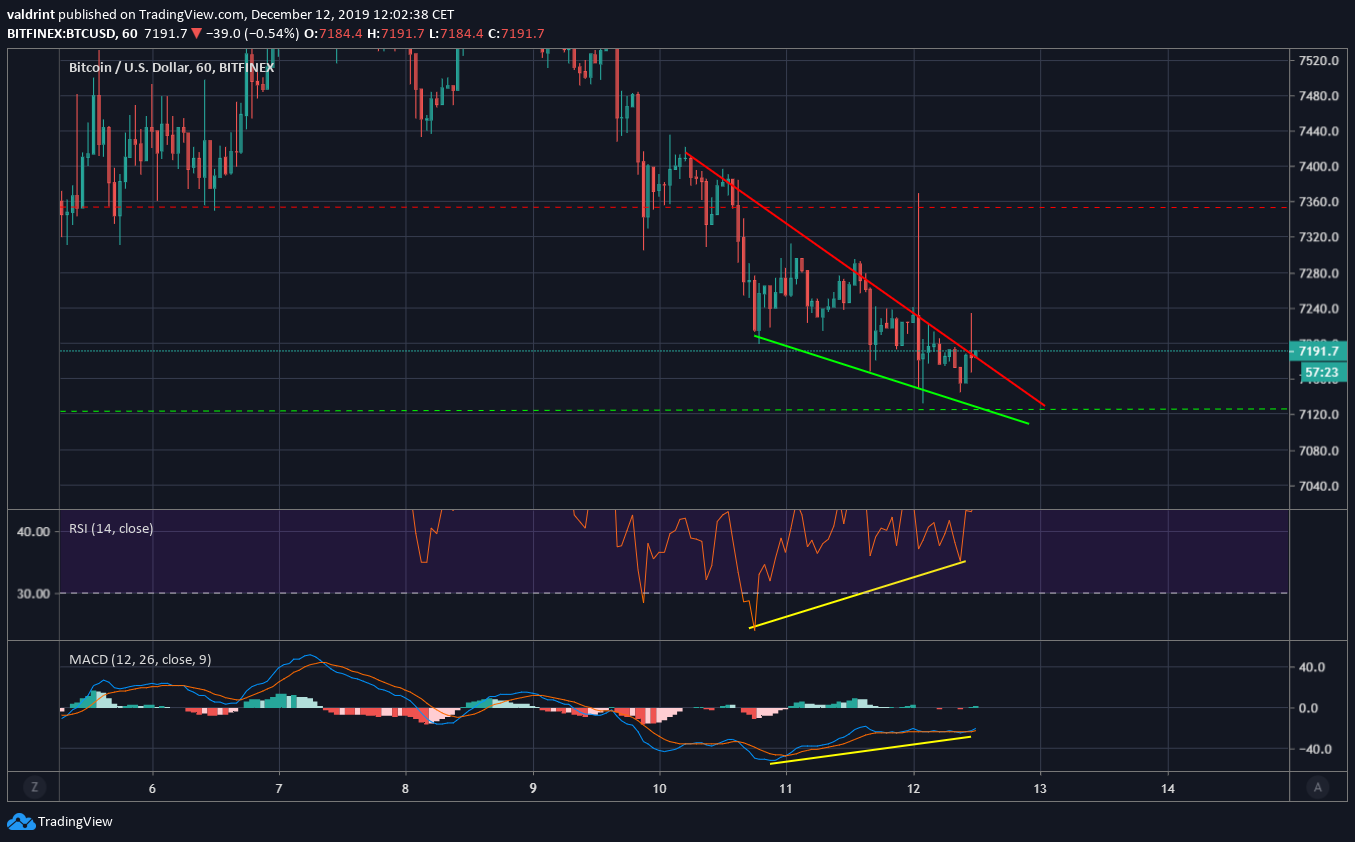
The short-term movement suggests the first scenario is more likely, even if the Bitcoin price might not get all the way to $7600. The Bitcoin price has created a descending wedge, out of which it is currently trying to break out. Additionally, there is a strong bullish divergence developing — suggesting that the breakout will occur. If so, the price should reach $7350 and possibly move higher. To conclude, the Bitcoin price is resting at a strong support of $7100. In the short-term, we are expecting it to move towards the resistance areas at $7350 and, possibly, $7600. However, a drop below $7000 should eventually occur.
Disclaimer
In line with the Trust Project guidelines, this price analysis article is for informational purposes only and should not be considered financial or investment advice. BeInCrypto is committed to accurate, unbiased reporting, but market conditions are subject to change without notice. Always conduct your own research and consult with a professional before making any financial decisions. Please note that our Terms and Conditions, Privacy Policy, and Disclaimers have been updated.


