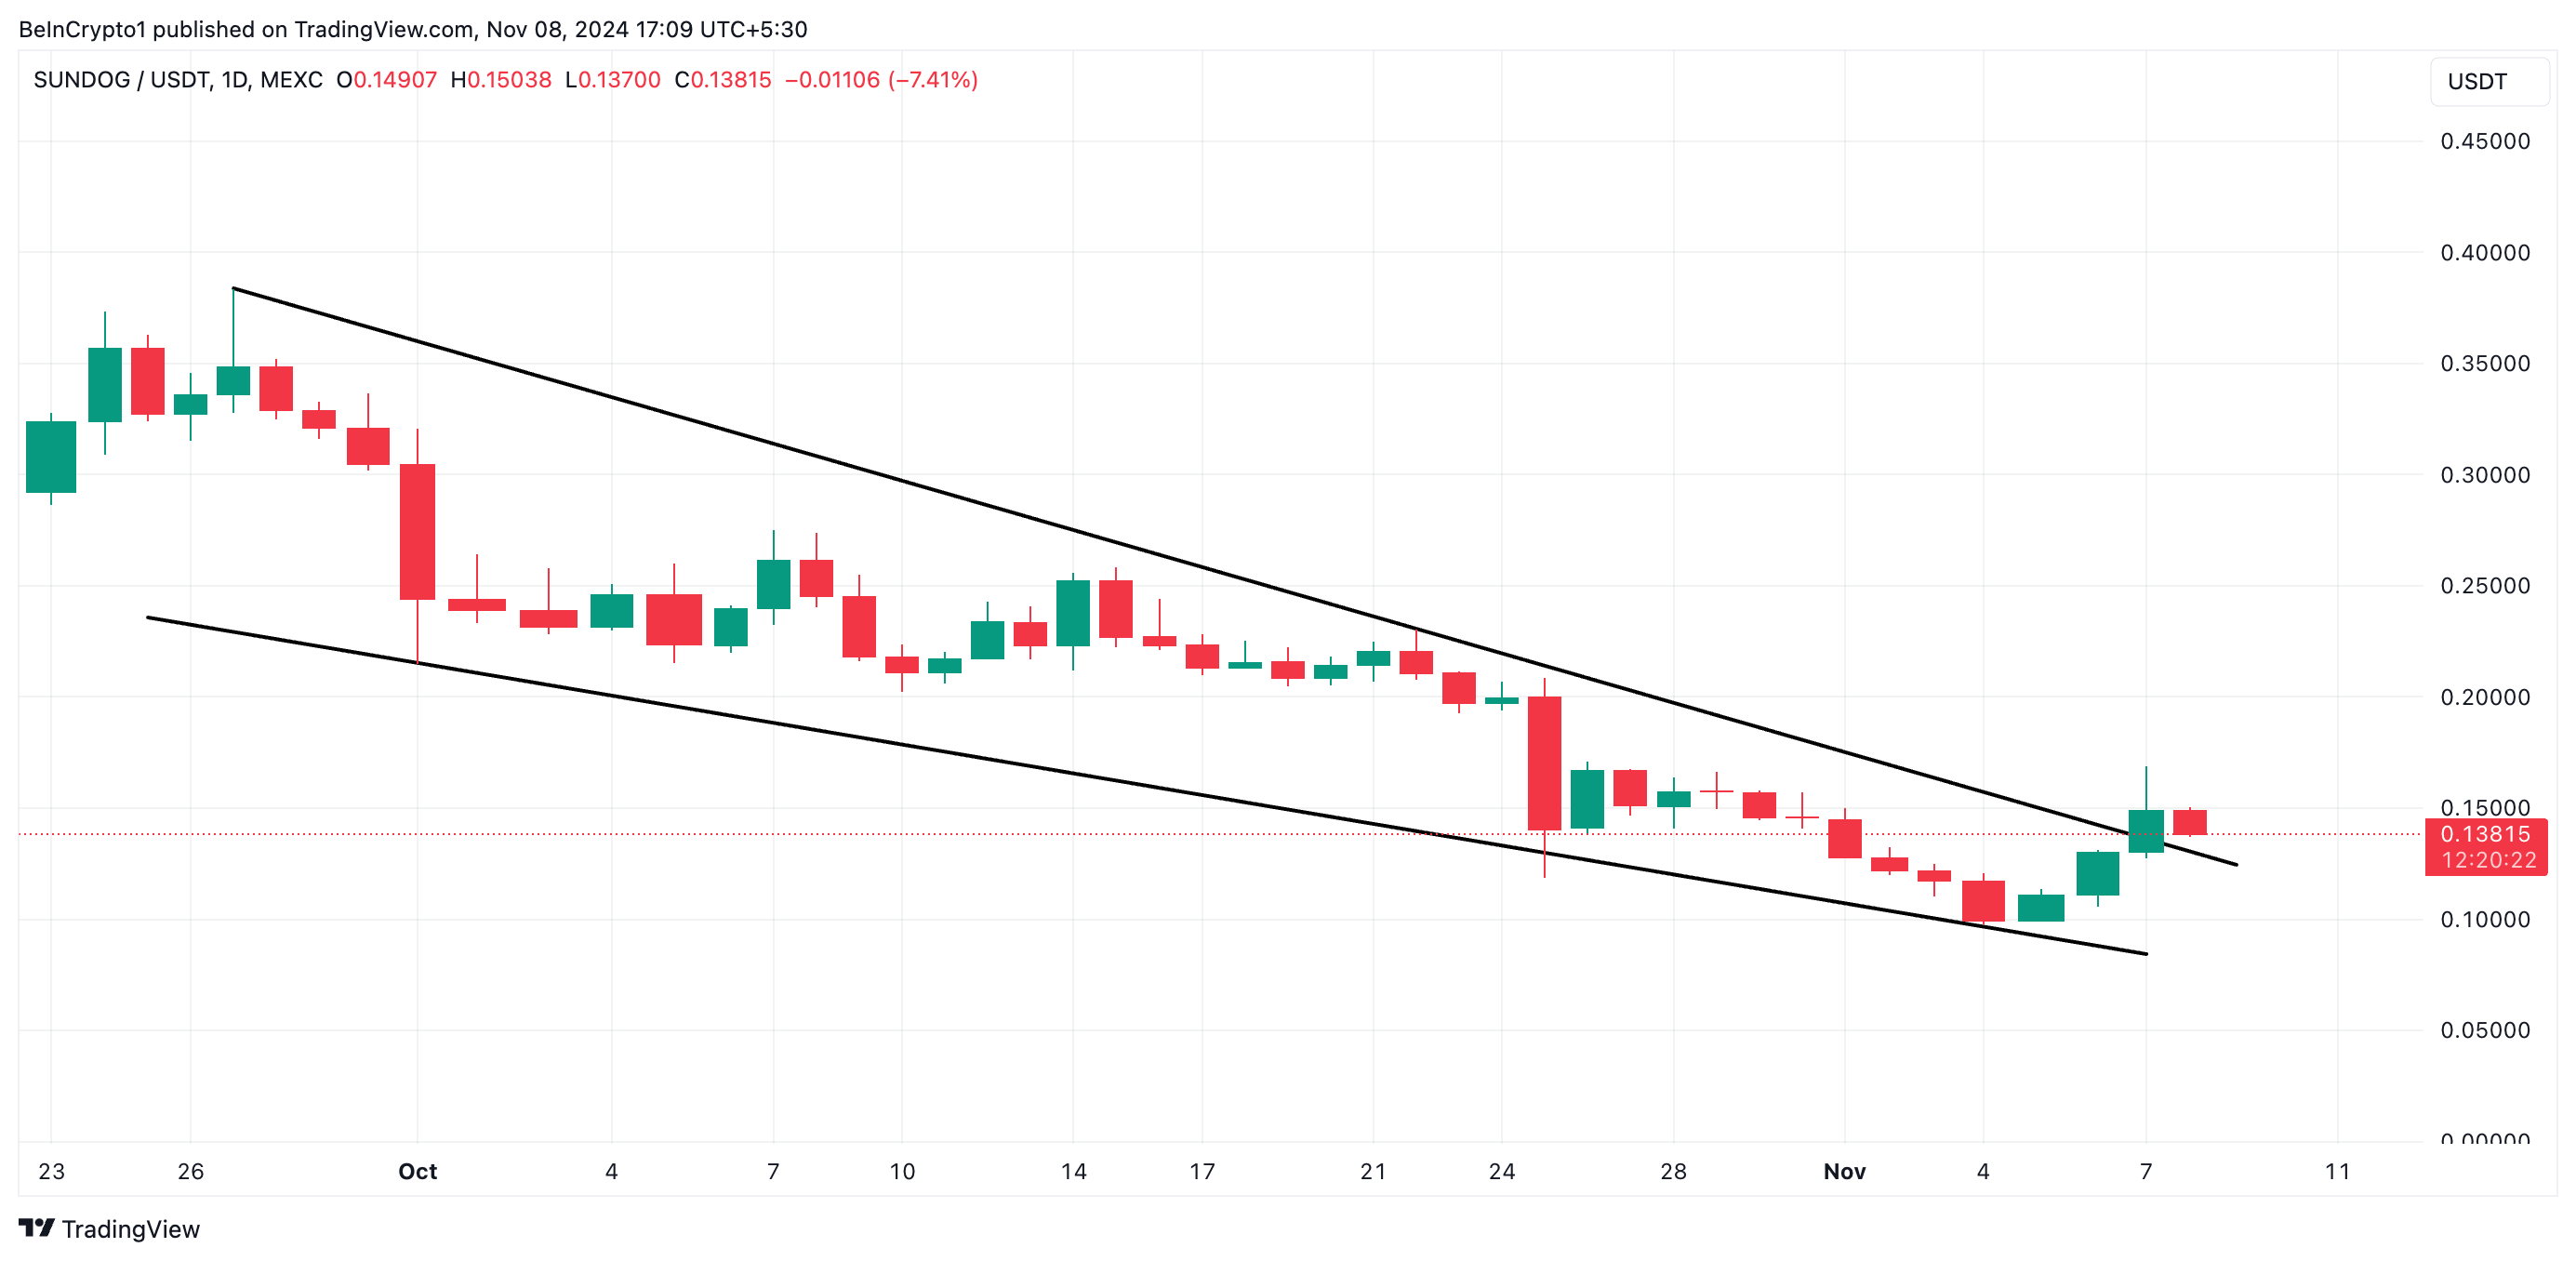
Tron-based meme coin Sundog (SUNDOG) has surged by 8% in the past 24 hours, breaking above a falling wedge pattern it had traded within since September.
However, BeInCrypto’s analysis of the meme coin’s technical setup indicates that the recent rally could be a false breakout. This assessment dives into the reasons behind it and outlines key signals for SUNDOG holders to watch closely.
SUNDOG’s Surge May Cause a Bull Trap
An assessment of the SUNDOG/USD one-day chart has revealed that the meme coin broke above the upper line of its falling wedge during Thursday’s intraday trading session. This pattern is formed when an asset’s price moves between two descending trend lines, with the upper line acting as resistance and the lower line as support.
A breakout above the wedge’s upper trendline is a bullish move. It suggests buyers are gaining strength over sellers and hints at a sustained price increase. However, a closer look at some of SUNDOG’s momentum indicators suggests that this rally may be a false breakout, potentially setting up a bull trap.
A bull trap occurs when an asset’s price briefly breaks above a key resistance level which would usually signify a positive shift in trend. However, instead of continuing the uptrend, the price falls again, ‘trapping” those who bought in on the bullish signal.

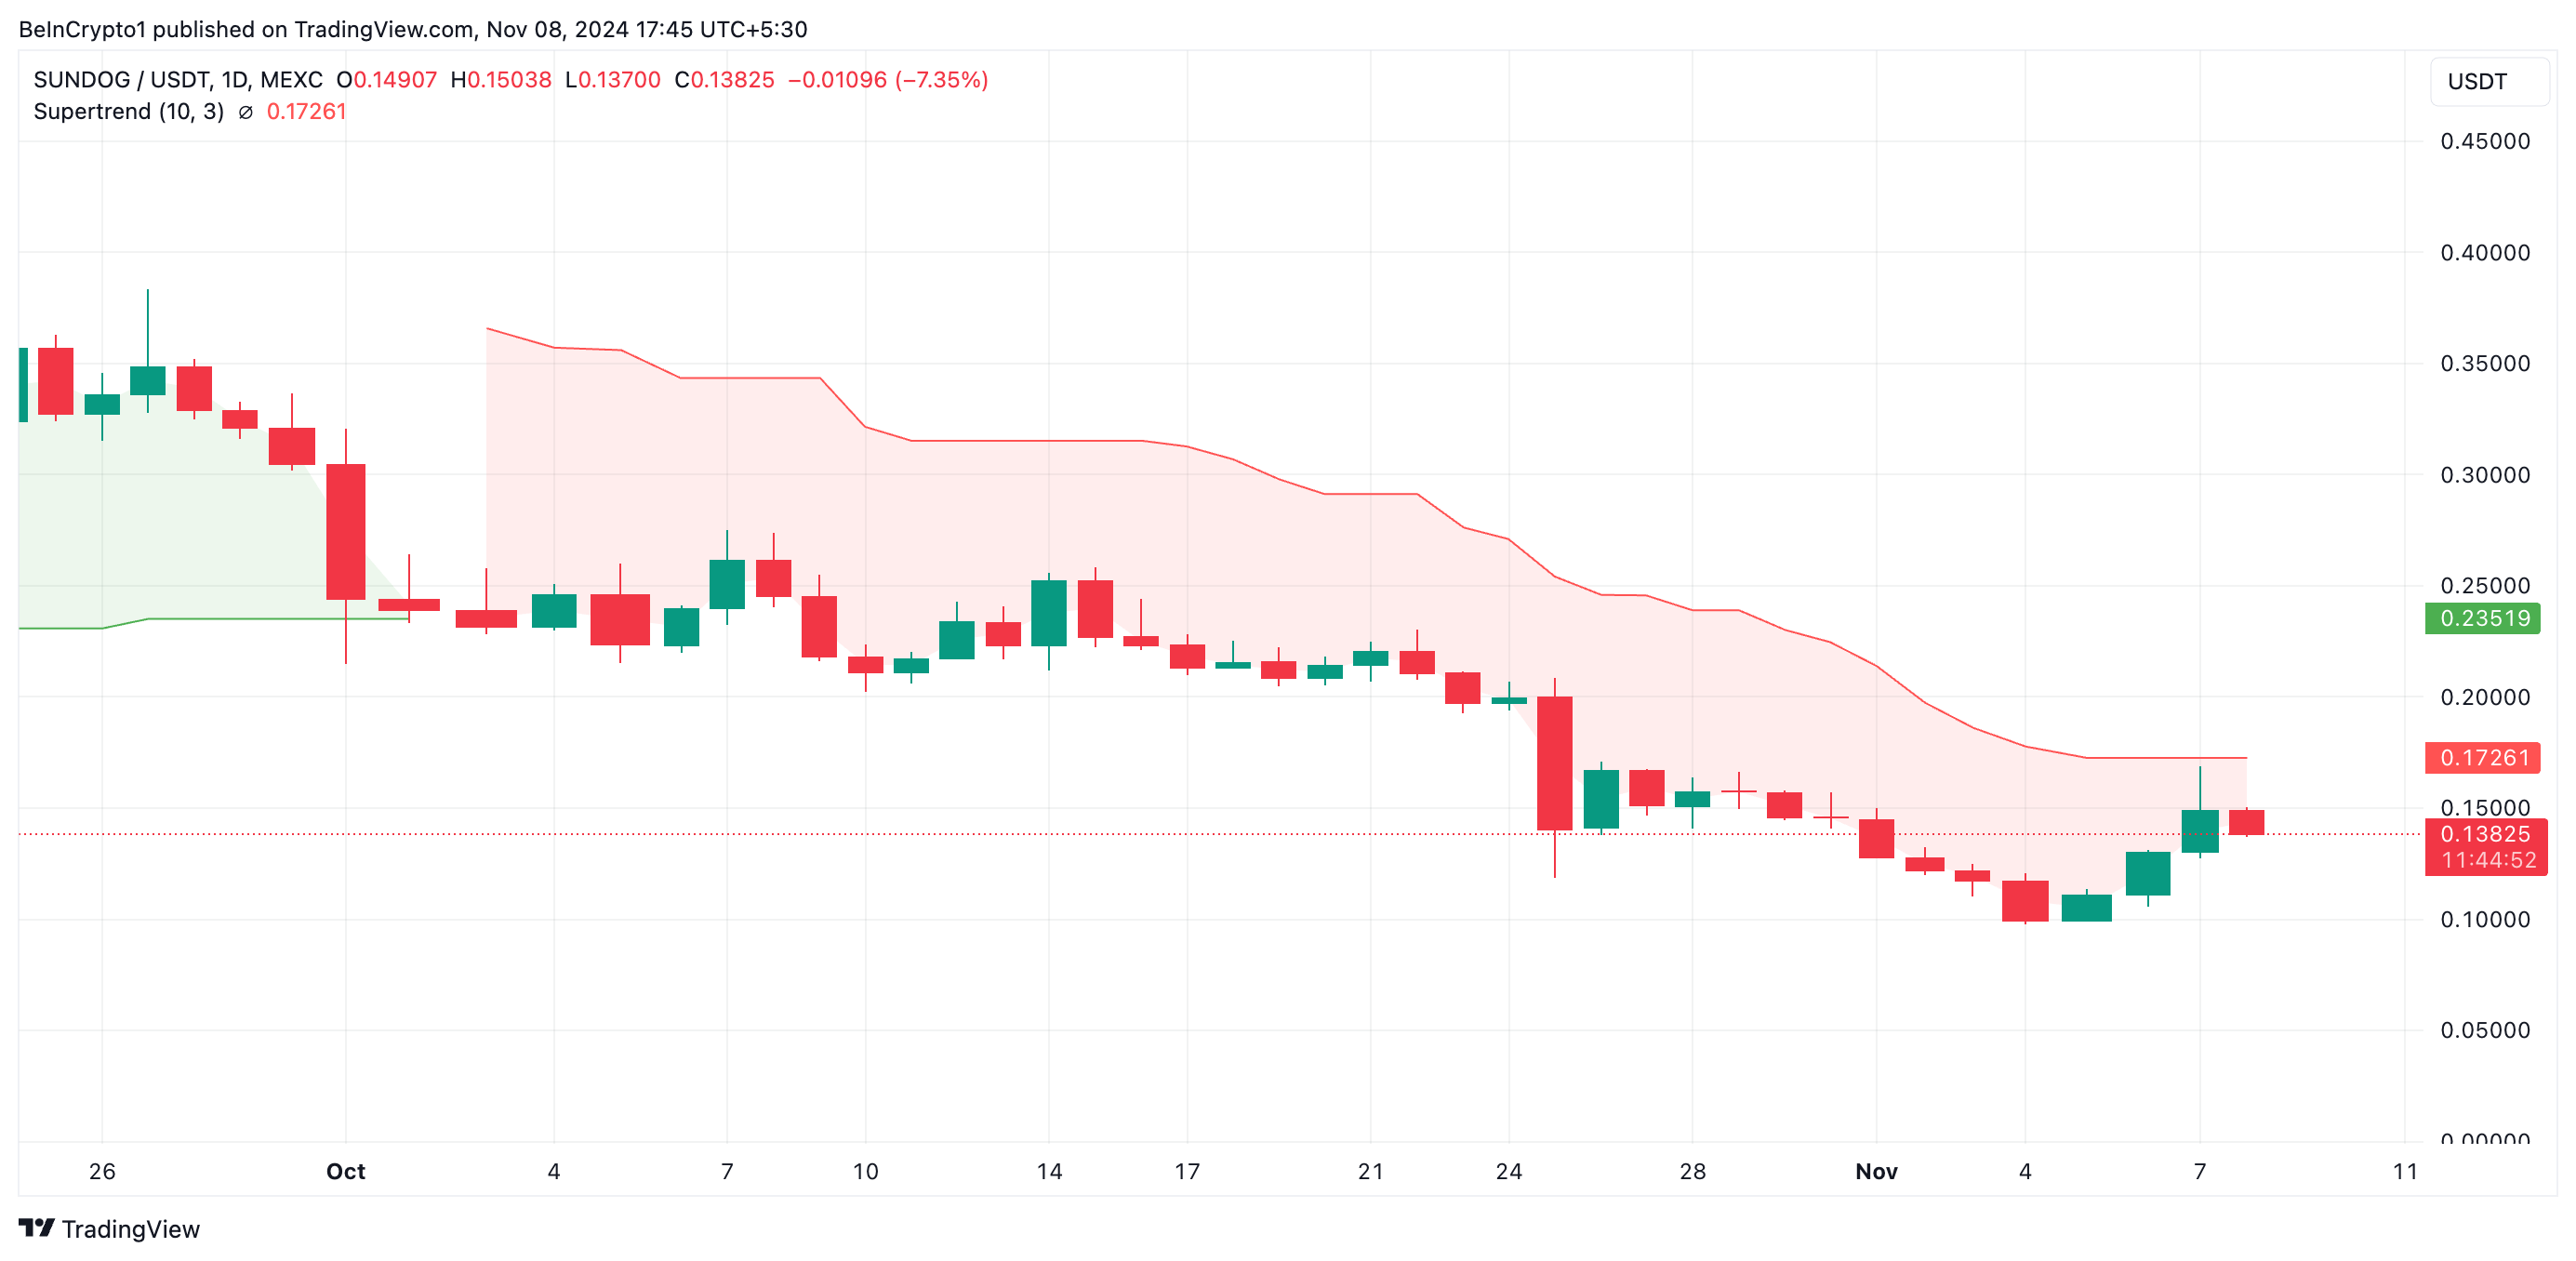
The setup of SUNDOG’s Super Trend Line is a notable indicator of this potential bull trap. At press time, the red line of the indicator rests above SUNDOG’s price.
The Super Trend indicator tracks the overall direction and strength of an asset’s price trend. It appears as a line on the price chart that changes color according to the trend’s direction: green for an uptrend and red for a downtrend.
When the Super Trend line appears below the asset’s price, it indicates an uptrend, suggesting bullish momentum may persist. On the other hand, when the Super Trend line turns red and appears above an asset’s price, bearish pressure is strong.

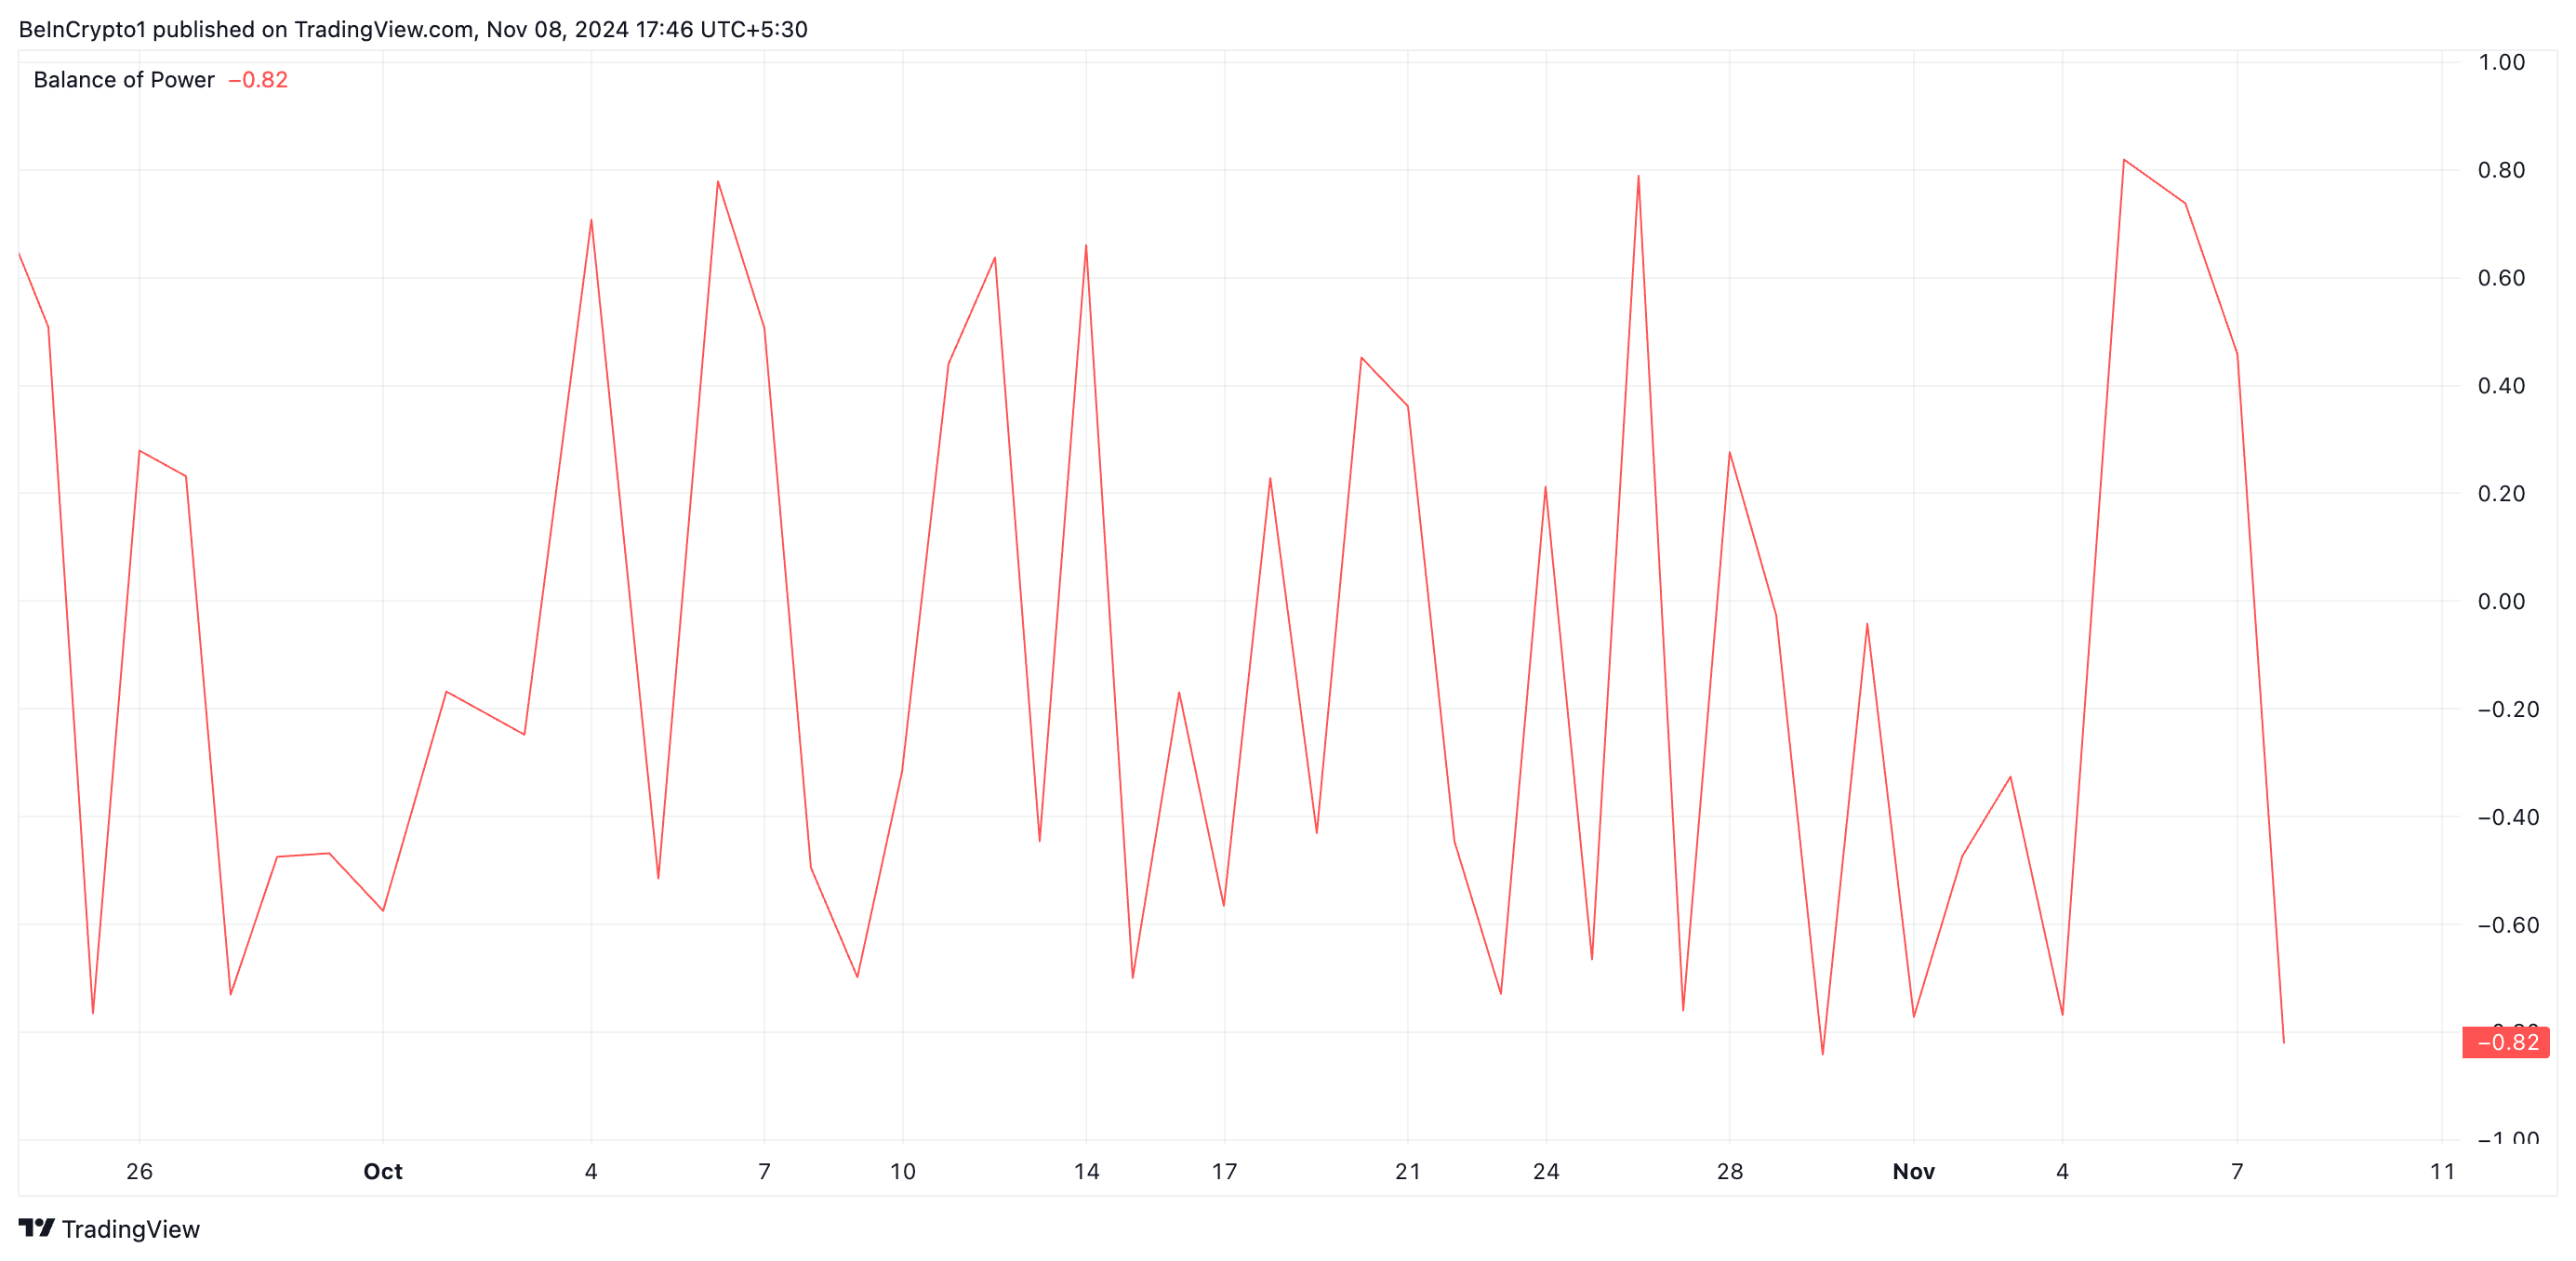
Additionally, the negative readings of SUNDOG’s Balance of Power (BoP) confirm the possibility of a price reversal in the near term. As of this writing, the meme coin’s BoP stands at -0.82 despite its price uptick.
This indicator measures the strength of buyers versus sellers in the market. A negative BoP suggests sellers are in control and attempting to push the asset’s price downward.

SUNDOG Price Prediction: If Retest Fails…
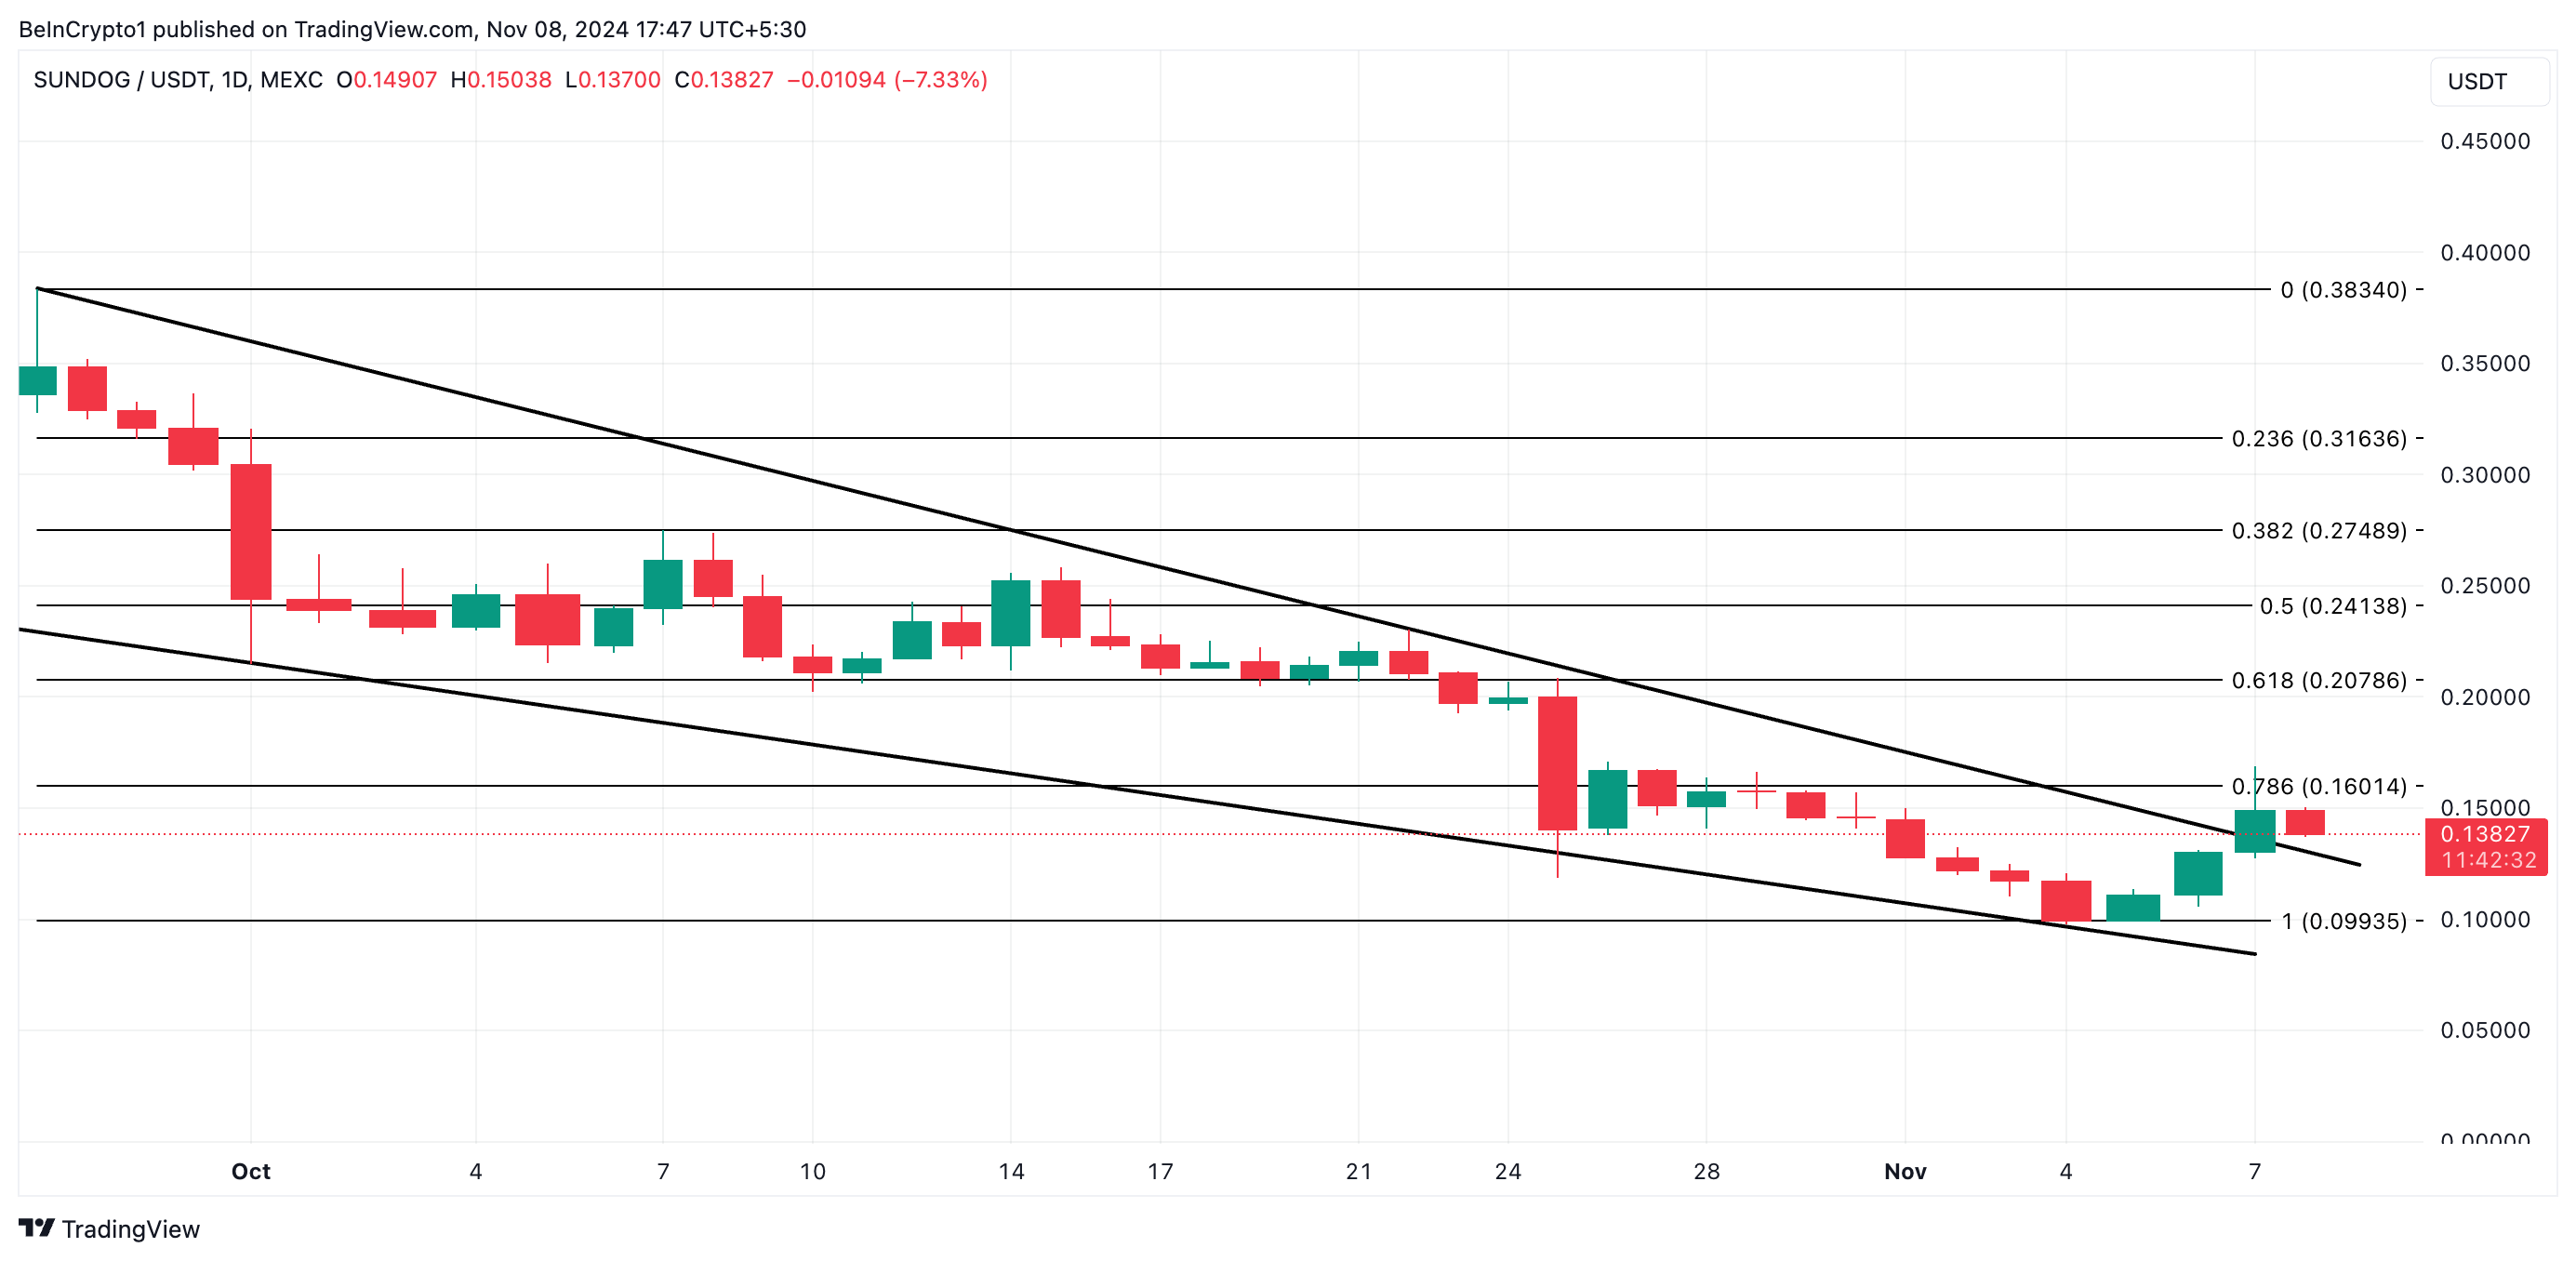
A combined reading of SUNDOG’s Super Trend and BoP indicators suggests that its breakout above the upper line of the falling wedge may occasion a bull trap when the retest attempt of the resistance line fails due to strong bearish sentiments in the market.

At press time, SUNDOG trades at $0.13. A reversal of its uptrend due to strengthening bearish pressure may see its price drop to $0.09, where support lies. However, if the uptrend persists, SUNDOG’s price may rally toward $0.20.
Disclaimer
In line with the Trust Project guidelines, this price analysis article is for informational purposes only and should not be considered financial or investment advice. BeInCrypto is committed to accurate, unbiased reporting, but market conditions are subject to change without notice. Always conduct your own research and consult with a professional before making any financial decisions. Please note that our Terms and Conditions, Privacy Policy, and Disclaimers have been updated.


