Goatseus Maximus (GOAT) has emerged as the top-performing cryptocurrency over the past 24 hours, skyrocketing by 40%. This price surge follows a recent downturn in GOAT’s value and aligns with an overall uptick in the cryptocurrency market.
While GOAT’s rally has excited investors, analysts warn the momentum may be short-lived as the market shows signs of overheating. Once momentum cools, GOAT could face downward pressure. In this analysis, we explore possible price targets for GOAT as it approaches a potential correction phase.
GOAT Surges, But There Is a Catch
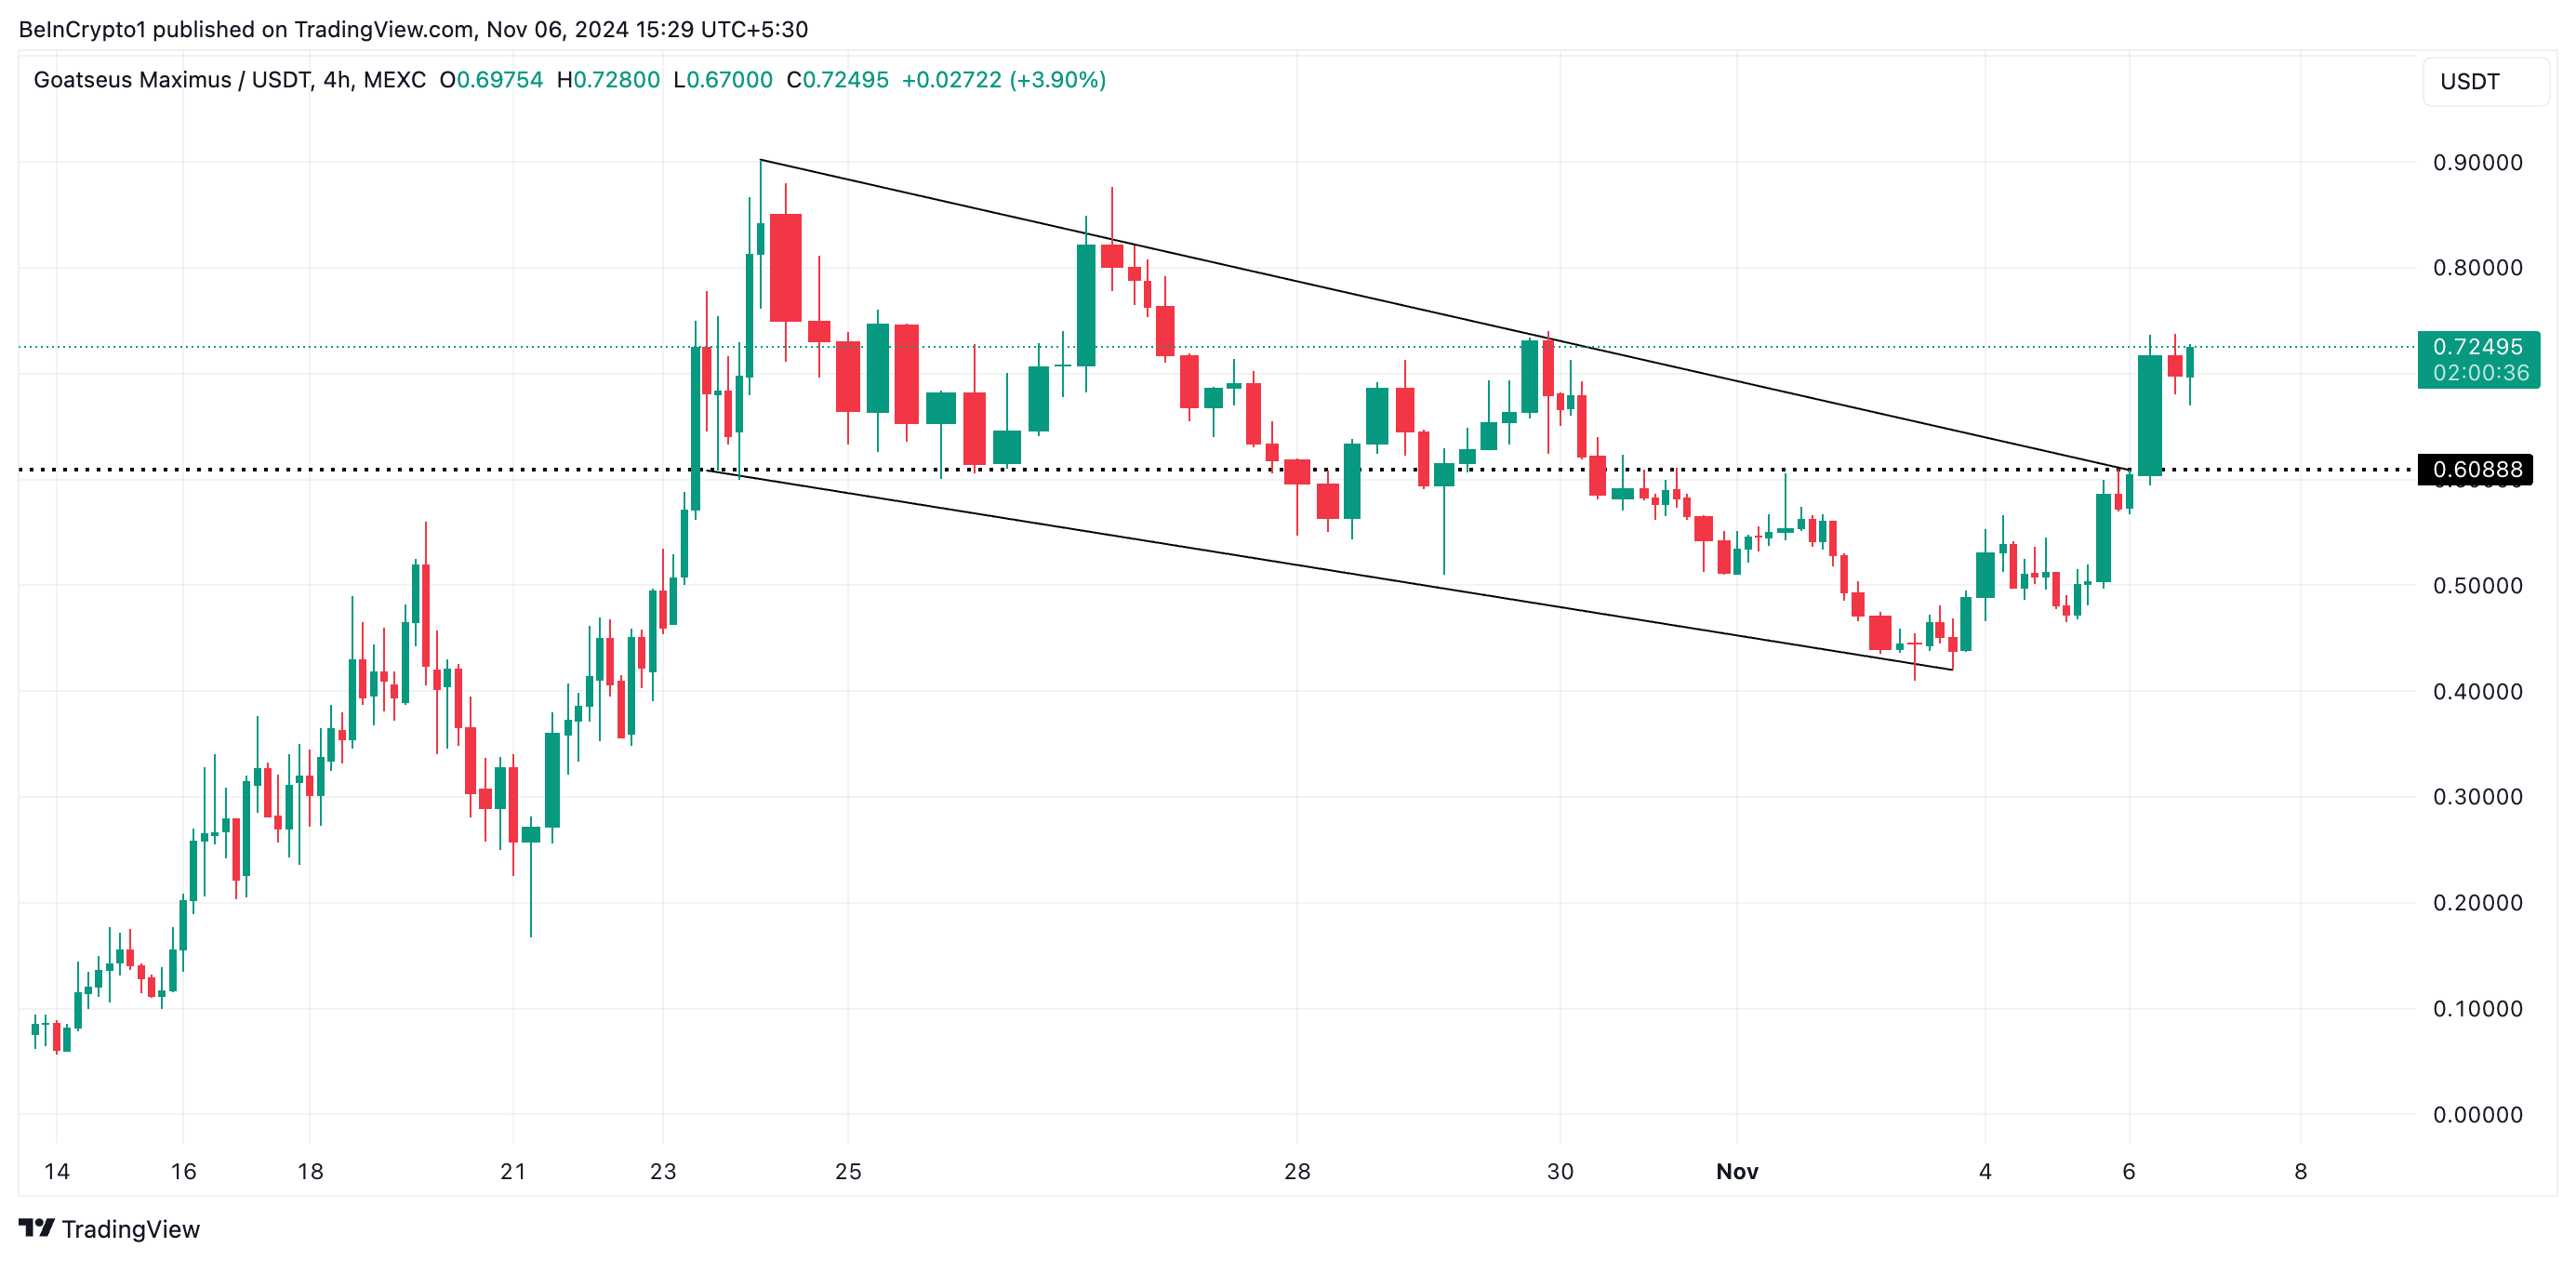
BeInCrypto’s assessment of the GOAT/USD four-hour chart reveals that the meme coin has broken above a descending channel.
The descending channel is formed during a downtrend, when an asset’s price oscillates between the two trendlines, creating a series of lower highs and lower lows. When the price breaks above the upper trendline of this channel, it signals a shift in market sentiment. Such a breakout suggests that the previous bearish momentum has weakened, and buyers are gaining control.
However, GOAT’s breakout may be a bull trap as its market begins to overheat. This is a situation where an asset’s price appears to be breaking out to the upside, encouraging traders to buy, only for the price to reverse and fall quickly.
Read more: 7 Hot Meme Coins and Altcoins that are Trending in 2024
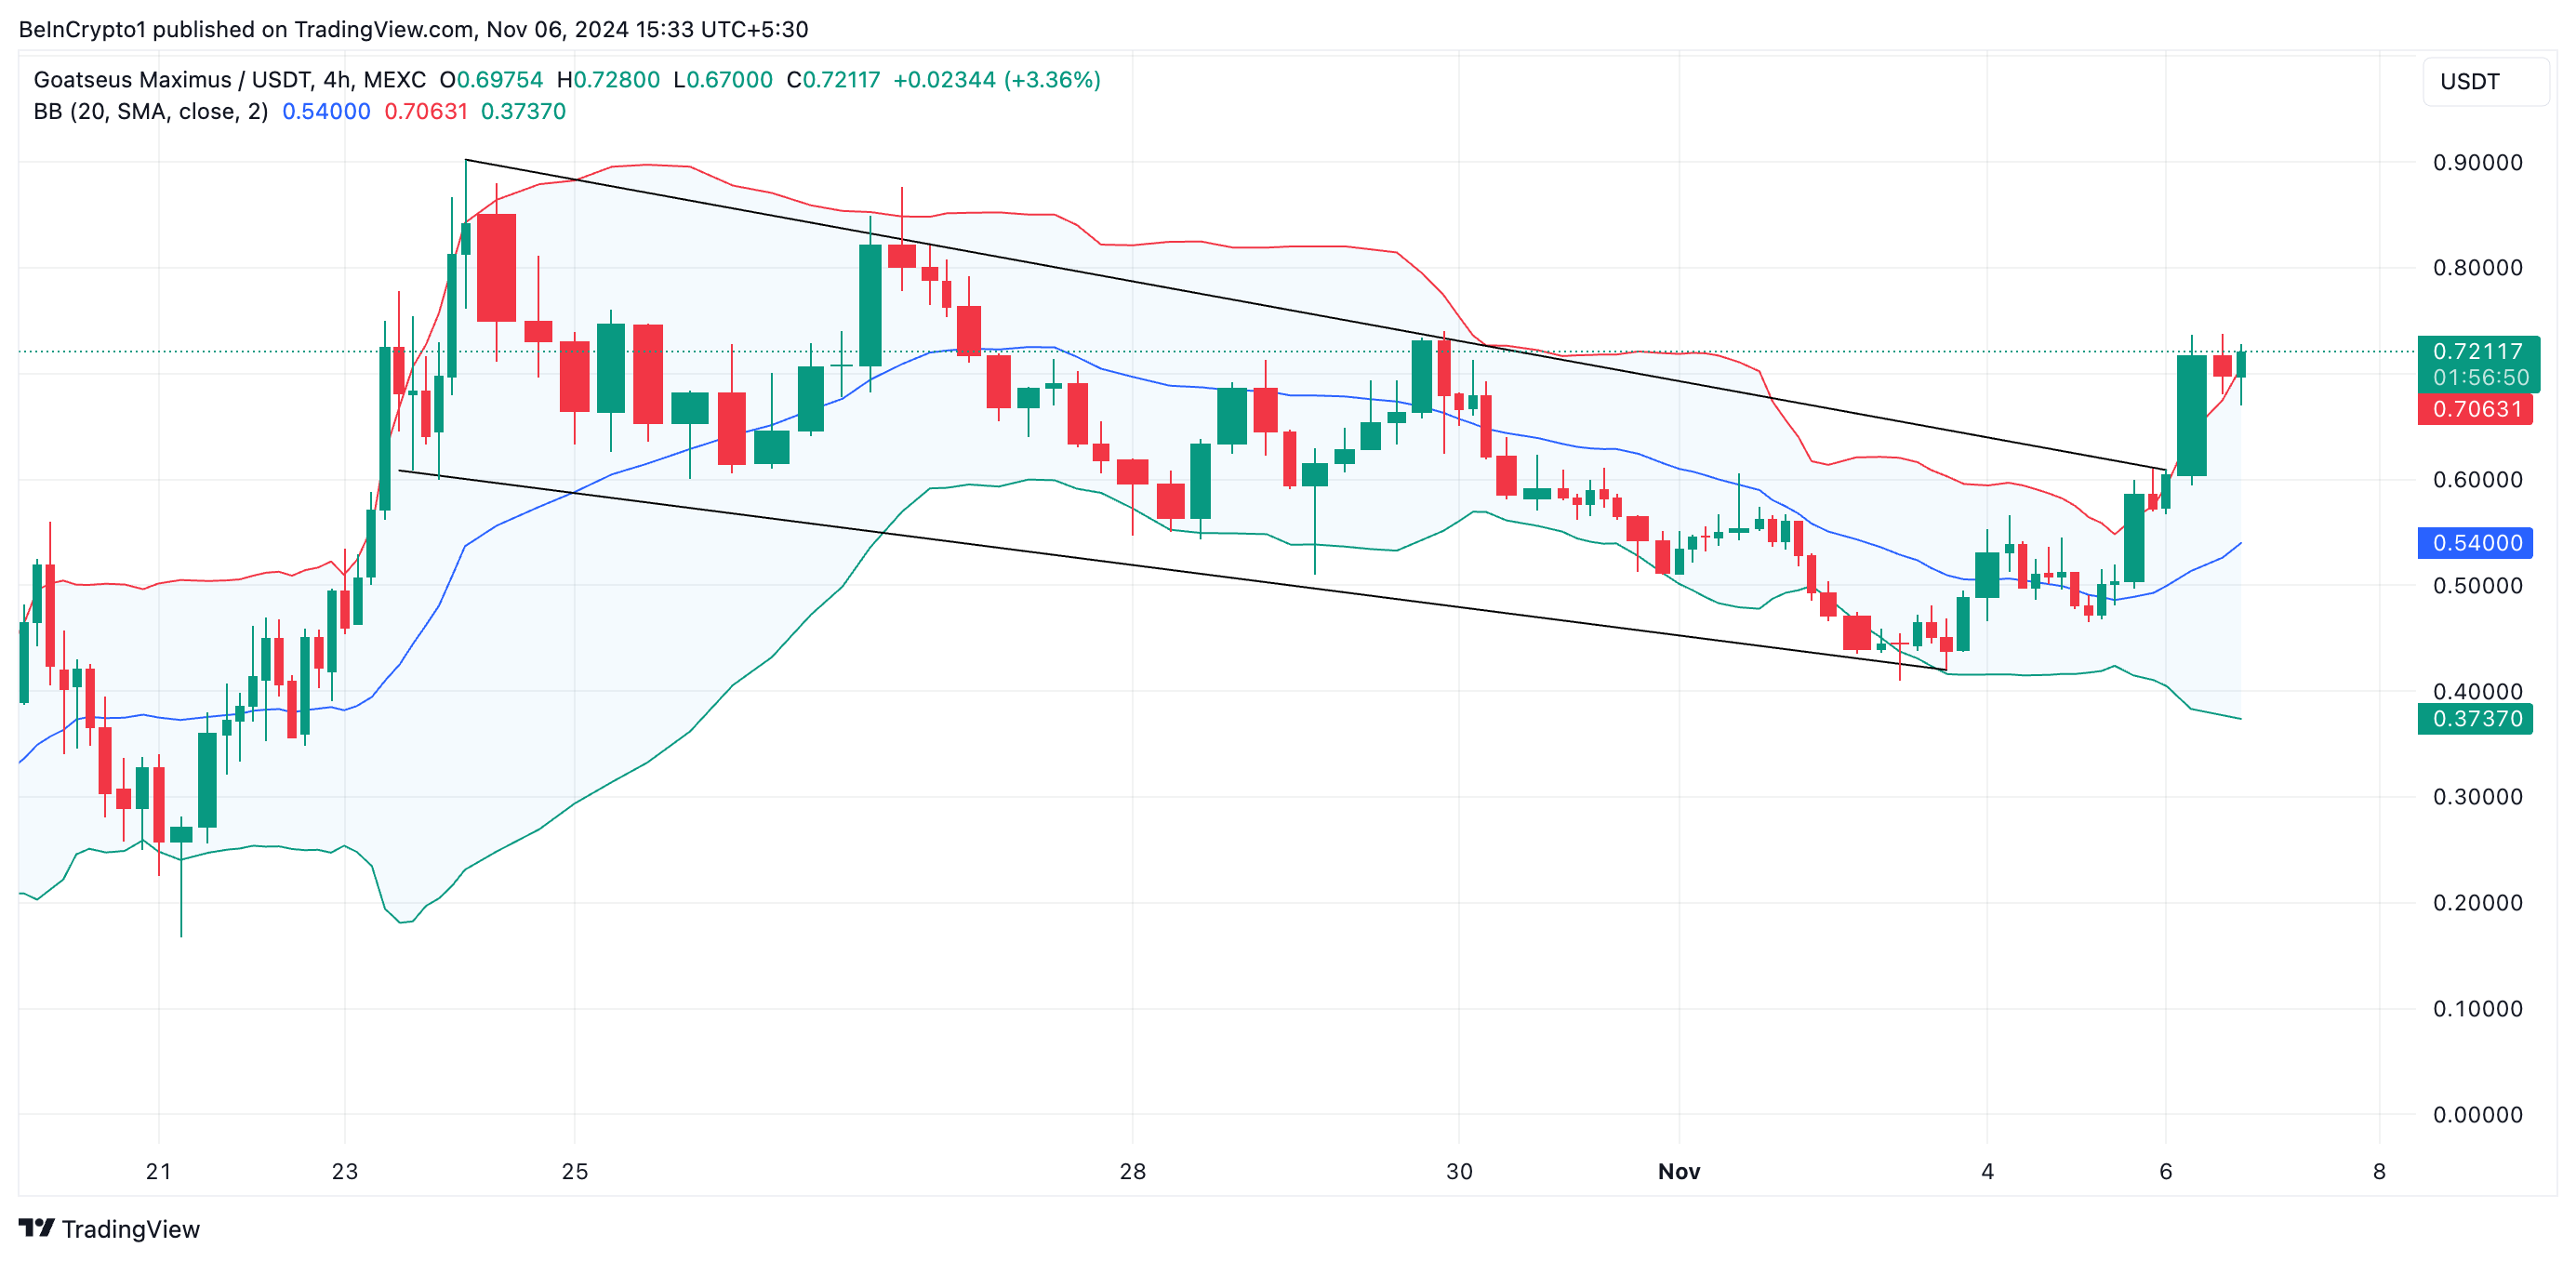
Readings from GOAT’s Bollinger Bands indicator, which measures market volatility and identifies potential buy and sell signals, hint at the likelihood of this happening. At press time, the meme coin’s price trades above the upper band of this indicator.
When an asset trades above this line, it is overbought. This is because its price has moved significantly higher than the typical range based on its historical volatility. This indicates that the uptrend may be unsustainable and that a price correction or reversal could be imminent.
GOAT Price Prediction: Buyer Fatigue Is Imminent
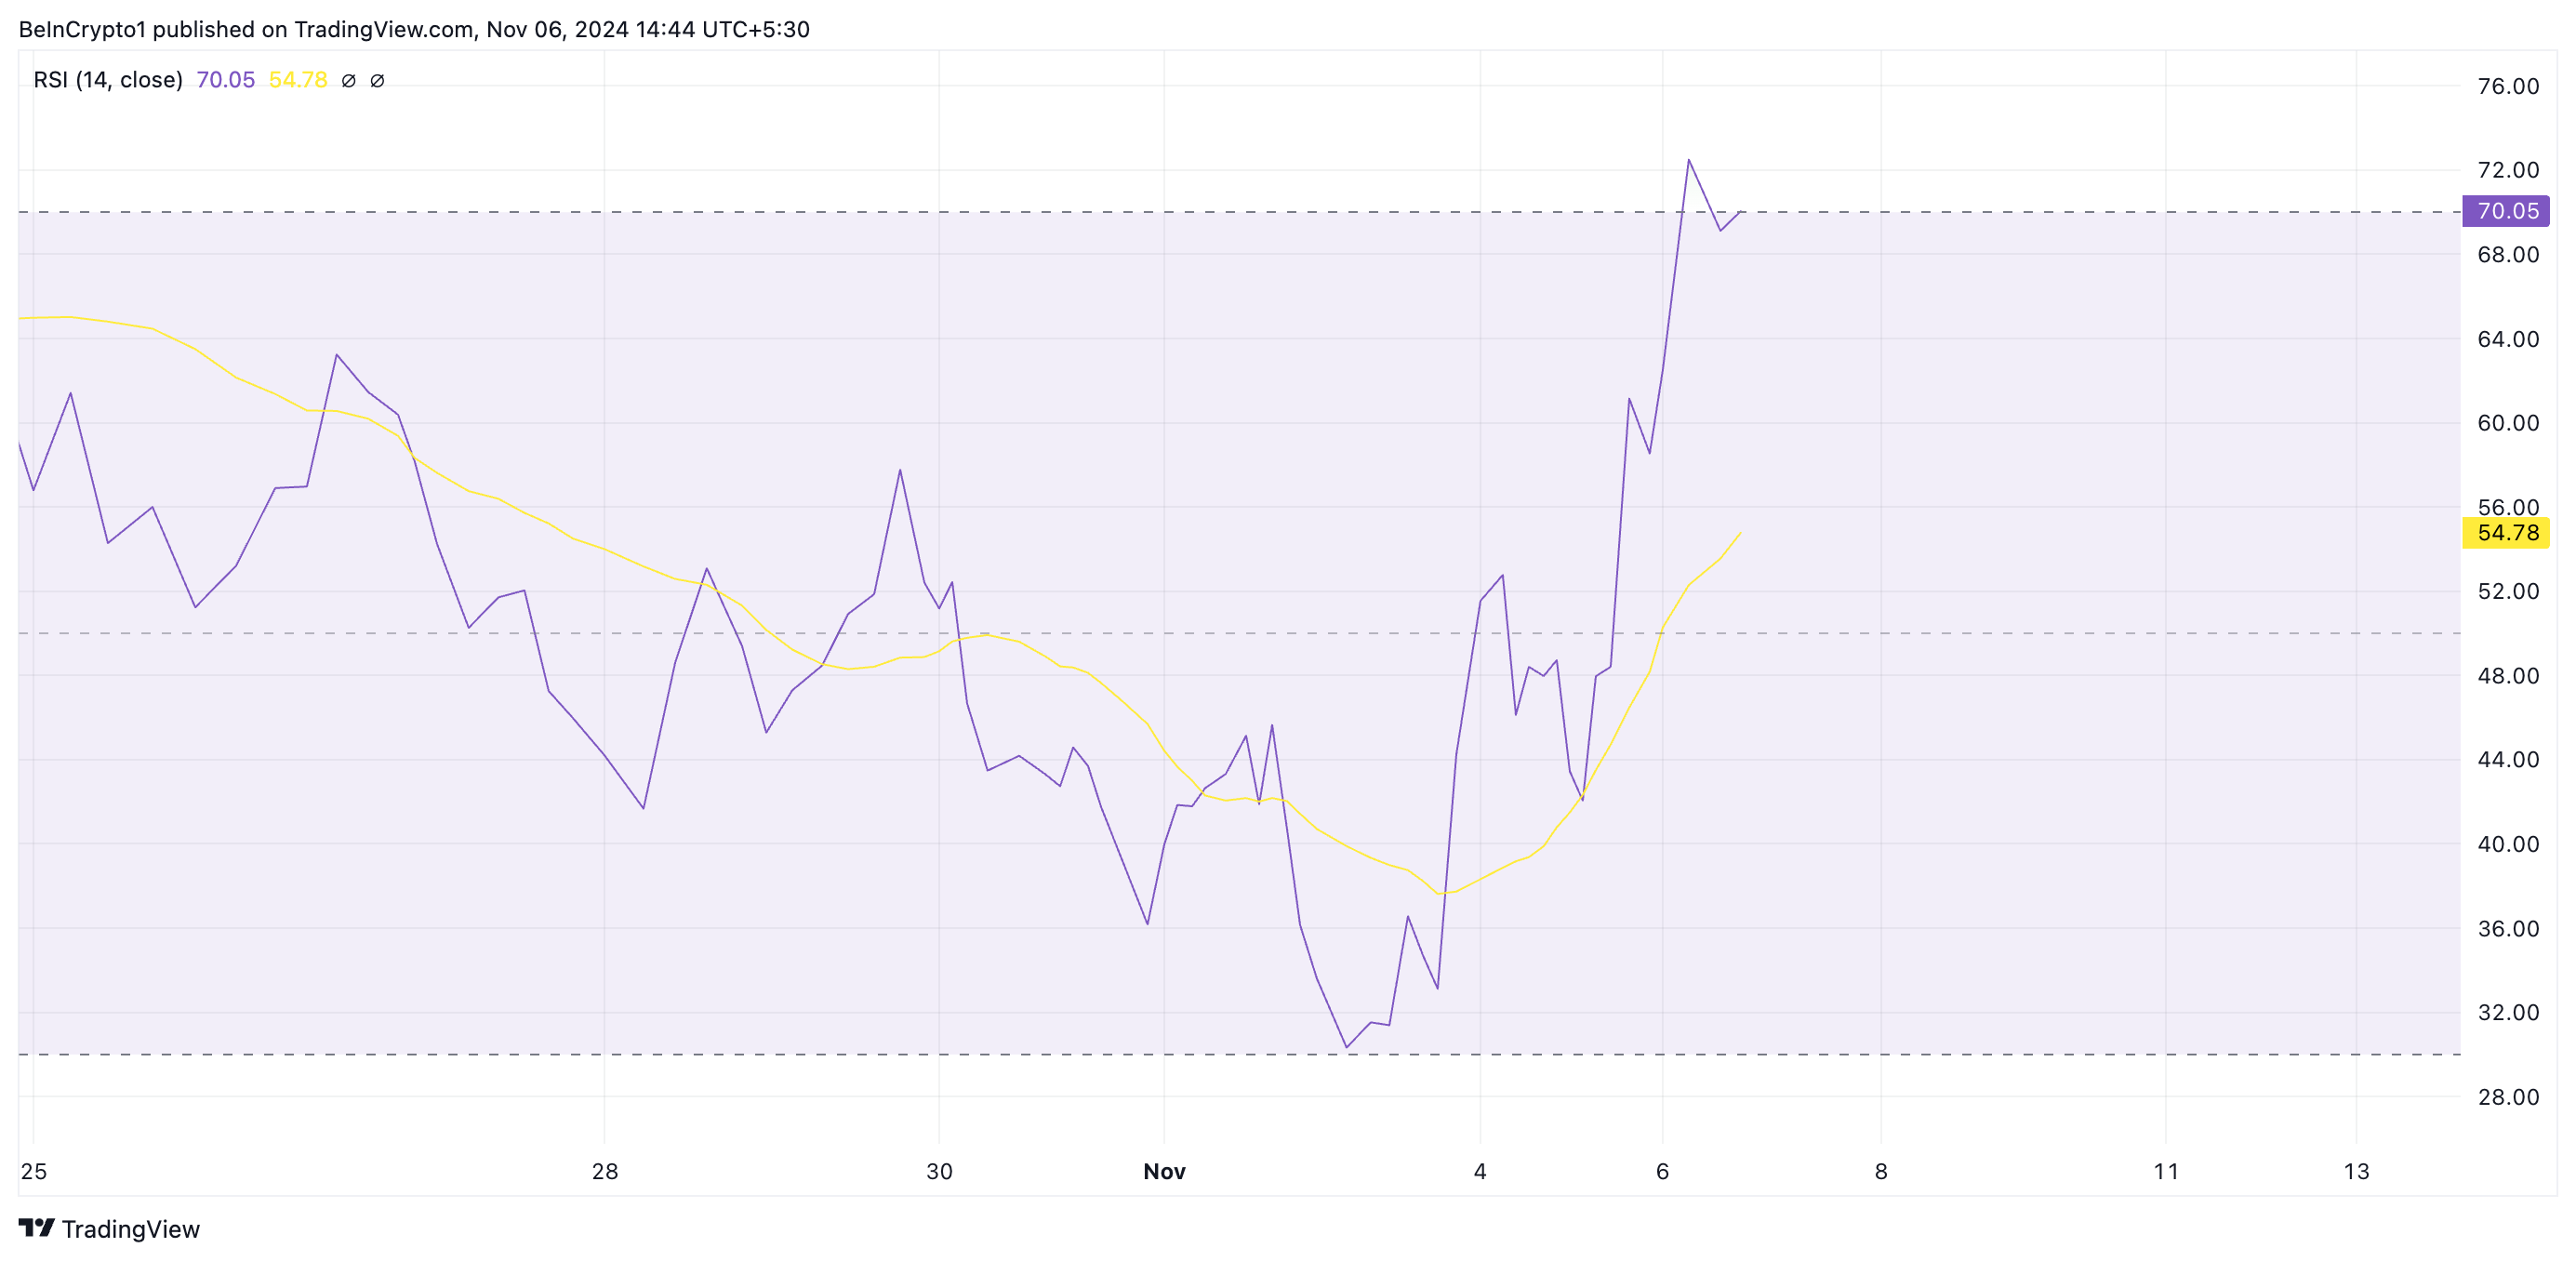
GOAT’s Relative Strength Index (RSI) confirms the token’s oversold nature. Its value currently stands at 70.05. The RSI measures an asset’s overbought and oversold market conditions. It ranges between 0 and 100, with values above 70 suggesting that the asset is overbought and due for a correction.
In contrast, values below 30 indicate that the asset is oversold and may witness a rebound. GOAT’s RSI reading of 70.05 signals that it has become overbought and may soon experience a correction.
As of this writing, GOAT trades at $0.72. Once buyer exhaustion sets in, its price will likely retest the upper line of the descending channel and attempt to establish support at $0.60. If this fails, the downtrend will be confirmed, and the meme coin’s price could plummet toward $0.41.
Read more: 11 Top Solana Meme Coins to Watch in October 2024
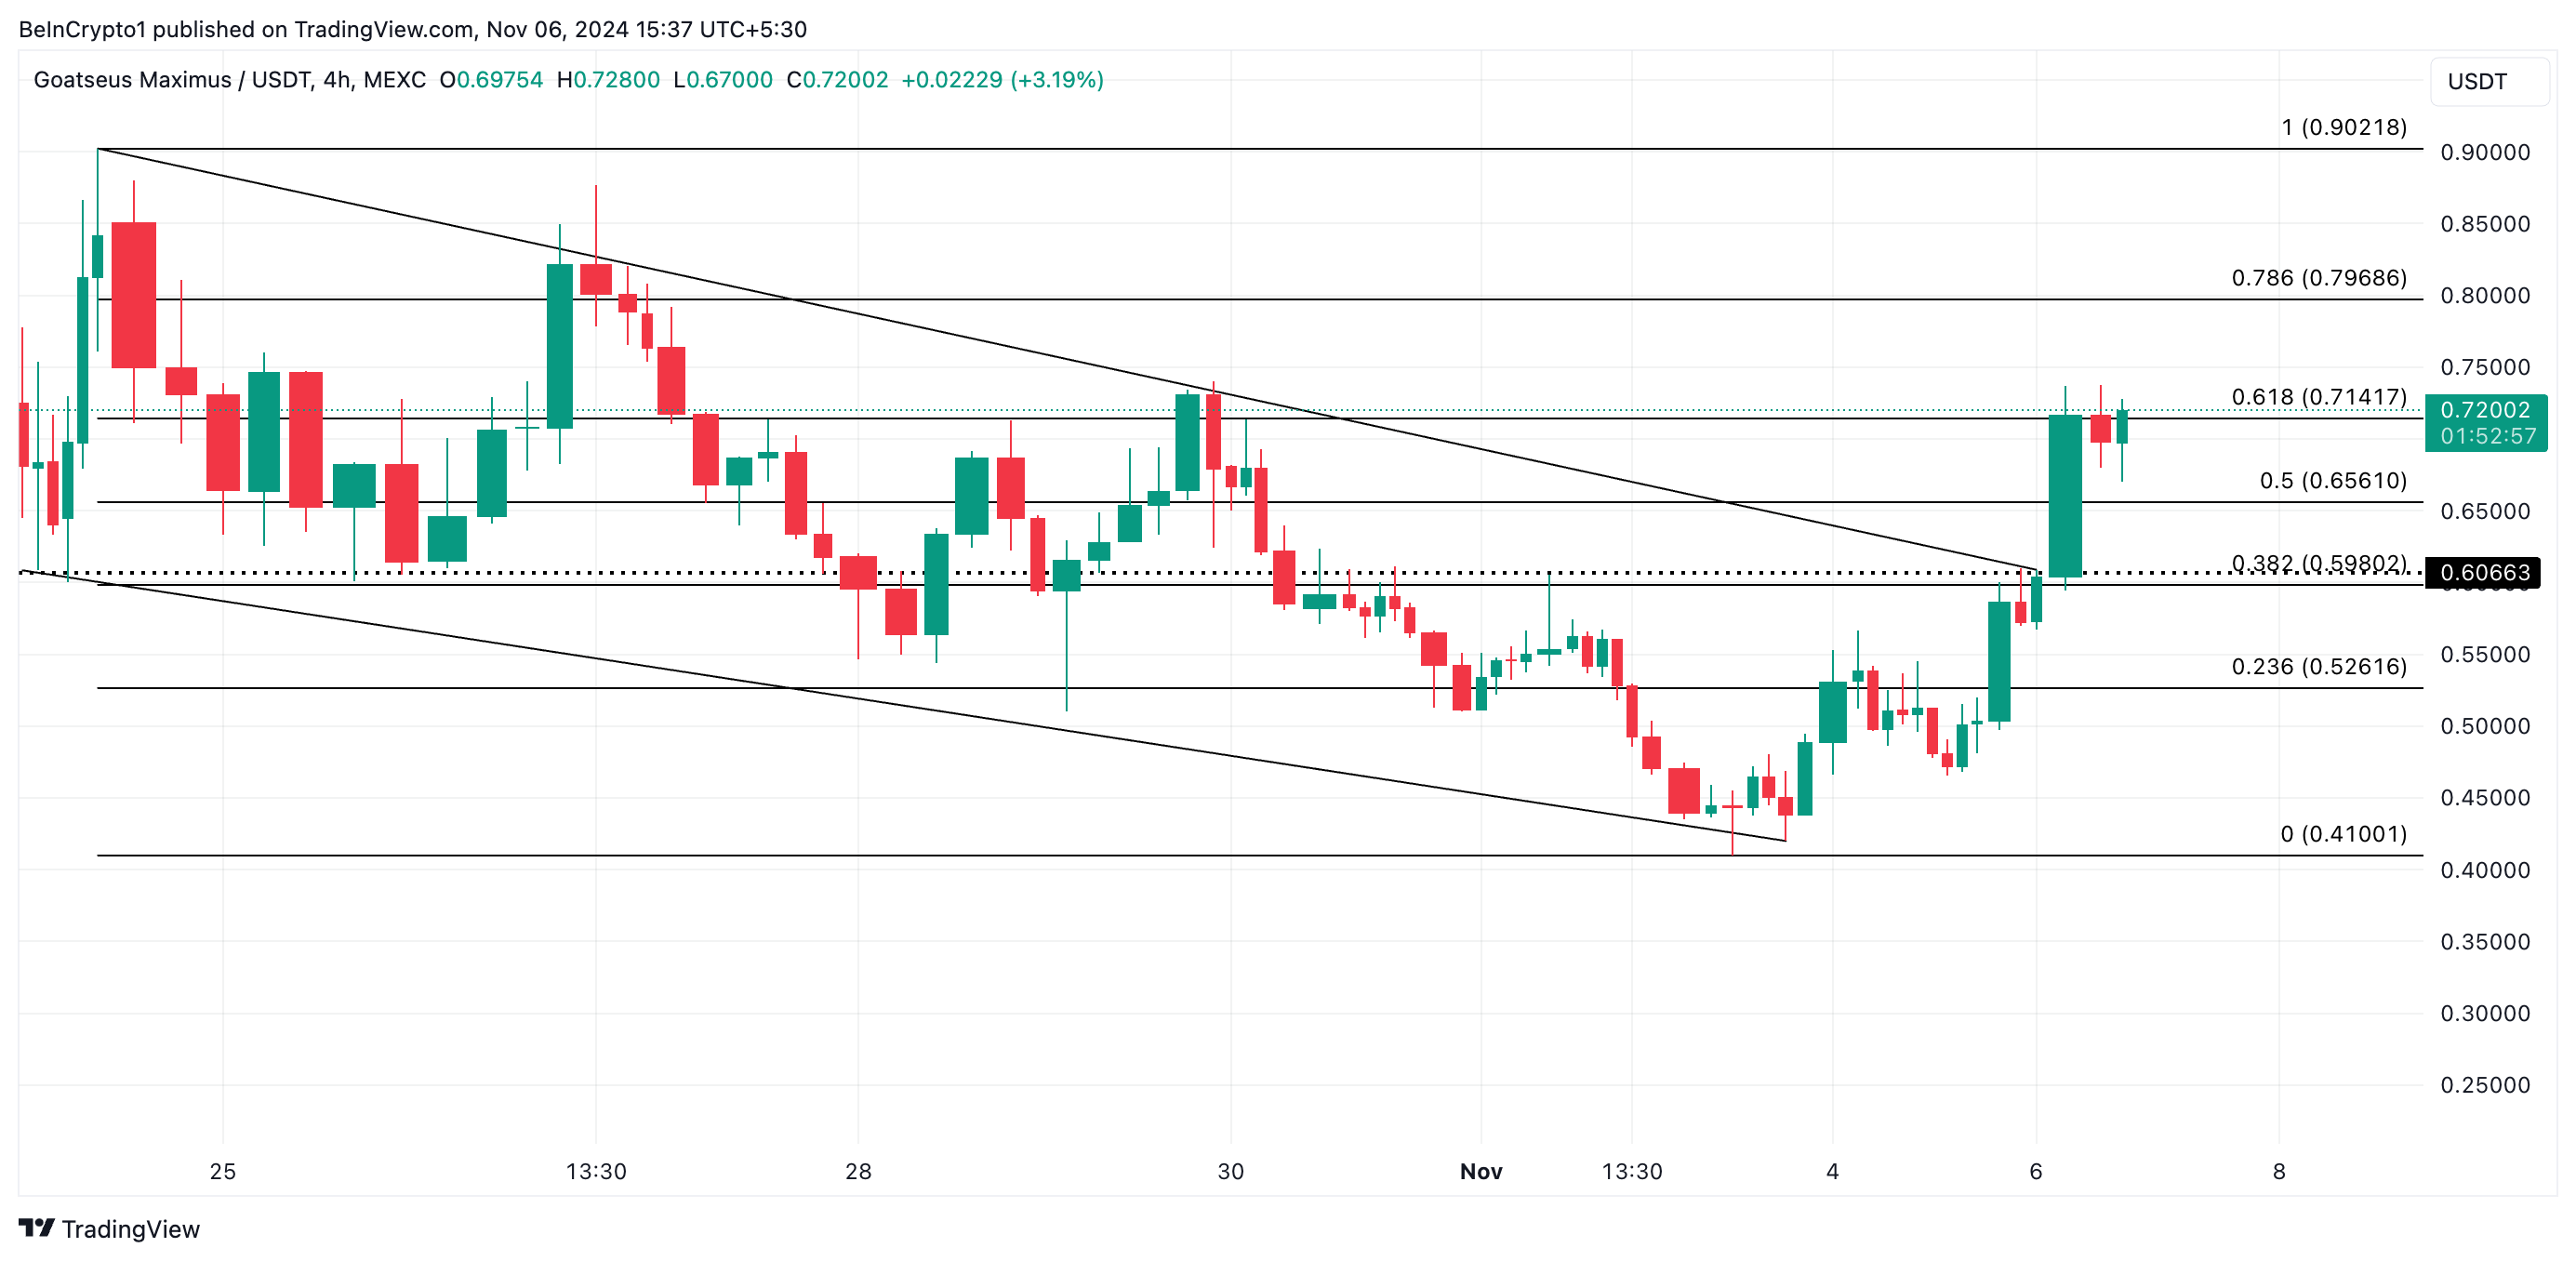
However, if the uptrend is maintained, the GOAT price rally will continue, and the meme coin may reclaim its all-time high of $0.90.
Disclaimer
In line with the Trust Project guidelines, this price analysis article is for informational purposes only and should not be considered financial or investment advice. BeInCrypto is committed to accurate, unbiased reporting, but market conditions are subject to change without notice. Always conduct your own research and consult with a professional before making any financial decisions. Please note that our Terms and Conditions, Privacy Policy, and Disclaimers have been updated.


