

Solana’s (SOL) 50-day Simple Moving Average (SMA) has started trending upward, poised to cross above the 200-day SMA in the coming days. This potential crossover is a bullish signal known as a “golden crossover,” and it often hints at significant upward price momentum.
If the golden cross forms as anticipated, it could potentially drive Solana’s price above the $200 mark—a level it has not reached in a few months. This analysis delves into the factors that may make that happen in the near term.
Solana is Ready For an Upswing
BeInCrypto’s assessment of the SOL/USD one-day chart shows its 50-day SMA (blue line) on the verge of crossing above its 200-day SMA (yellow line).
Read more: Solana vs. Ethereum: An Ultimate Comparison
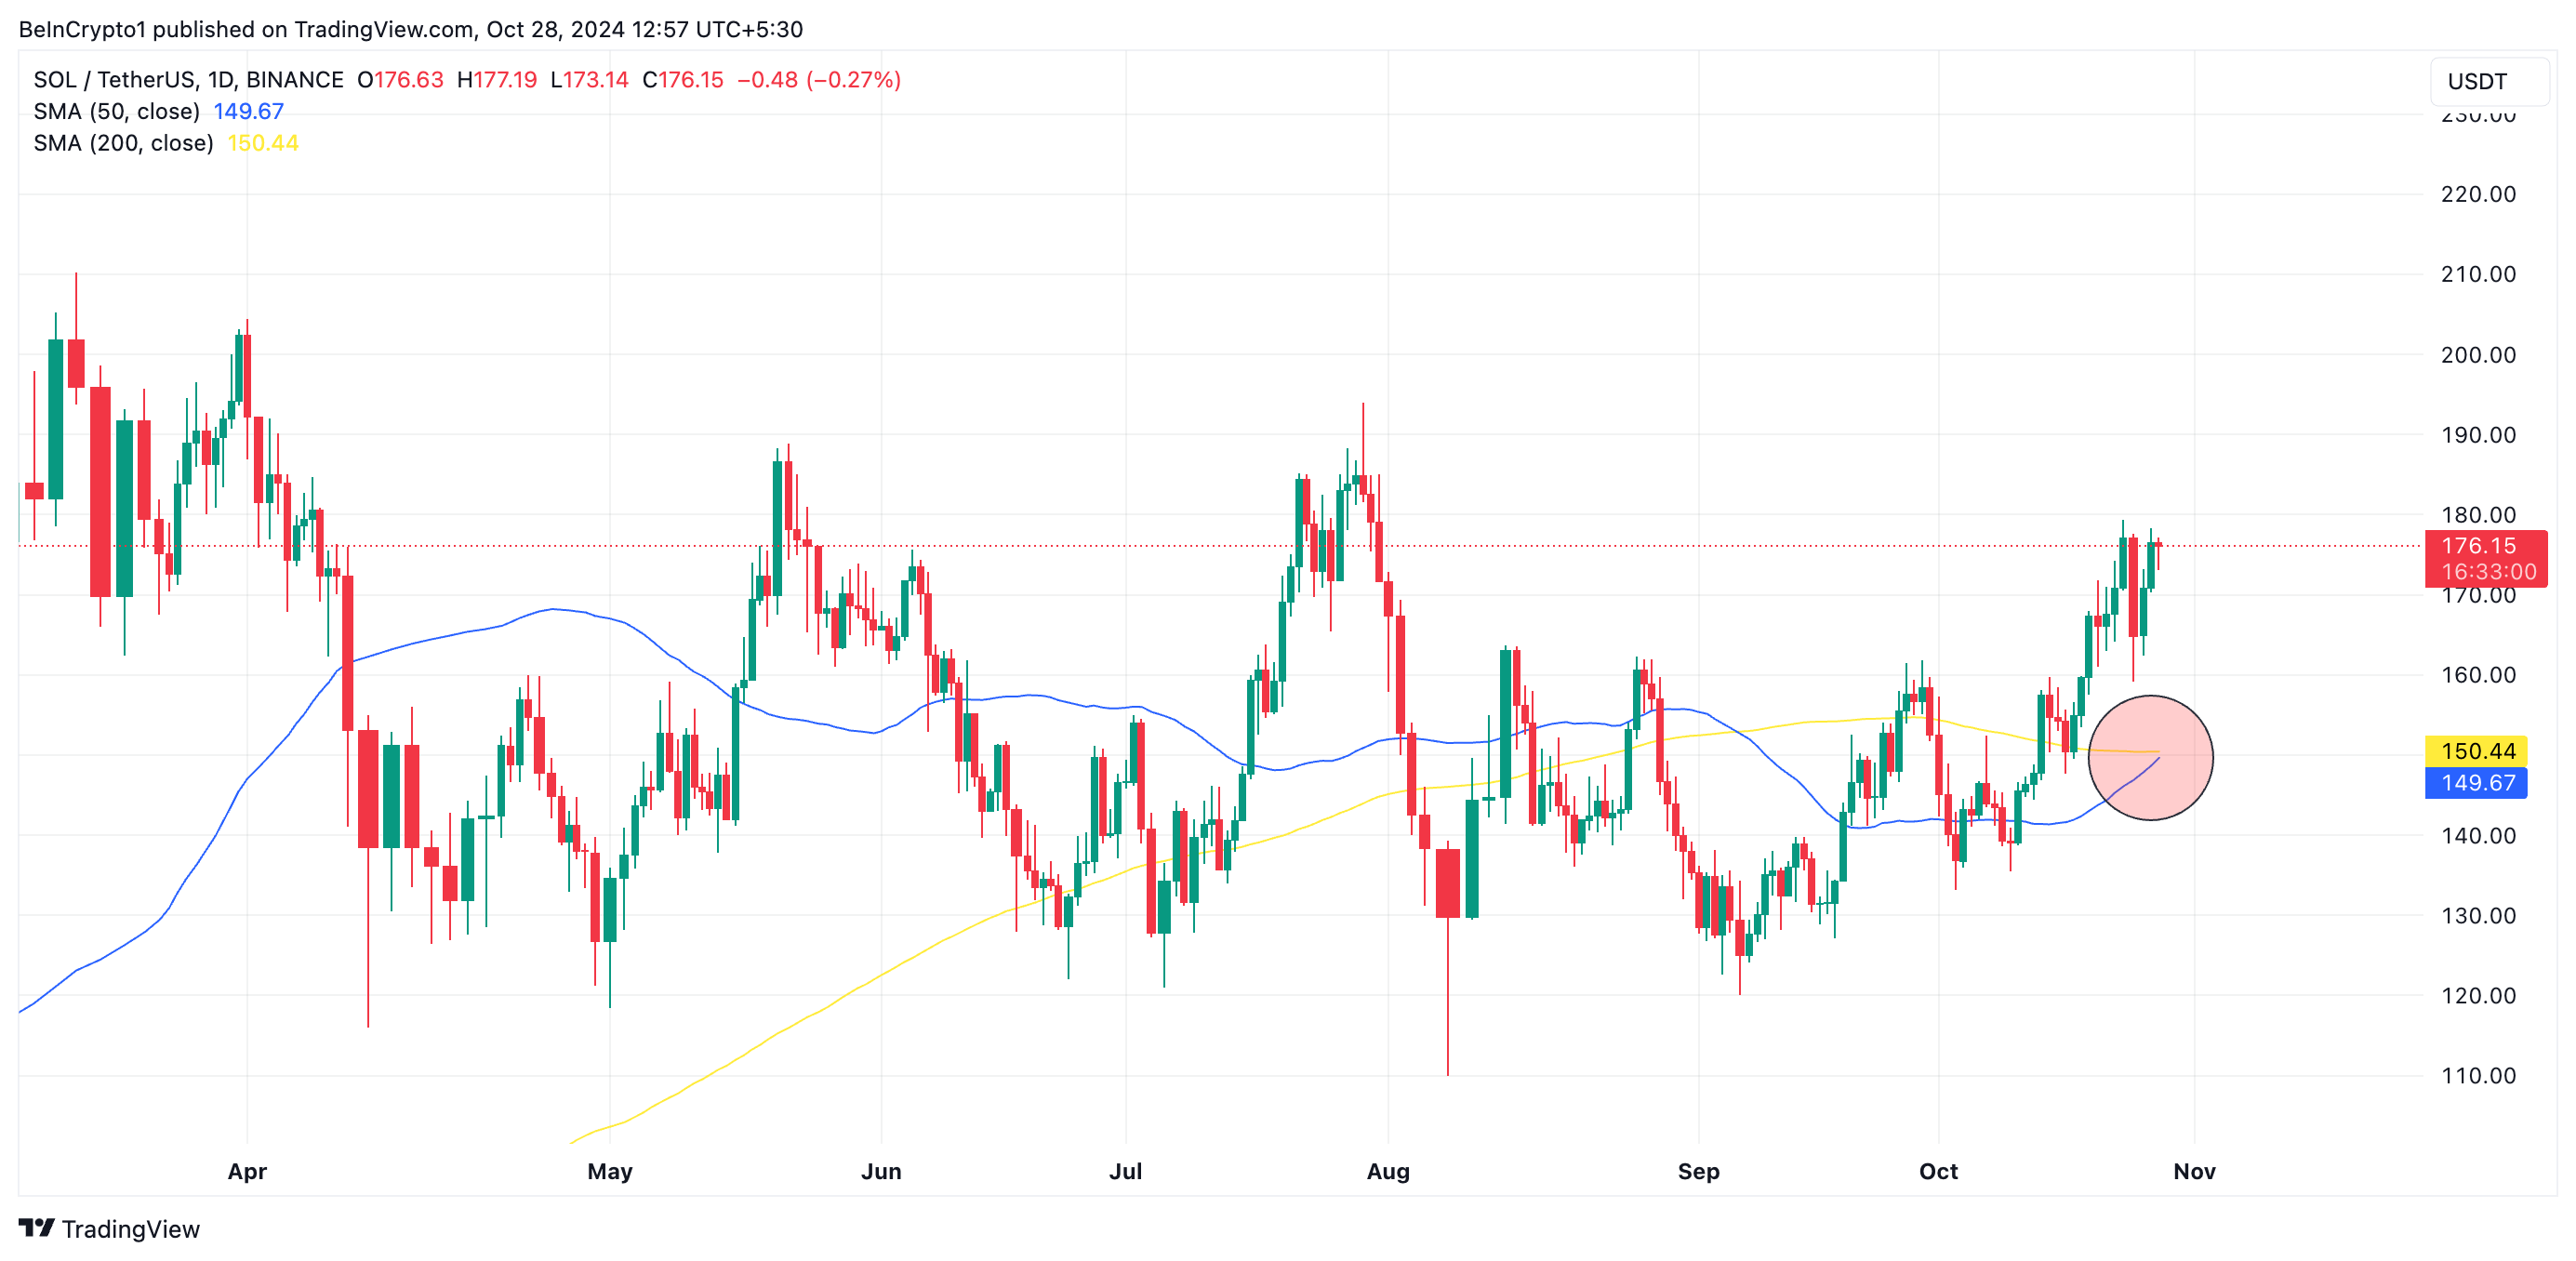
The 50-day SMA calculates the average price over the past 50 days. It acts as an indicator of short-term price trends. When an asset’s price moves above this level, it signals an uptrend in the market.
Meanwhile, the 200-day SMA measures the average price over the last 200 days and represents a long-term trend indicator. When an asset’s price rallies above the 200-day SMA, it indicates a sustained long-term uptrend.
When the 50-day SMA is poised to cross above the 200-day SMA, the asset’s recent price momentum (over the past 50 days) is accelerating faster than its long-term trend (over the past 200 days). This crossover is referred to as a Golden Cross. It confirms a transition from a downtrend to an uptrend and suggests potential price appreciation, often prompting traders to consider long positions.
The successful formation of this bullish signal depends on sustained buying pressure in the SOL market. Its positive Chaikin Money Flow (CMF) suggests this may materialize in the days ahead. Currently, SOL’s CMF is trending upward at 0.24.
The CMF indicator measures money flow into and out of an asset’s market. A positive CMF reading indicates that buying activity outweighs selling pressure, signaling increased demand. Additionally, it confirms that trading volume actively supports the asset’s upward price momentum.
Furthermore, the positive reading from Solana’s Bull Bear Power supports this bullish outlook. As of this writing, this indicator stands at 16.57.
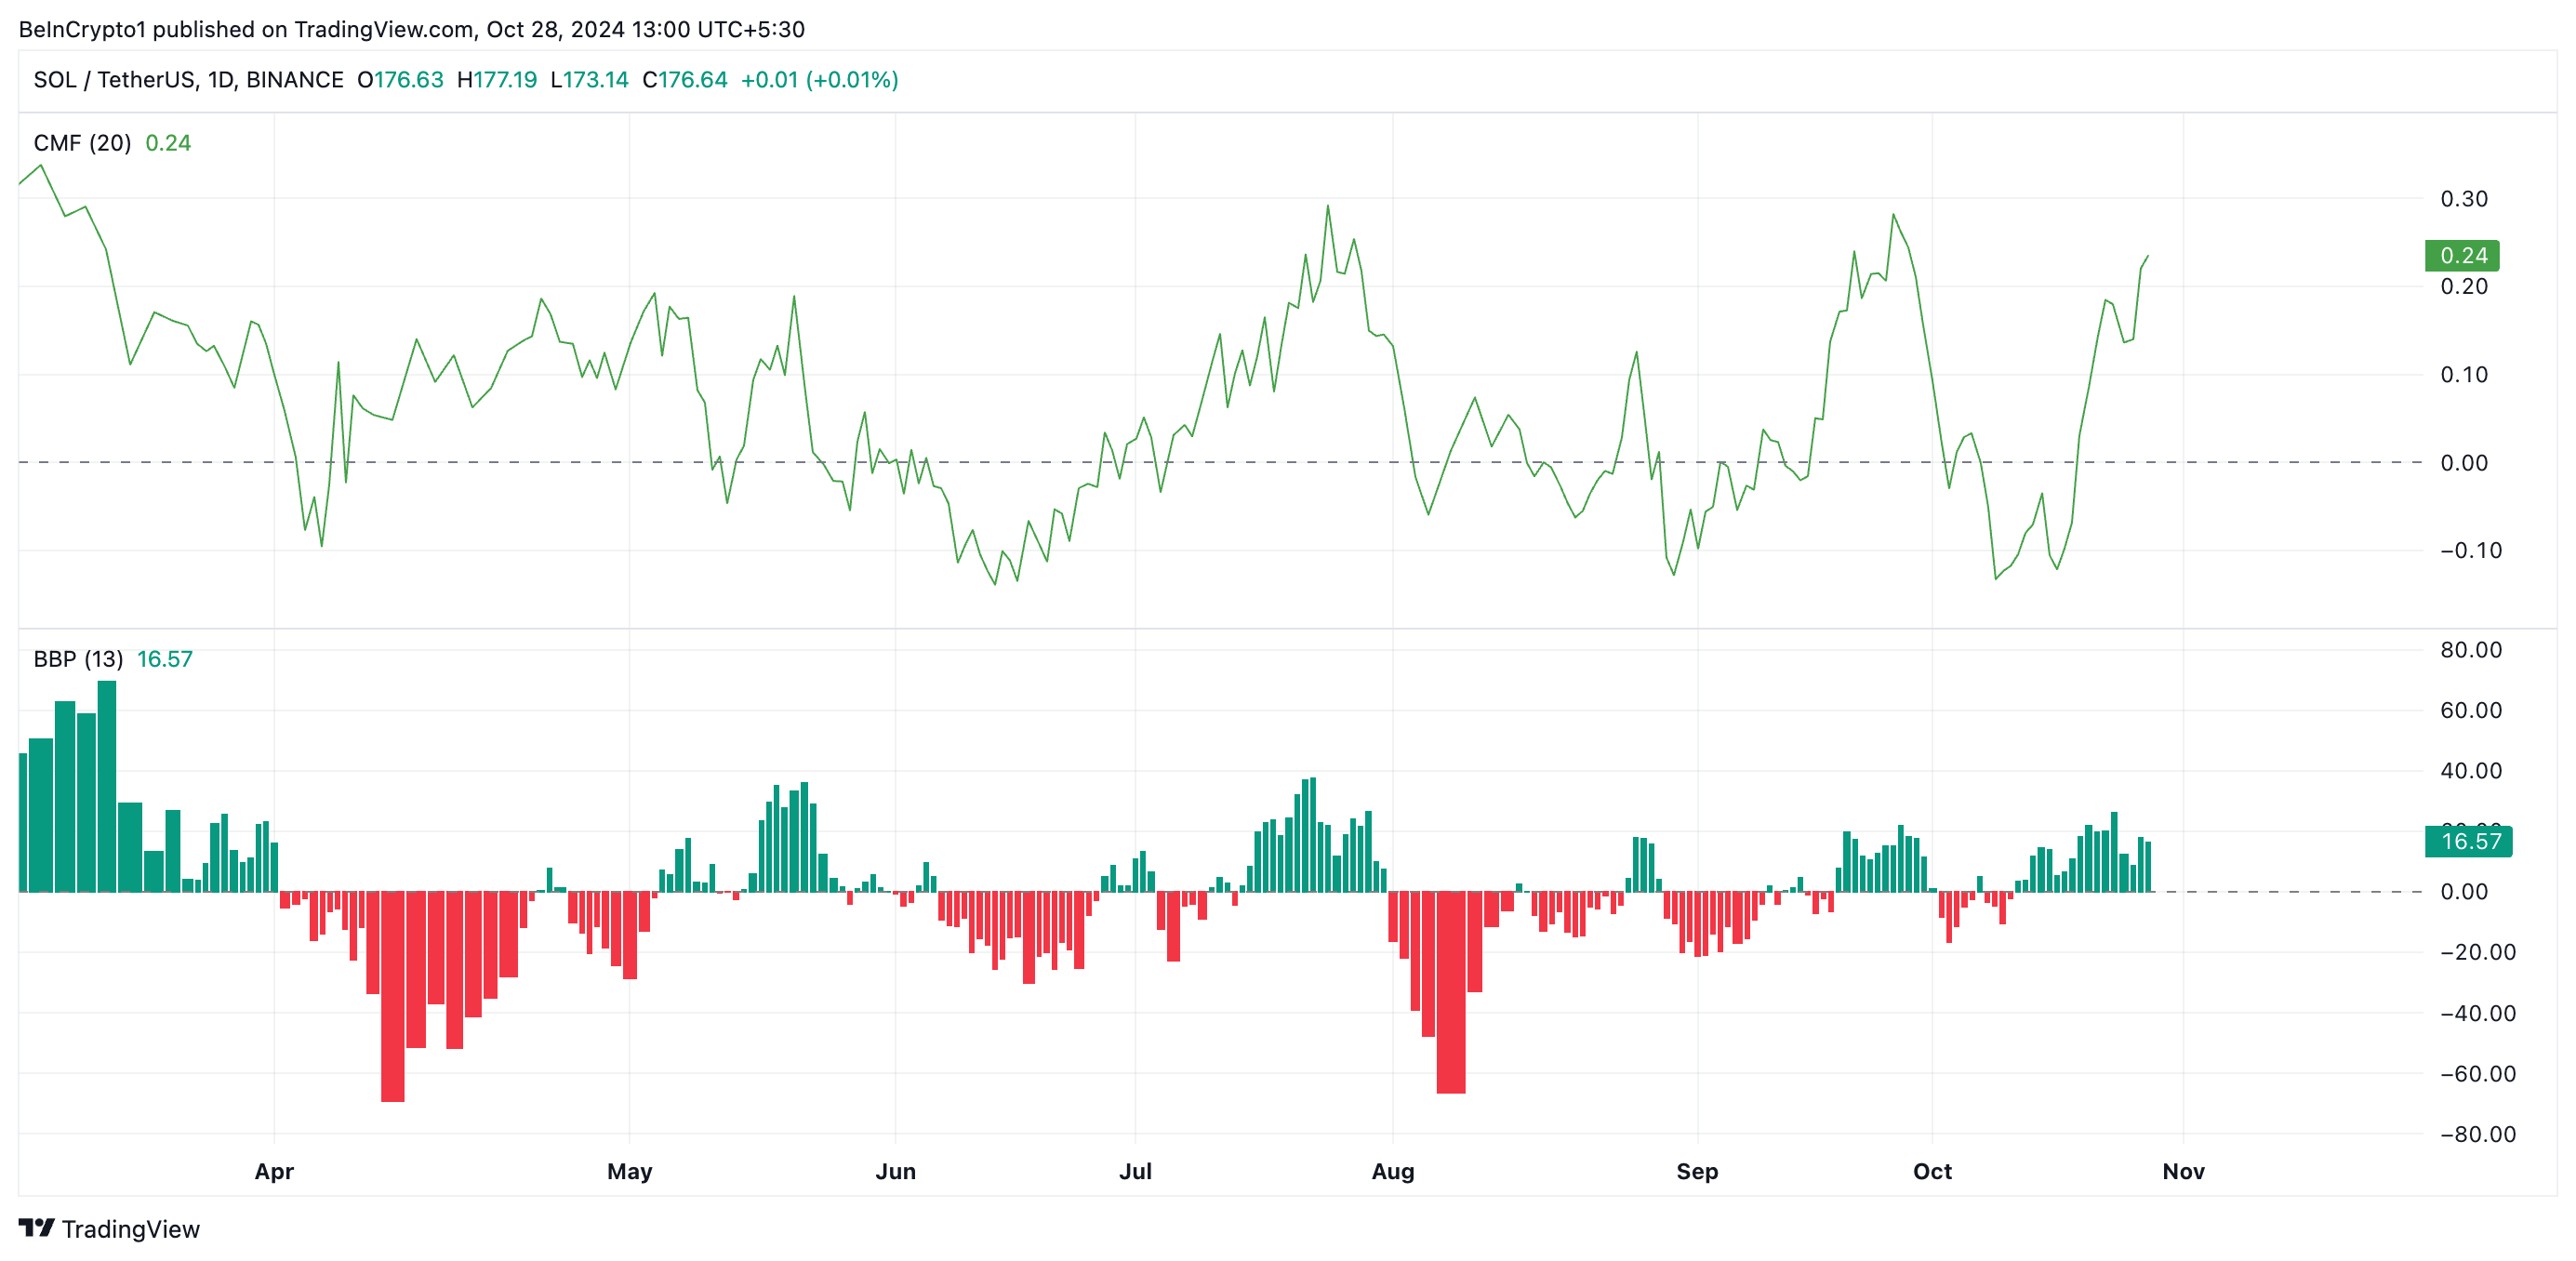
This indicator measures the balance between buying and selling pressure in the market. When it is positive, market sentiment is bullish, as buyers are more active than sellers.
SOL Price Prediction: Key Price Level To Watch
At press time, Solana trades at $176.46, just above the key support level of $171.91. If the level continues to hold as support, it could pave the way for Solana’s price to rally toward resistance at $188.74. A successful breakout above this level could propel Solana’s price toward $210.18, a high it last reached on March 18.
Read more: Solana (SOL) Price Prediction 2024/2025/2030
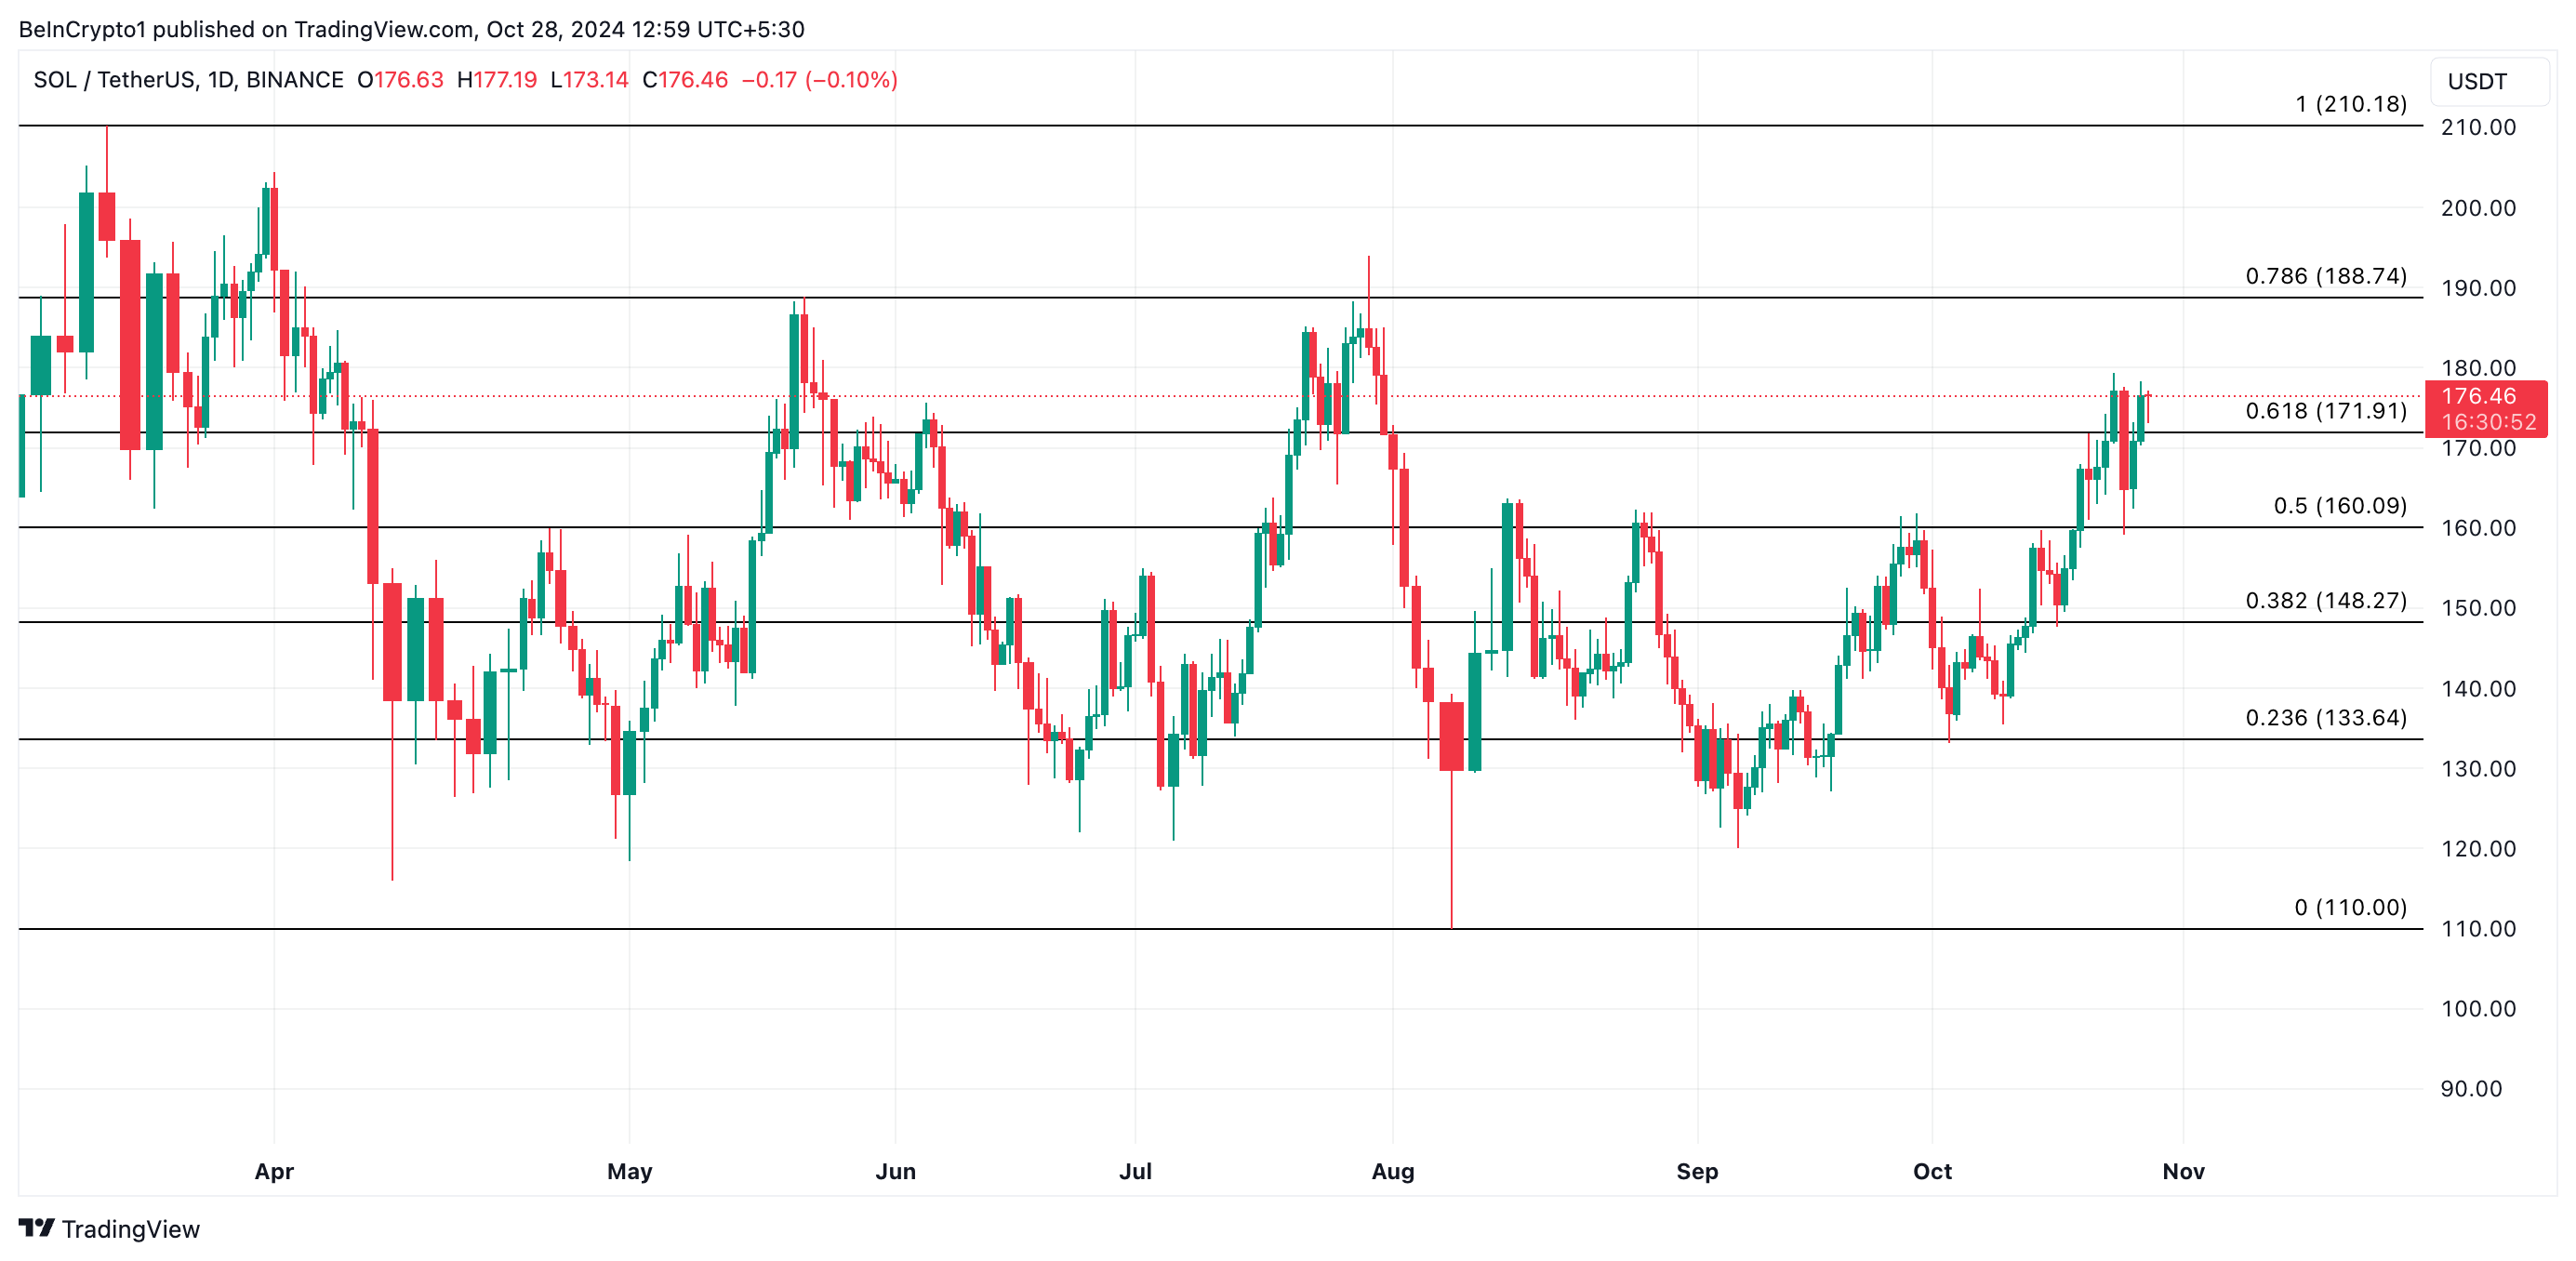
On the other hand, if the $171.91 fails to hold as support, Solana’s price may fall to $160.09. If demand weakens at this level, the altcoin’s value may dip further to $148.27.
Disclaimer
In line with the Trust Project guidelines, this price analysis article is for informational purposes only and should not be considered financial or investment advice. BeInCrypto is committed to accurate, unbiased reporting, but market conditions are subject to change without notice. Always conduct your own research and consult with a professional before making any financial decisions. Please note that our Terms and Conditions, Privacy Policy, and Disclaimers have been updated.