

Recent price action suggests that Bitcoin (BTC) might be nearing a turning point in its trend direction. The DMI highlights BTC’s directional movement, which reveals a weakening bearish trend. The negative directional line, which has led the market for a while, is starting to fade.
Meanwhile, the positive directional line shows signs of growing momentum, suggesting bullish forces are gaining strength. The Average Directional Index (ADX) is also climbing, indicating that the overall strength of the trend is increasing. If the positive line overtakes the negative line, it could confirm a shift towards a bullish trend.
BTC DMI Hints At Uptrend
BTC’s recent price movement suggests a potential turning point in market sentiment. For an extended period, bearish momentum, indicated by the negative directional line (red), has dominated. However, the selling pressure is showing signs of weakening as the red line begins to decline.
Meanwhile, the positive directional line (blue) is gradually rising, pointing to growing bullish momentum. This convergence suggests that the ongoing bearish trend may be losing its grip, with bullish forces preparing to take the lead.
Read more: Top 7 Platforms To Earn Bitcoin Sign-Up Bonuses in 2024
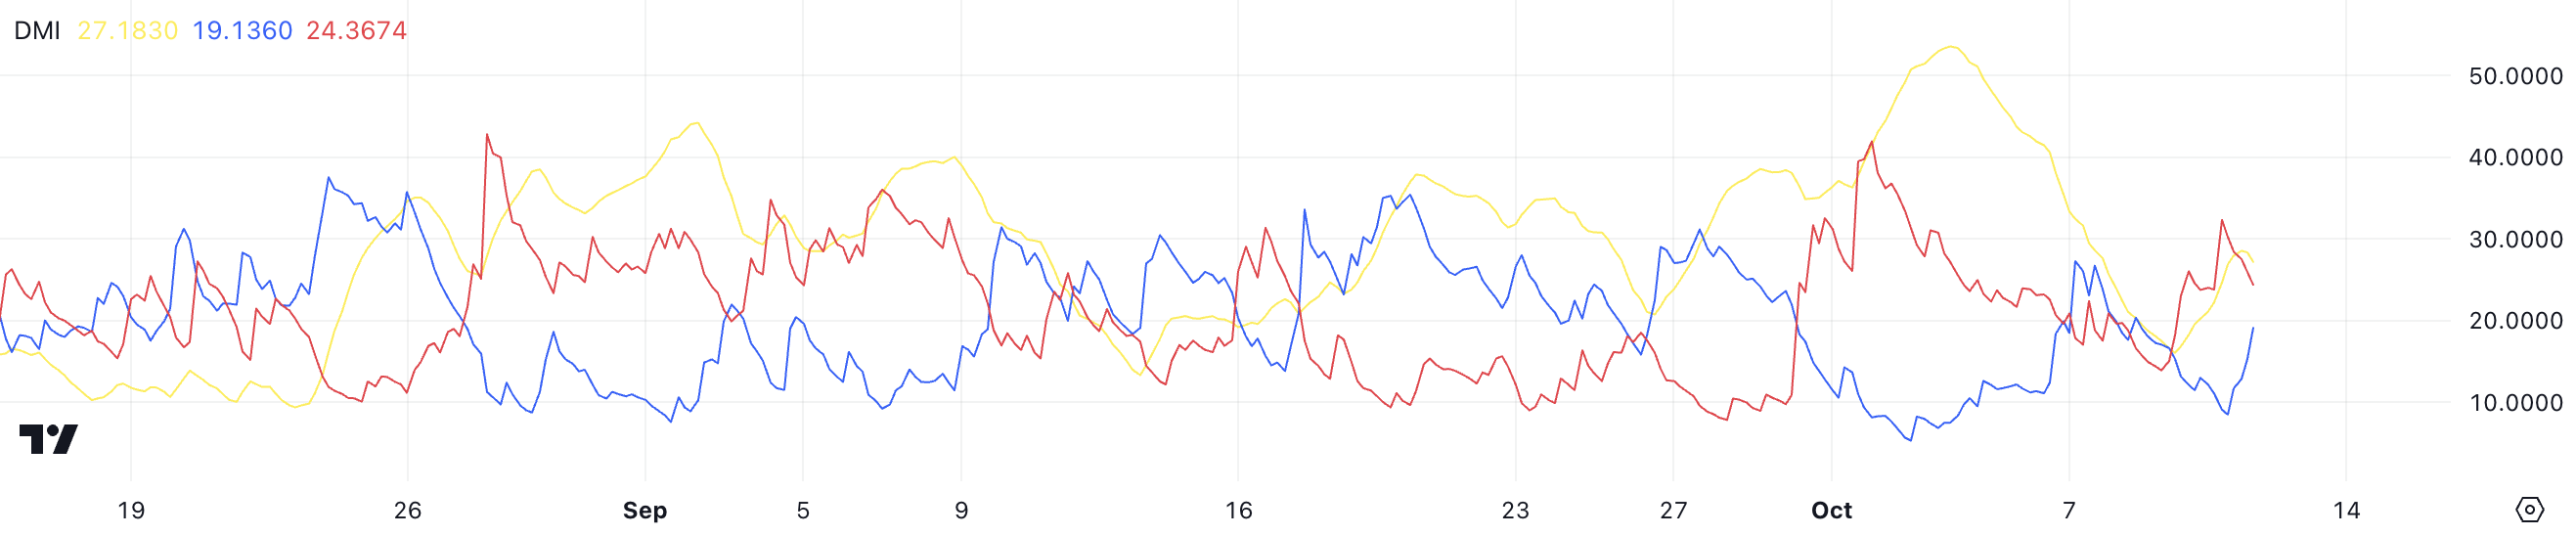
This evolving situation is captured by the Directional Movement Index (DMI), which includes three components: the positive directional line (+DI), negative directional line (-DI), and the Average Directional Index (ADX). The ADX, shown as the yellow line, measures the strength of the prevailing trend and has been climbing recently.
With the bearish line weakening and the bullish line gaining, the rising ADX suggests that a significant change in the trend could be in progress. If the +DI overtakes the -DI, it would signal a shift to bullish dominance, potentially marking the beginning of a new upward trend for BTC.
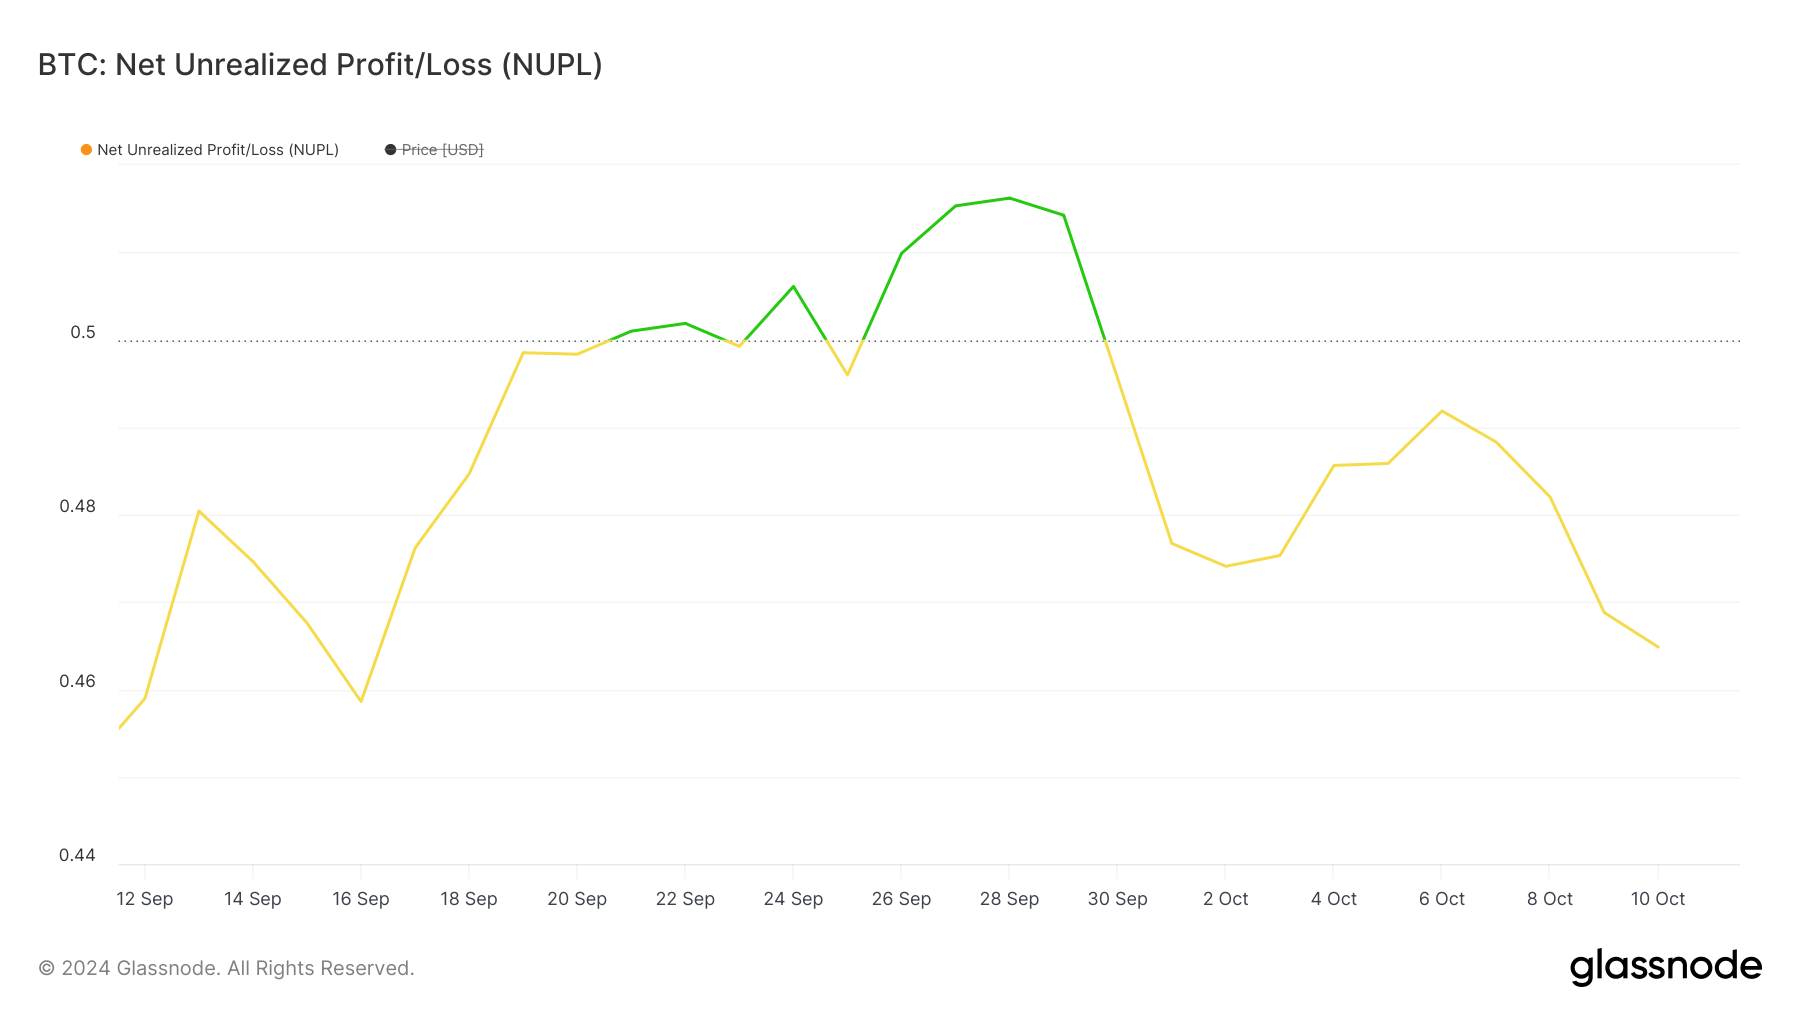
Bitcoin NUPL Isn’t Showing A Clear Direction
The Net Unrealized Profit/Loss (NUPL) for Bitcoin has shown some notable fluctuations over the past month. Initially, the NUPL metric trended upwards, crossing the 0.50 mark in late September, which indicated that a significant portion of market participants were in profit.
This region typically signals increasing market optimism and a transition toward a “belief” phase where holders are becoming more confident. However, the recent decline in the NUPL value, which has fallen back below 0.50, suggests that market sentiment is beginning to shift.
This reversal indicates a reduction in unrealized profits, likely driven by a drop in price, causing some investors to move into a more cautious state.
Read more: 7 Best Crypto Exchanges in the USA for Bitcoin (BTC) Trading
A decreasing NUPL value often reflects a shift in sentiment from optimism back towards neutral or even anxiety, especially if the metric continues declining towards the 0 mark. This recent downward movement signals that the majority of the market’s unrealized profits are diminishing, which can potentially trigger increased selling pressure.
If this trend continues, BTC could enter a phase where market participants become increasingly risk-averse. On the other hand, should BTC’s price stabilize or recover, it could create renewed optimism, pushing the NUPL back towards higher levels.
The current scenario places the market at a crossroads, with the next price movements being crucial in defining the broader sentiment.
BTC Price Prediction: A Possible Rebound Soon?
BTC’s EMA lines are currently in a bearish alignment, with short-term lines positioned below long-term ones. However, the short-term lines are starting to turn upward.
If they manage to cross above the long-term lines, it would create a “golden cross” pattern. A golden cross is a bullish signal where a short-term moving average crosses above a long-term moving average, often indicating a potential shift to an uptrend.
EMA (Exponential Moving Average) lines are trend-following indicators used to smooth out price data and highlight market trends. They give more weight to recent price movements, making them responsive to changes in momentum. Traders often use the position and crossovers of short-term and long-term EMA lines to identify potential buying or selling opportunities.
Read more: Bitcoin (BTC) Price Prediction 2024/2025/2030
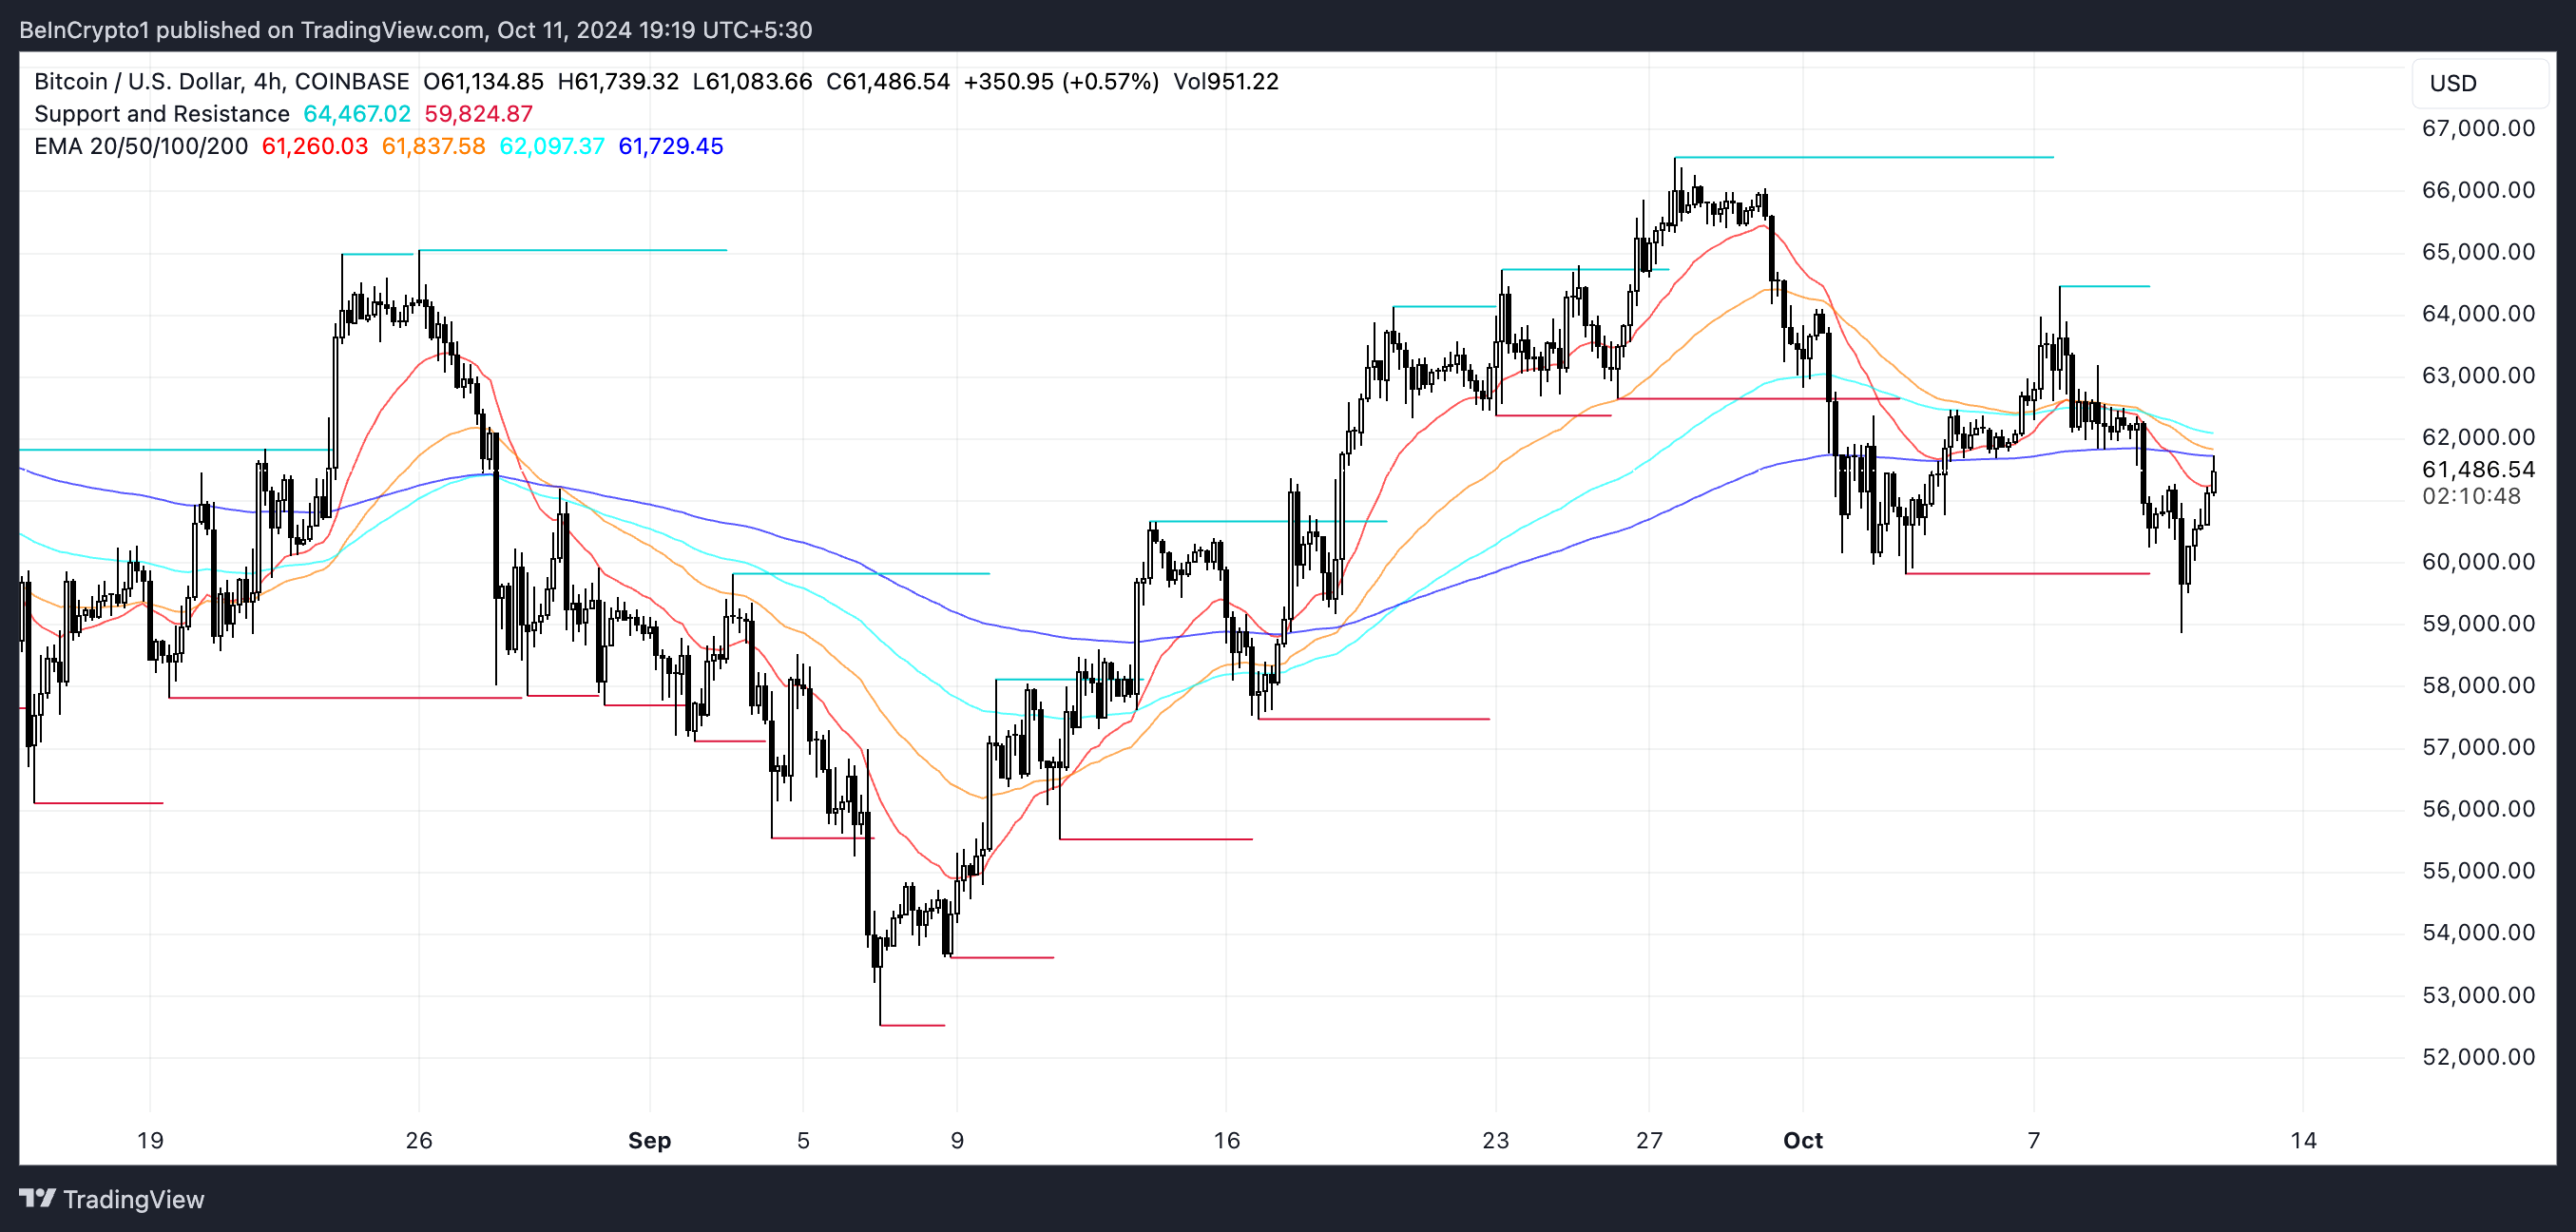
If the uptrend continues to develop, BTC will likely test resistance at around $64,700. Breaking this level could lead to a further rally toward $66,500, representing a potential 7.2% price increase.
However, if this uptrend fails to materialize, BTC could remain in its downtrend, with a likely test of support at $59,000. Should this level not hold, the price might fall as low as $57,000, potentially resulting in an 8% correction.
Disclaimer
In line with the Trust Project guidelines, this price analysis article is for informational purposes only and should not be considered financial or investment advice. BeInCrypto is committed to accurate, unbiased reporting, but market conditions are subject to change without notice. Always conduct your own research and consult with a professional before making any financial decisions. Please note that our Terms and Conditions, Privacy Policy, and Disclaimers have been updated.