

Optimism (OP) price has been under pressure this year, reflecting the broader challenges faced by the scaling solution ecosystem. Key indicators suggest a significant shift in market sentiment, raising concerns about future price trends.
While recent metrics point to bearish signals, there are still opportunities for potential gains. Investors are watching closely for signs of a turnaround as OP approaches key support and resistance levels.
This Year Is Challenging For Scaling Solutions
The four biggest scaling solution coins — Arbitrum, Polygon, Mantle, and Optimism — are all experiencing significant declines this year, with Optimism (OP) suffering the sharpest drop at -62.74%. This sharp downturn shows the growing challenges within the scaling solution ecosystem, once considered vital for addressing Ethereum’s limitations.
For a long time, Optimism and Arbitrum have been the undisputed leaders in this space, attracting significant attention and investment, while Polygon remained a competitive but somewhat distant player. However, Mantle has recently emerged as a strong contender, fastly closing the gap between itself and Optimism.
Read more: Optimism vs. Arbitrum: Ethereum Layer-2 Rollups Compared
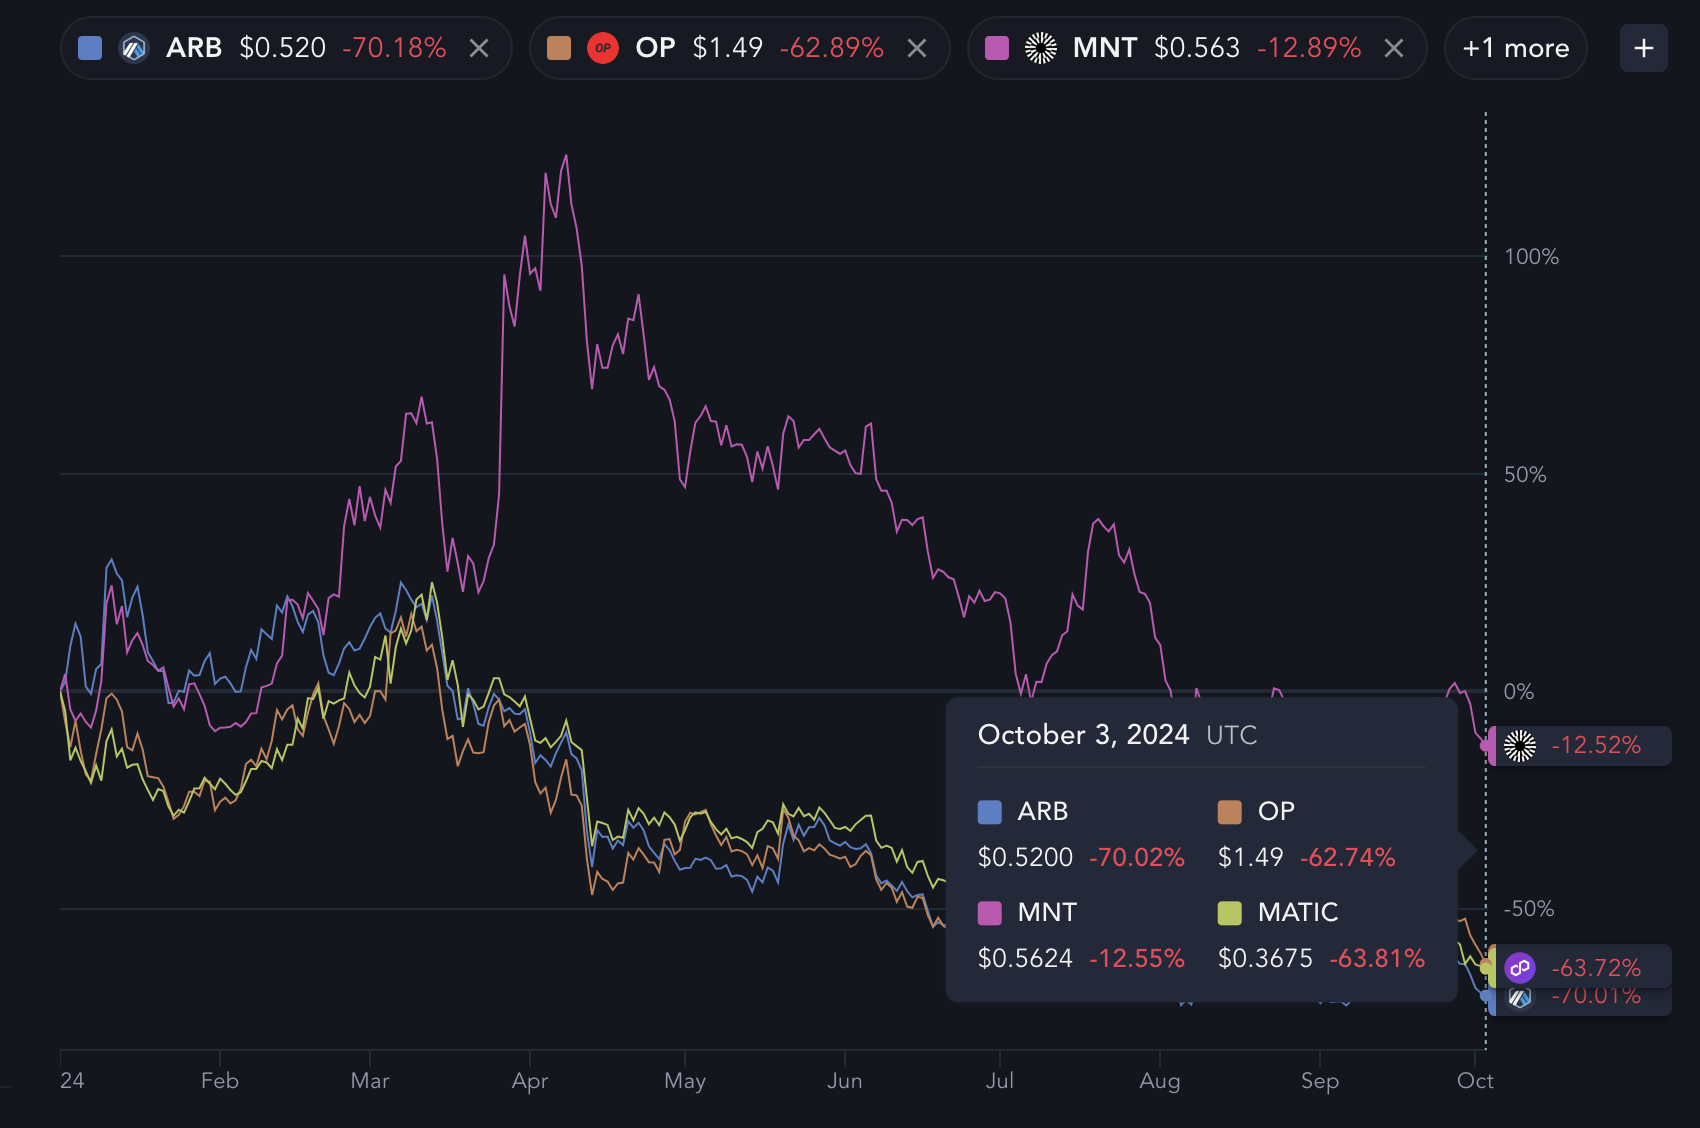
The current difference in market cap between Mantle and Optimism is now just $400 million ($2 biilion for OP vs $1.6 billion for Mantle), signaling a shift in momentum. As Mantle gains ground, questions are beginning to surface about the future of scaling solutions.
The hype surrounding these projects was immense in recent years, driven by the need for cheaper and faster transactions on Ethereum, but now, it seems that the excitement is starting to dissipate. If this trend continues, it could have a profound impact on the valuation and price of OP, especially as investors reconsider the long-term viability of scaling solutions as the ultimate answer to blockchain scalability.
Is Optimism Currently Oversold?
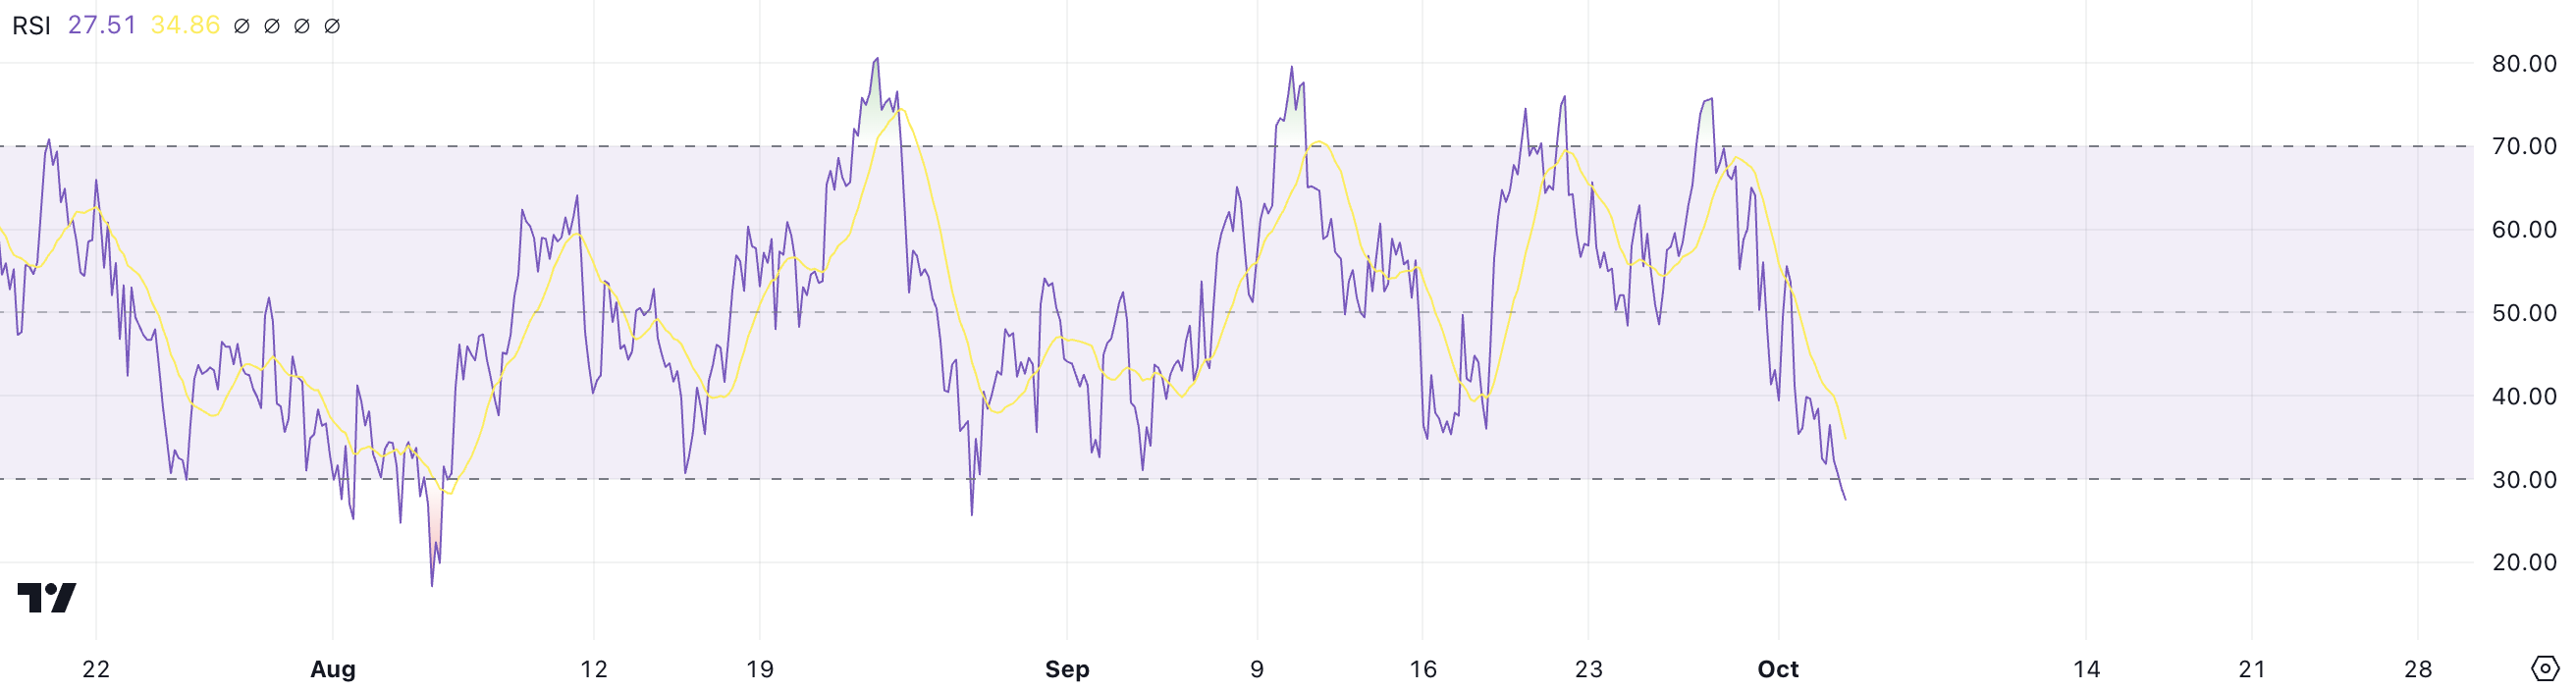
OP Relative Strength Index (RSI) is currently at 27.99, which is significant as it suggests that the token is now in oversold territory. RSI is a momentum indicator used to measure the speed and change of price movements, with a scale ranging from 0 to 100.
Typically, an RSI below 30 signals that an asset may be oversold and undervalued, while an RSI above 70 indicates that it might be overbought and due for a correction. Just four days ago, on September 28, OP’s RSI was at 75, signaling that it was overbought.
A sharp drop from 75 to 27.99 in such a short time points to a dramatic shift in market sentiment. That suggests that sellers have been overwhelming buyers, pushing the price down quickly.
While the scaling solutions ecosystem has struggled in 2024, with major projects like Optimism seeing substantial price declines, this sudden and steep drop in OP’s RSI could actually represent a potential buying opportunity. When RSI falls below 30, it often signals that the asset is undervalued and that a price rebound could be on the horizon as market conditions stabilize.
Given the significant decrease in OP’s RSI, now might be a good entry point for investors looking to capitalize on a potential recovery, even in an otherwise uncertain scaling solutions market. This low RSI suggests that much of the selling pressure may have already been priced in. That presents a more favorable risk-reward scenario for those willing to bet on a turnaround.
OP Price Prediction: A Potential 21% Rebound
OP Exponential Moving Average (EMA) lines are currently forming a death cross, a bearish signal that occurs when a short-term EMA crosses below a long-term EMA. This pattern often indicates that a strong downtrend may be ahead. It suggests a shift in momentum where recent price declines are outpacing longer-term price trends.
EMA lines are a type of moving average that weighs recent price data more. That makes them more sensitive to current market movements than simple moving averages. Traders use these lines to gauge the strength and direction of price trends.
Read more: What Is Optimism?
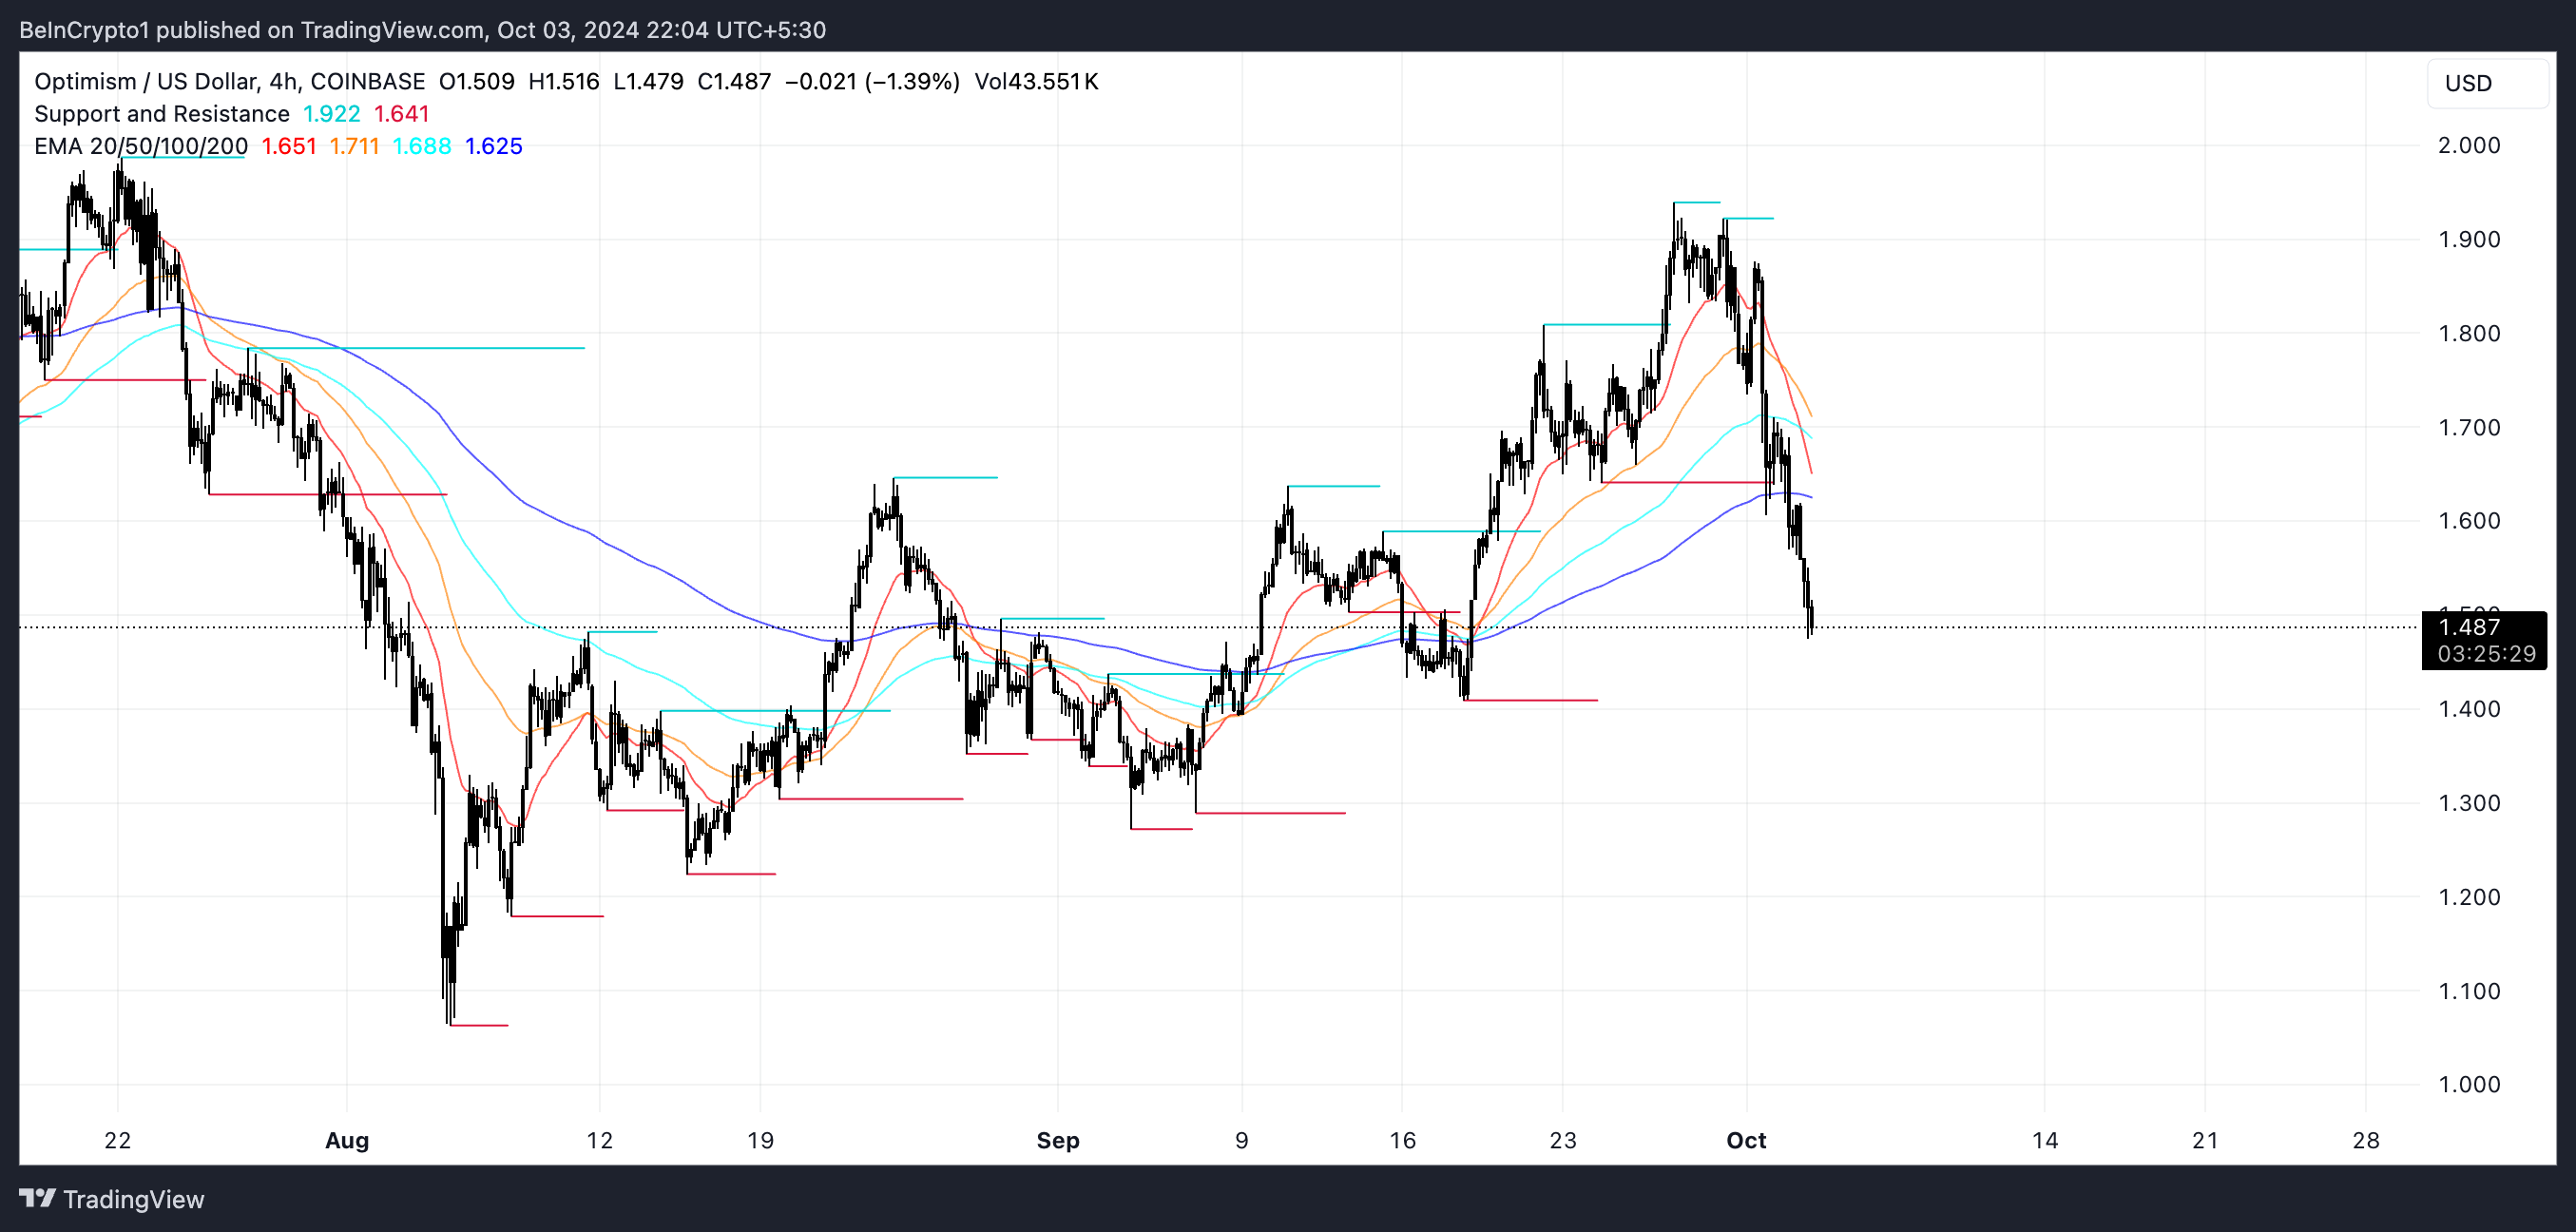
If this downtrend continues, OP’s price could test key support zones at $1.41 and $1.29. However, the bearish momentum could drive the price as low as $1.06, representing a potential 30% decline from current levels. This would be a critical point for traders to watch, as breaking below these support levels could signal further weakness.
On the other hand, if an uptrend emerges and the death cross proves to be a false signal, the current price could actually offer a strong buying opportunity. If OP bounces back, it could test resistance at $1.63. If that level is surpassed, it might reach $1.81, offering the potential for a 21% price increase.
Disclaimer
In line with the Trust Project guidelines, this price analysis article is for informational purposes only and should not be considered financial or investment advice. BeInCrypto is committed to accurate, unbiased reporting, but market conditions are subject to change without notice. Always conduct your own research and consult with a professional before making any financial decisions. Please note that our Terms and Conditions, Privacy Policy, and Disclaimers have been updated.