

Render (RNDR) price has surged by 26% over the last week, establishing it as a key player in the booming crypto AI sector. However, despite this strong price growth, RNDR is lagging behind its top competitors in critical metrics like social dominance and trading volume. Tokens such as FET, TAO, and WLD have captured more market attention, raising questions about RNDR’s long-term momentum.
Indicators, including the Bollinger Bands Trend and Global In/Out of the Money, signal that RNDR may face significant resistance ahead. As the coin’s upward momentum begins to cool, the next few weeks will be crucial for RNDR’s price.
Is RNDR Being Left Behind In the Crypto AI Race?
RNDR has solidified its position as one of the most prominent players in the crypto AI space, riding on the wave of increased interest in artificial intelligence coins. Over the last seven days, RNDR’s price has seen an impressive 26% increase, reflecting strong market demand. However, when placed alongside the top five AI coins, the picture becomes more complex.
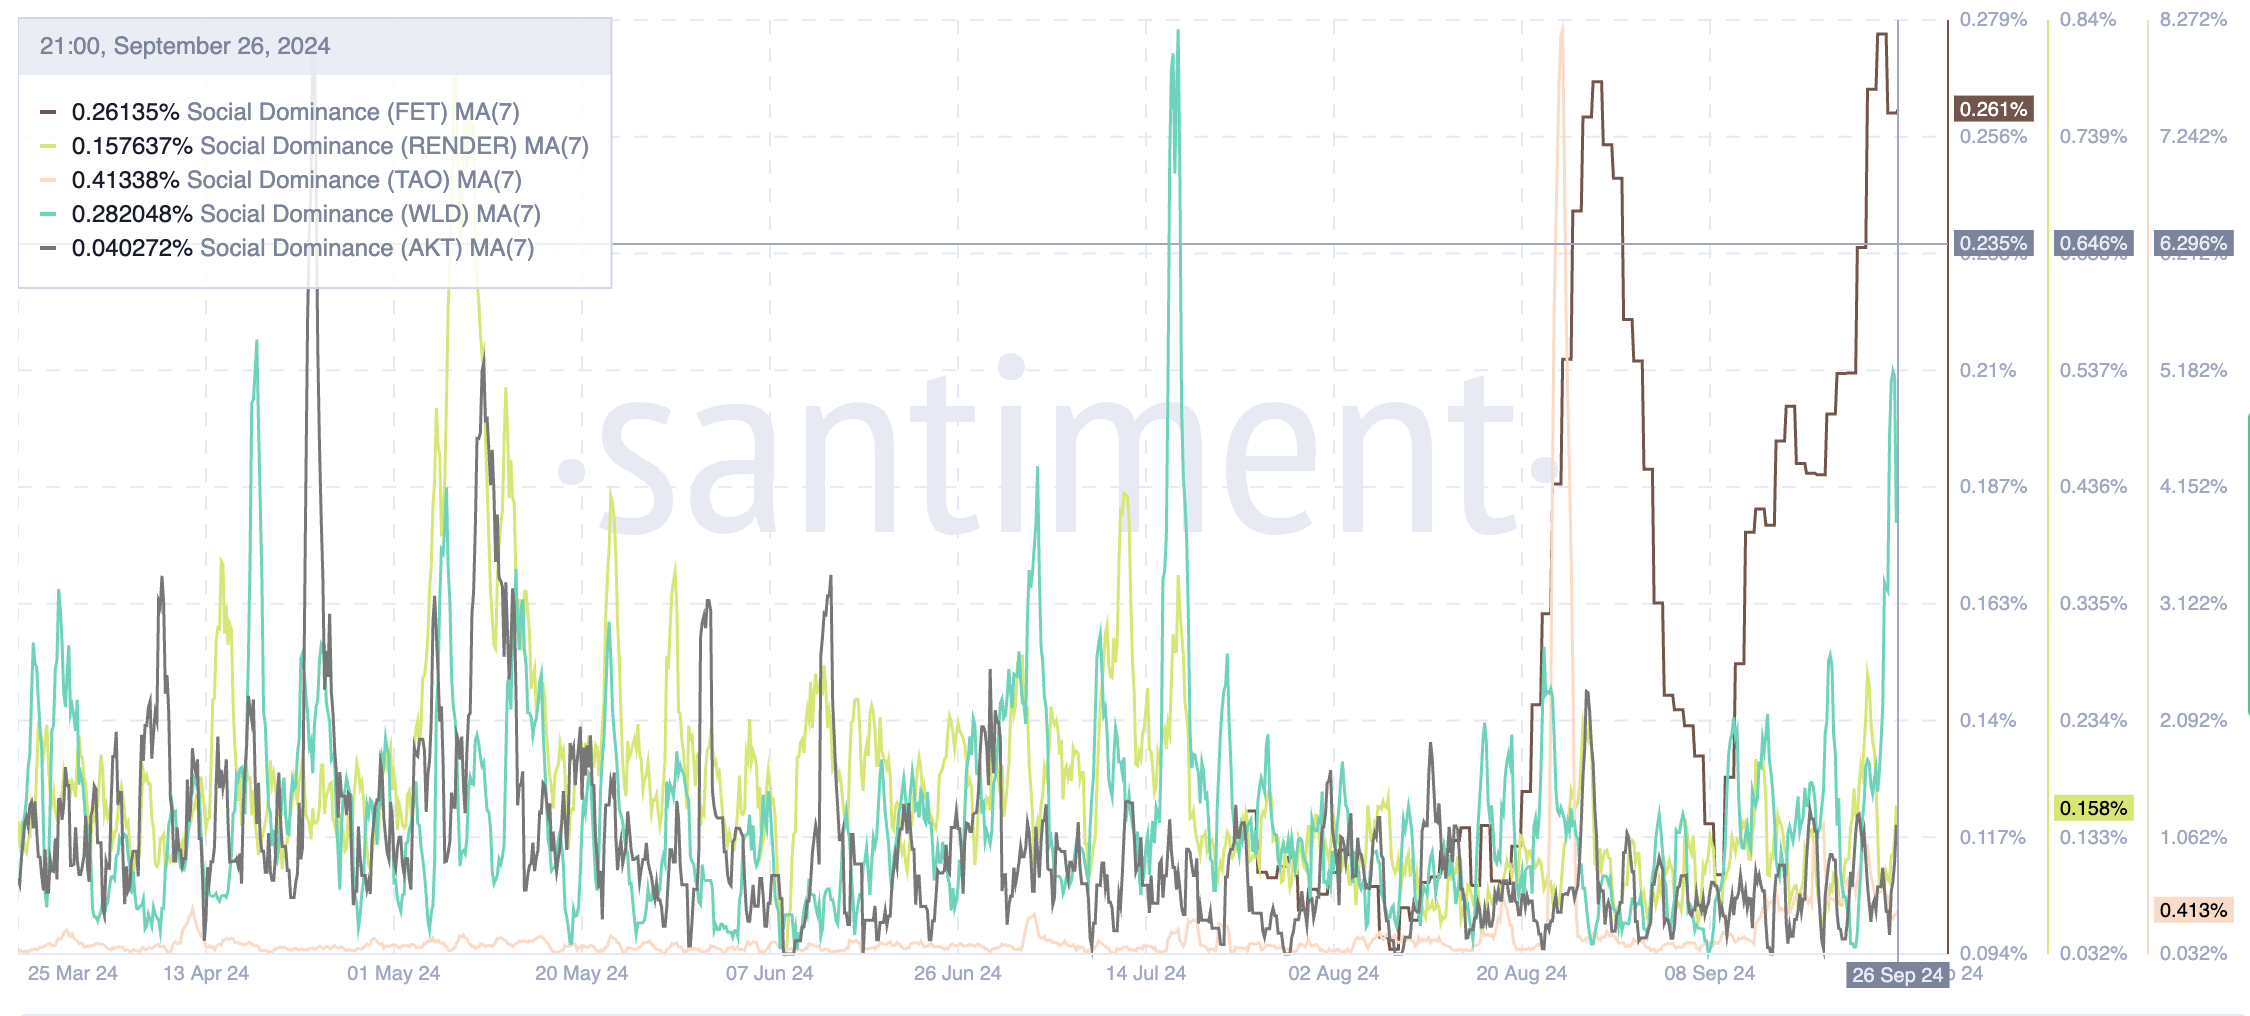
Despite its ranking as the third-largest AI token by market cap, RNDR ranks only fourth in terms of social dominance. That suggests it’s not garnering the same level of attention or hype as some of its competitors. Players like FET, TAO, and WLD have captured more of the public’s focus, leaving RNDR to compete for visibility, only outperforming AKT in terms of attention.
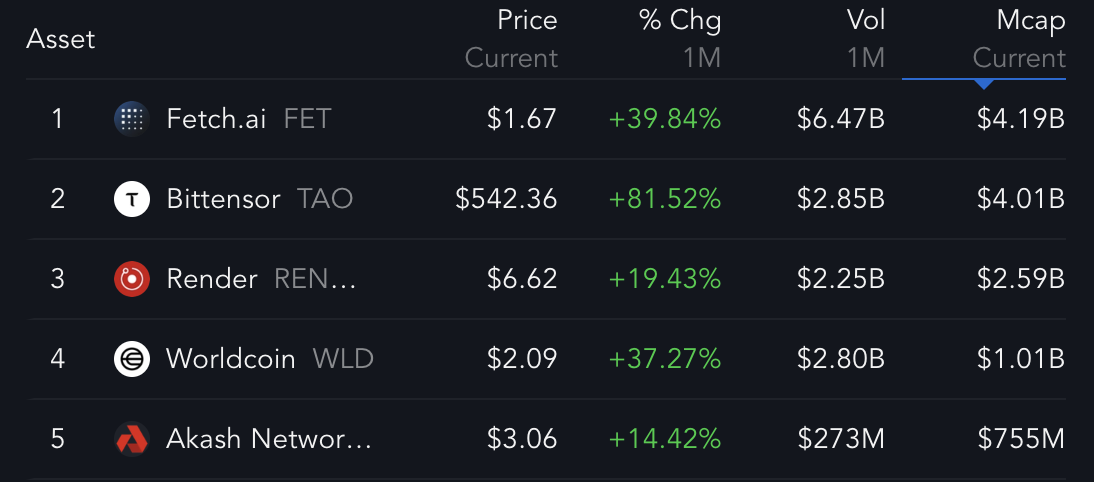
This underperformance in social dominance aligns with its relative price growth. Over the past month, RNDR has risen by 19%, a respectable gain but still lagging significantly behind FET (up 39.84%), TAO (up 81.52%), and WLD (up 37.27%).
Once again, RNDR only outpaces AKT, which trails behind the rest. The same trend can be observed when looking at trading volume.
Read More: Render Token (RNDR) Price Prediction 2024/2025/2030
While RNDR attracted $2.25 billion in trading volume last month, this figure is notably lower than that of FET, TAO, and WLD. This suggests that the broader market interest and liquidity are flowing more heavily toward its competitors.
These dynamics indicate that while RNDR is undeniably a key player in the AI and crypto segment, it is struggling to maintain momentum against its fiercest rivals. This disparity in social engagement, price performance, and volume could signal potential headwinds for RNDR price in the near future.
Without a significant uptick in market attention or renewed catalysts to drive interest, RNDR’s current underperformance relative to its competitors might dampen its price trajectory in the weeks to come. In a market as sentiment-driven as crypto, the ability to capture attention is crucial. RNDR’s comparative lack of visibility could hinder its long-term performance despite its possible solid fundamentals.
RNDR Bollinger Bands Trend Could Be Cooling Off
The Bollinger Bands Trend (BBTrend) for RNDR has remained positive for the last six days, rising sharply from 0.36 to 18, mirroring its recent price growth.
Bollinger Bands Trend is a technical indicator used to measure market volatility and trend strength. It is based on the concept of Bollinger Bands, which plot two standard deviations away from a moving average.
When prices are consistently near the upper band, it suggests a strong bullish trend. However, a move toward the lower band can indicate potential bearishness.
The BBTrend specifically looks at how the bands are expanding or contracting to signal whether volatility is increasing or decreasing, which often hints at potential price movements.
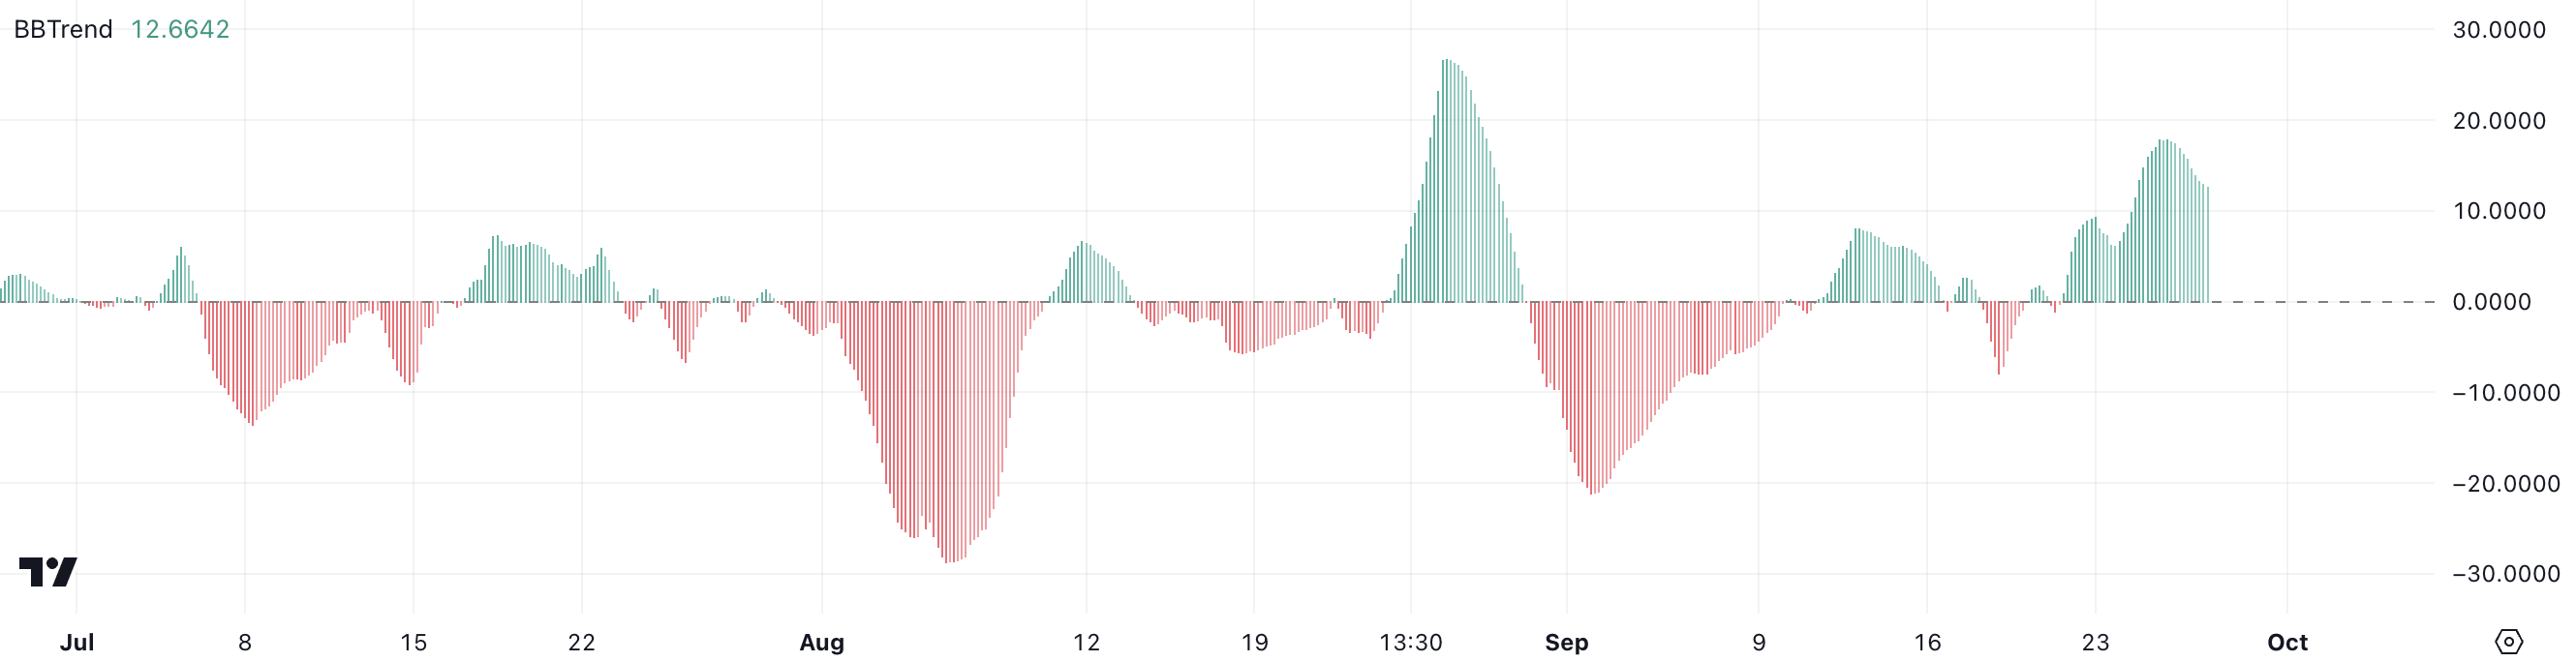
While the BBTrend has shown positive growth recently and is still positive, around 12, it has started to decline in the last few days. This drop in the indicator could be a warning sign that the upward momentum might be slowing down.
If the BBTrend continues to decrease, it may suggest a potential shift in the current price trend. This shift may signal a reversal or consolidation period for RNDR.
On the other hand, if the BBTrend recovers and turns back upward, it could reinforce the bullish momentum. This shift may lead to further price gains. The coming days will be crucial in determining whether RNDR can maintain its positive trend.
RNDR Price Prediction: Correction Ahead?
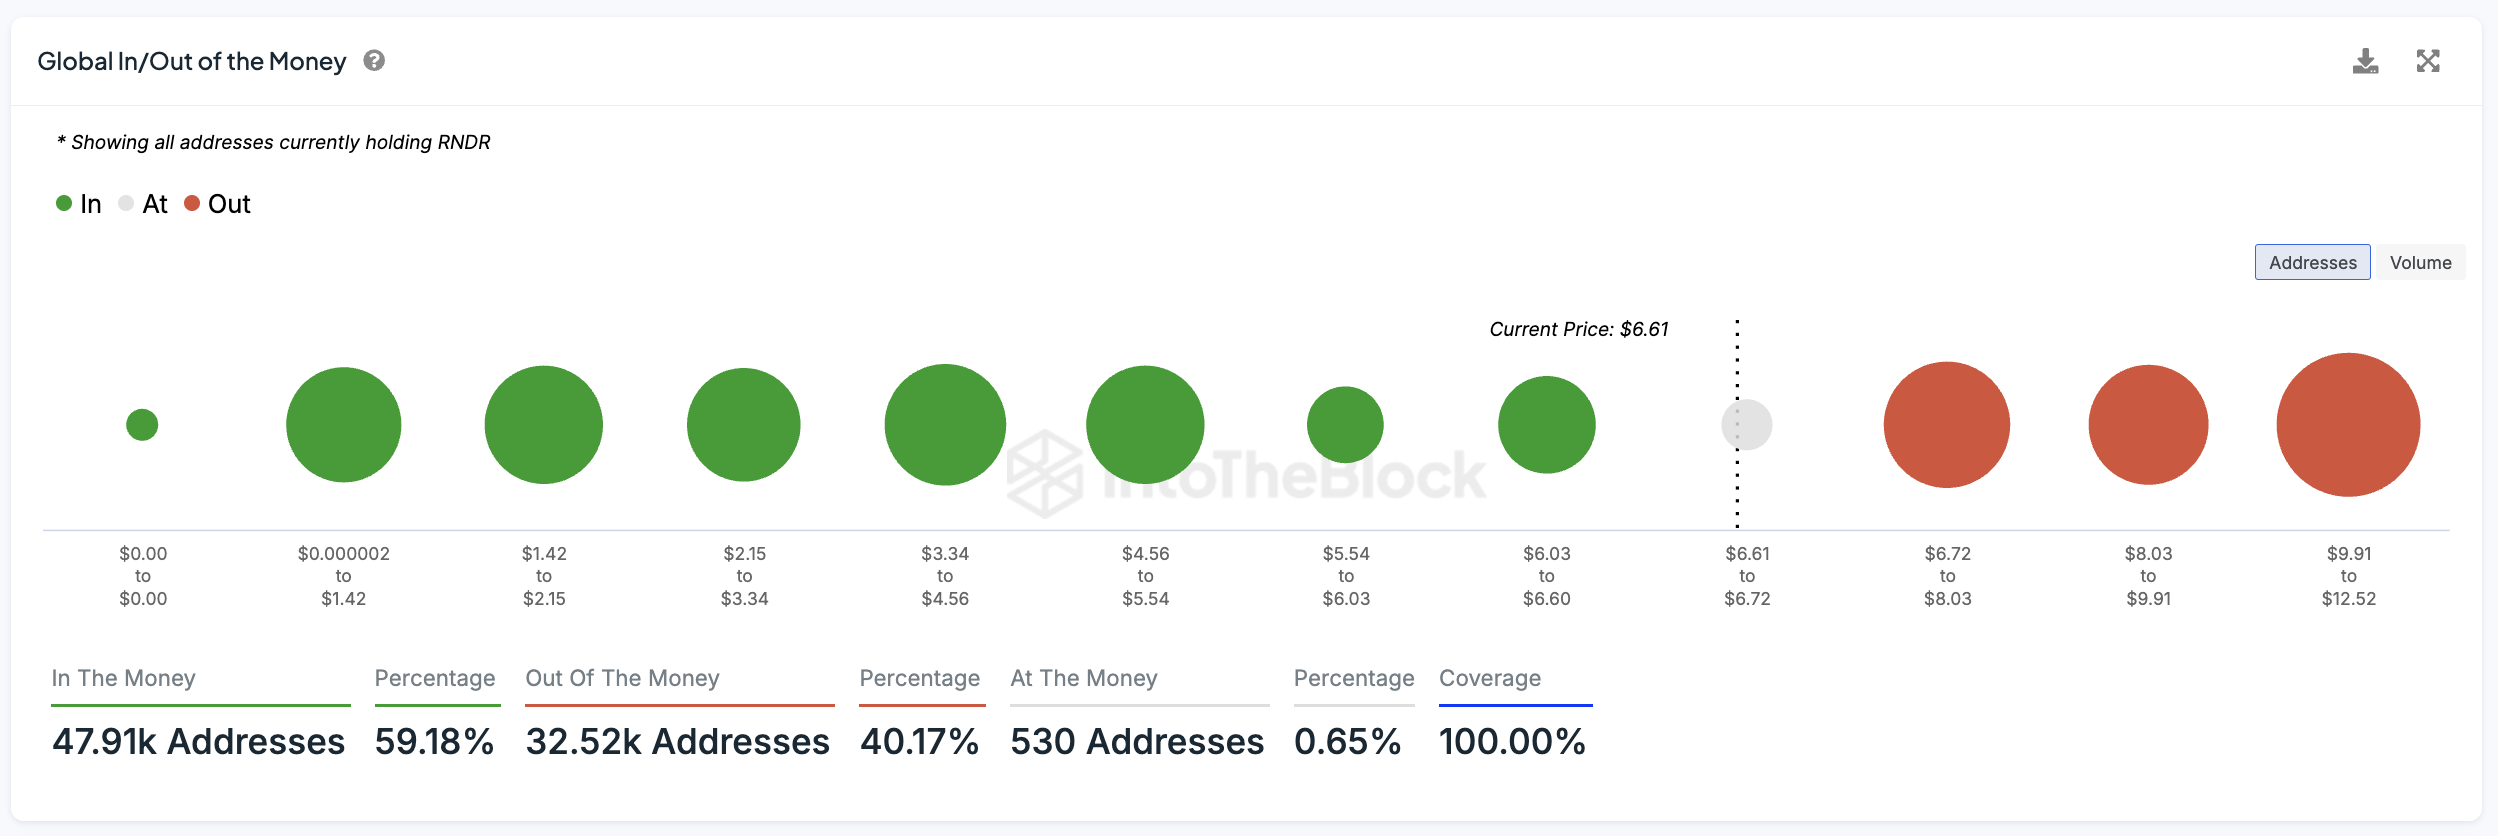
The RNDR Global In/Out of the Money (GIOM) indicator reveals strong resistance levels ahead, particularly in the $6.72 to $8 range. This range indicates that a significant number of RNDR holders purchased at these price levels. As a result, there could be potential selling pressure when the price approaches these points.
GIOM is a key metric that shows how many token holders are either “in the money” (holding tokens at a profit based on current prices) or “out of the money” (holding tokens at a loss). If RNDR can break through the $7 mark, it could potentially test higher levels at $8.03 and even $9.91.
Read More: How To Buy Render Token (RENDER) and Everything You Need To Know
When many holders are in the money at a certain price level, it often forms a resistance point, as they may sell to secure profits. Conversely, when a large portion of holders are out of the money at lower price levels, this forms support. That happens because fewer are willing to sell at a loss, limiting downward pressure.
On the downside, RNDR price support levels appear weaker. If the price drops to $6.03, it could retrace further, potentially sliding to $5.54 or even below $5. This suggests that RNDR has stronger barriers to overcome on the upside than it does on the downside.
Disclaimer
In line with the Trust Project guidelines, this price analysis article is for informational purposes only and should not be considered financial or investment advice. BeInCrypto is committed to accurate, unbiased reporting, but market conditions are subject to change without notice. Always conduct your own research and consult with a professional before making any financial decisions. Please note that our Terms and Conditions, Privacy Policy, and Disclaimers have been updated.