

The value of Artificial Superintelligence Alliance (FET) has consistently declined since May. The altcoin’s price had trended within a descending channel, which it broke below on August 3.
As of this writing, FET trades at $0.82, having witnessed a 29% price decline over the past 30 days.
Is Now a Good Time to Buy Artificial Superintelligence Alliance?
FET’s market value to realized value (MVRV) ratios assessed over different moving averages have flashed buy signals for traders looking to buy the dips. According to Santiment, the token’s 30-day and 365-day MVRV ratios are -22.95 and -99.80, respectively.
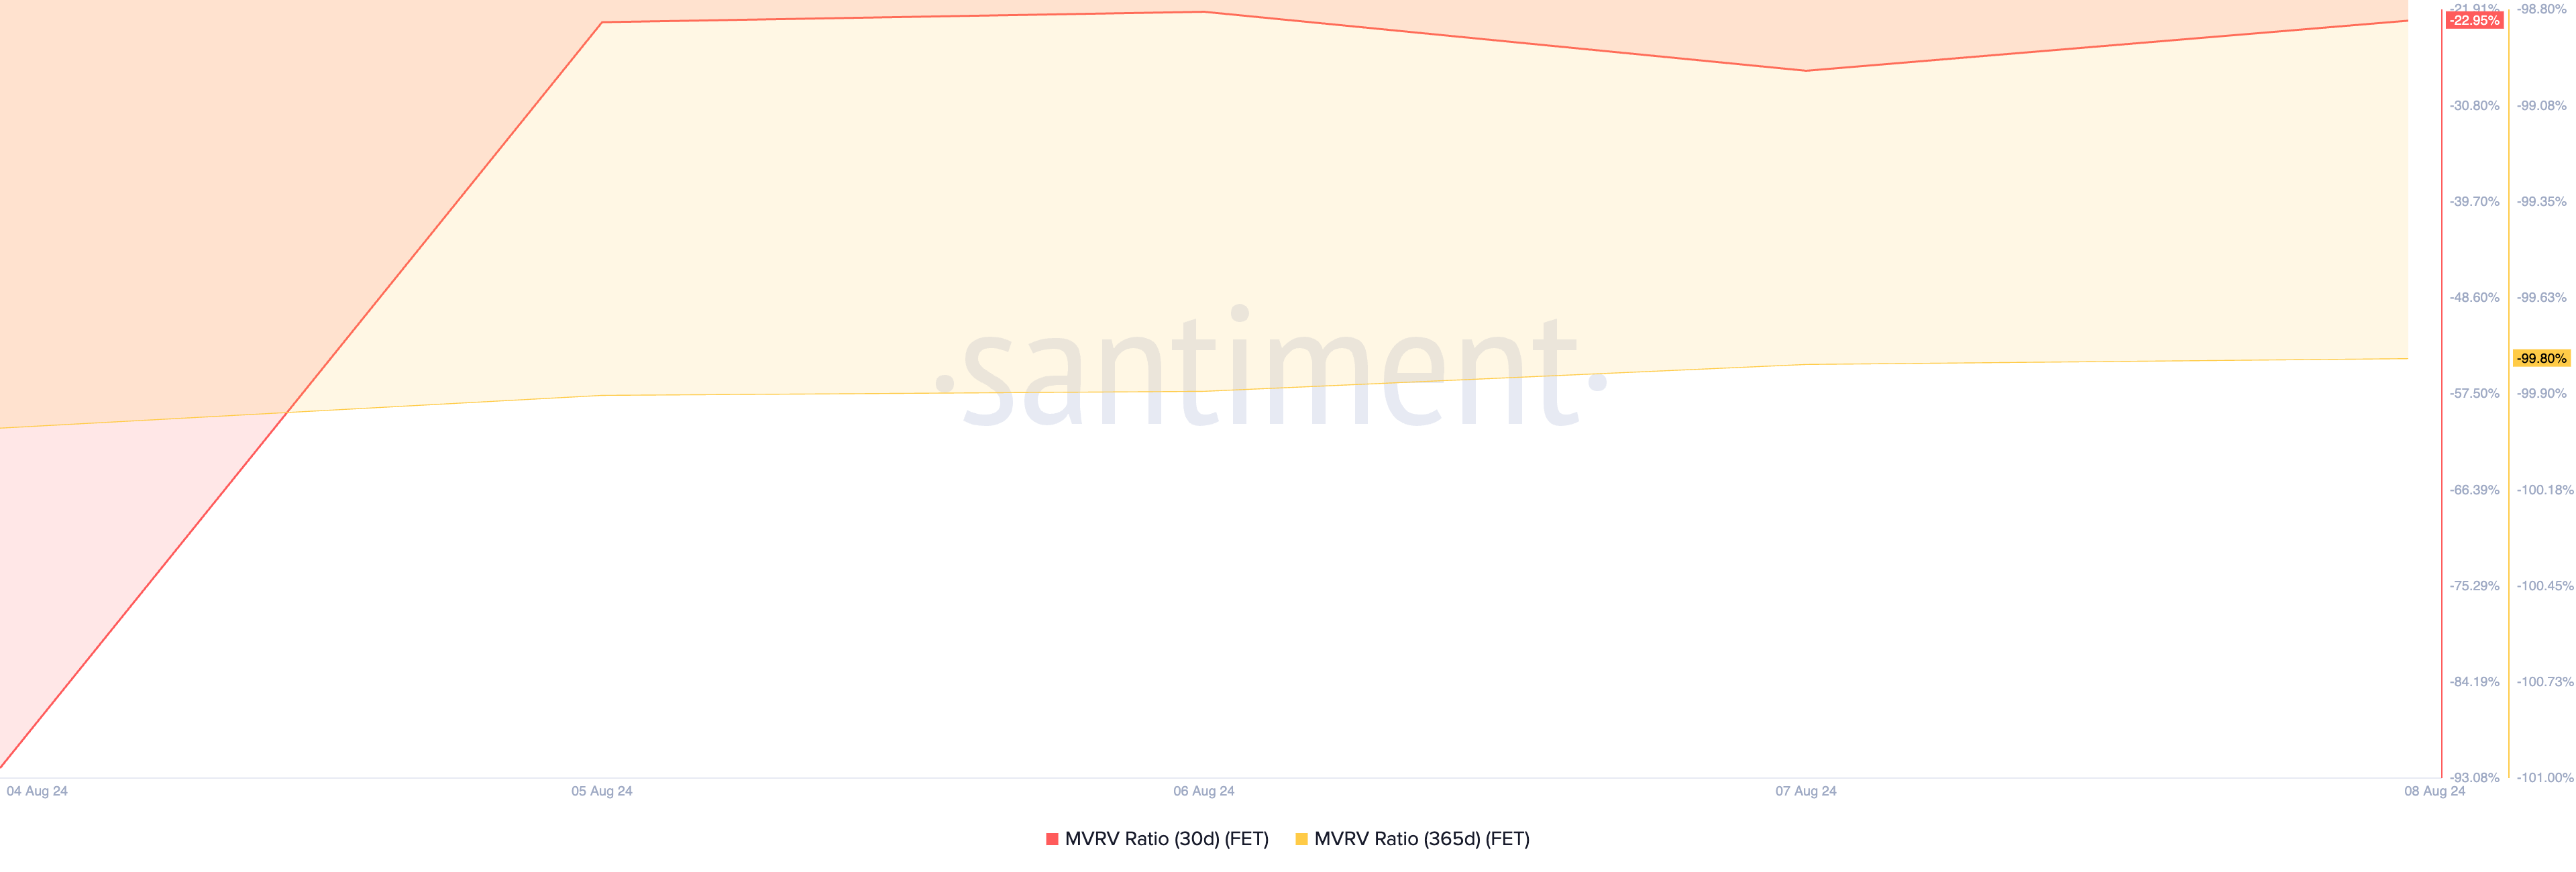
This metric measures the ratio between an asset’s current market price and the average price of its coins or tokens in circulation.
An MVRV ratio above one indicates that the asset trades at a price higher than the average acquisition cost of its circulating supply. When this happens, the asset is deemed overvalued, and holders can sell for profit.
On the other hand, when an asset’s MVRV ratio is below zero, it is undervalued. Its current price is lower than the average price of all its tokens in circulation, presenting an opportunity for those looking to “buy the dip.”
However, caution is advised as FET appears poised to fall further. For one, it trades below the long-term support level of $1.10.
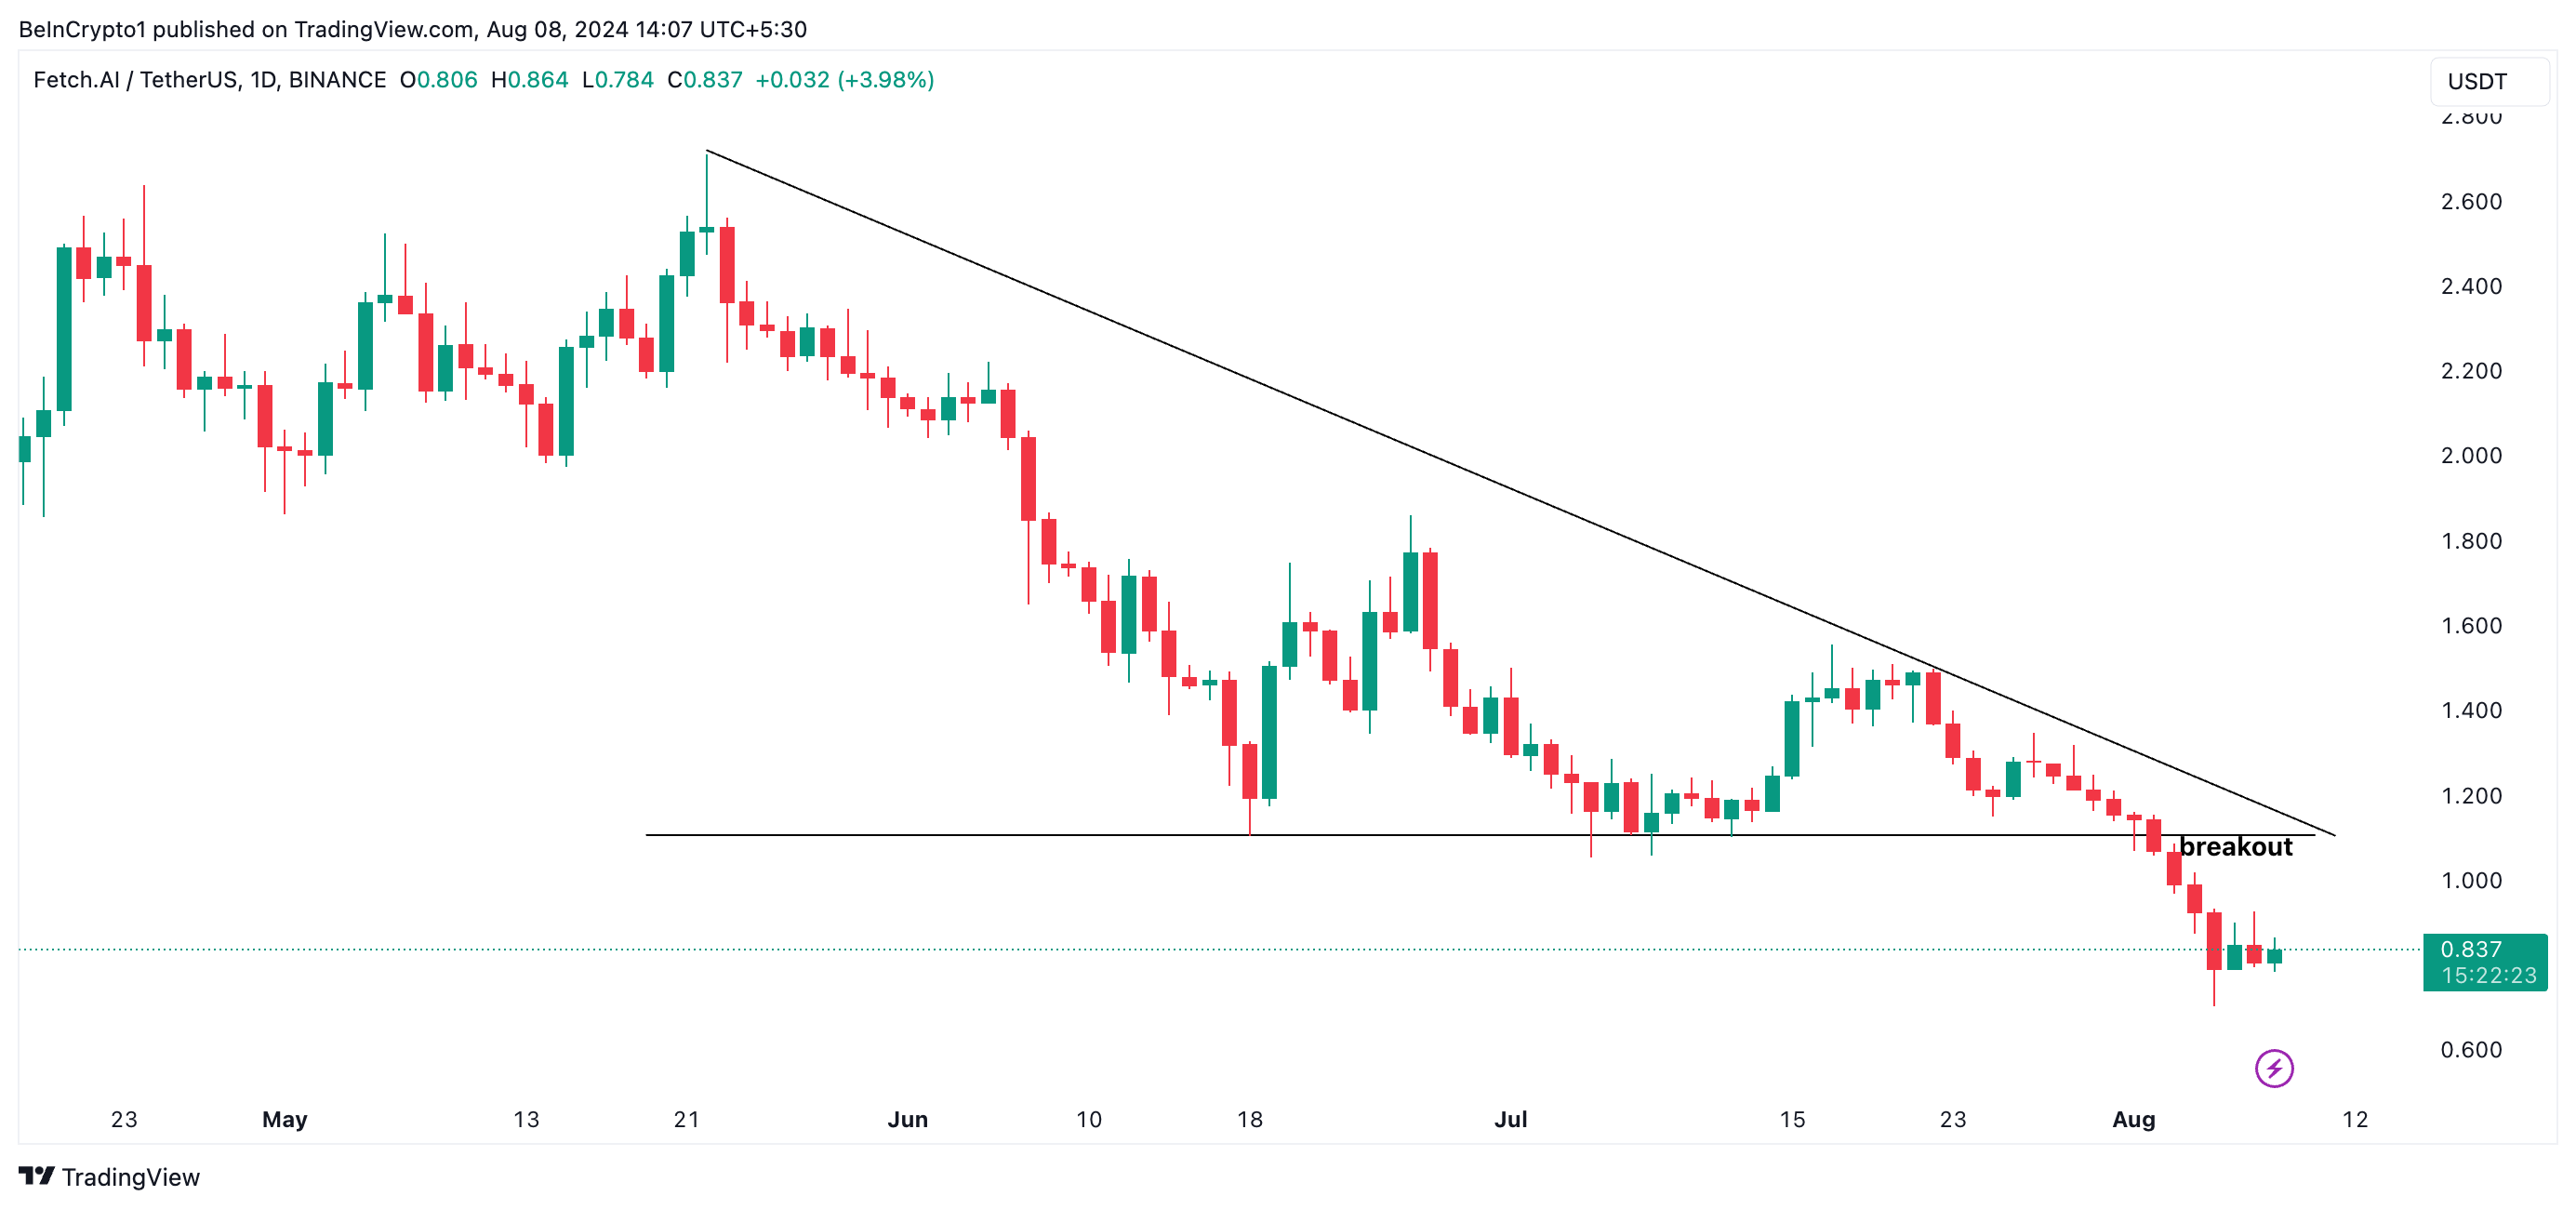
When an asset’s price falls below the support level of its descending triangle pattern, it typically signals a bearish breakout. This suggests that the selling pressure has overcome the buying support, often leading to further price declines.
The negative readings from the token’s Moving Average Convergence/Divergence (MACD) confirm its weakening demand and the likelihood of an extended price decline. As of this writing, FET’s MACD line (blue) rests below its signal (orange) and zero lines.
Read more: Top 9 Artificial Intelligence (AI) Cryptocurrencies in 2024
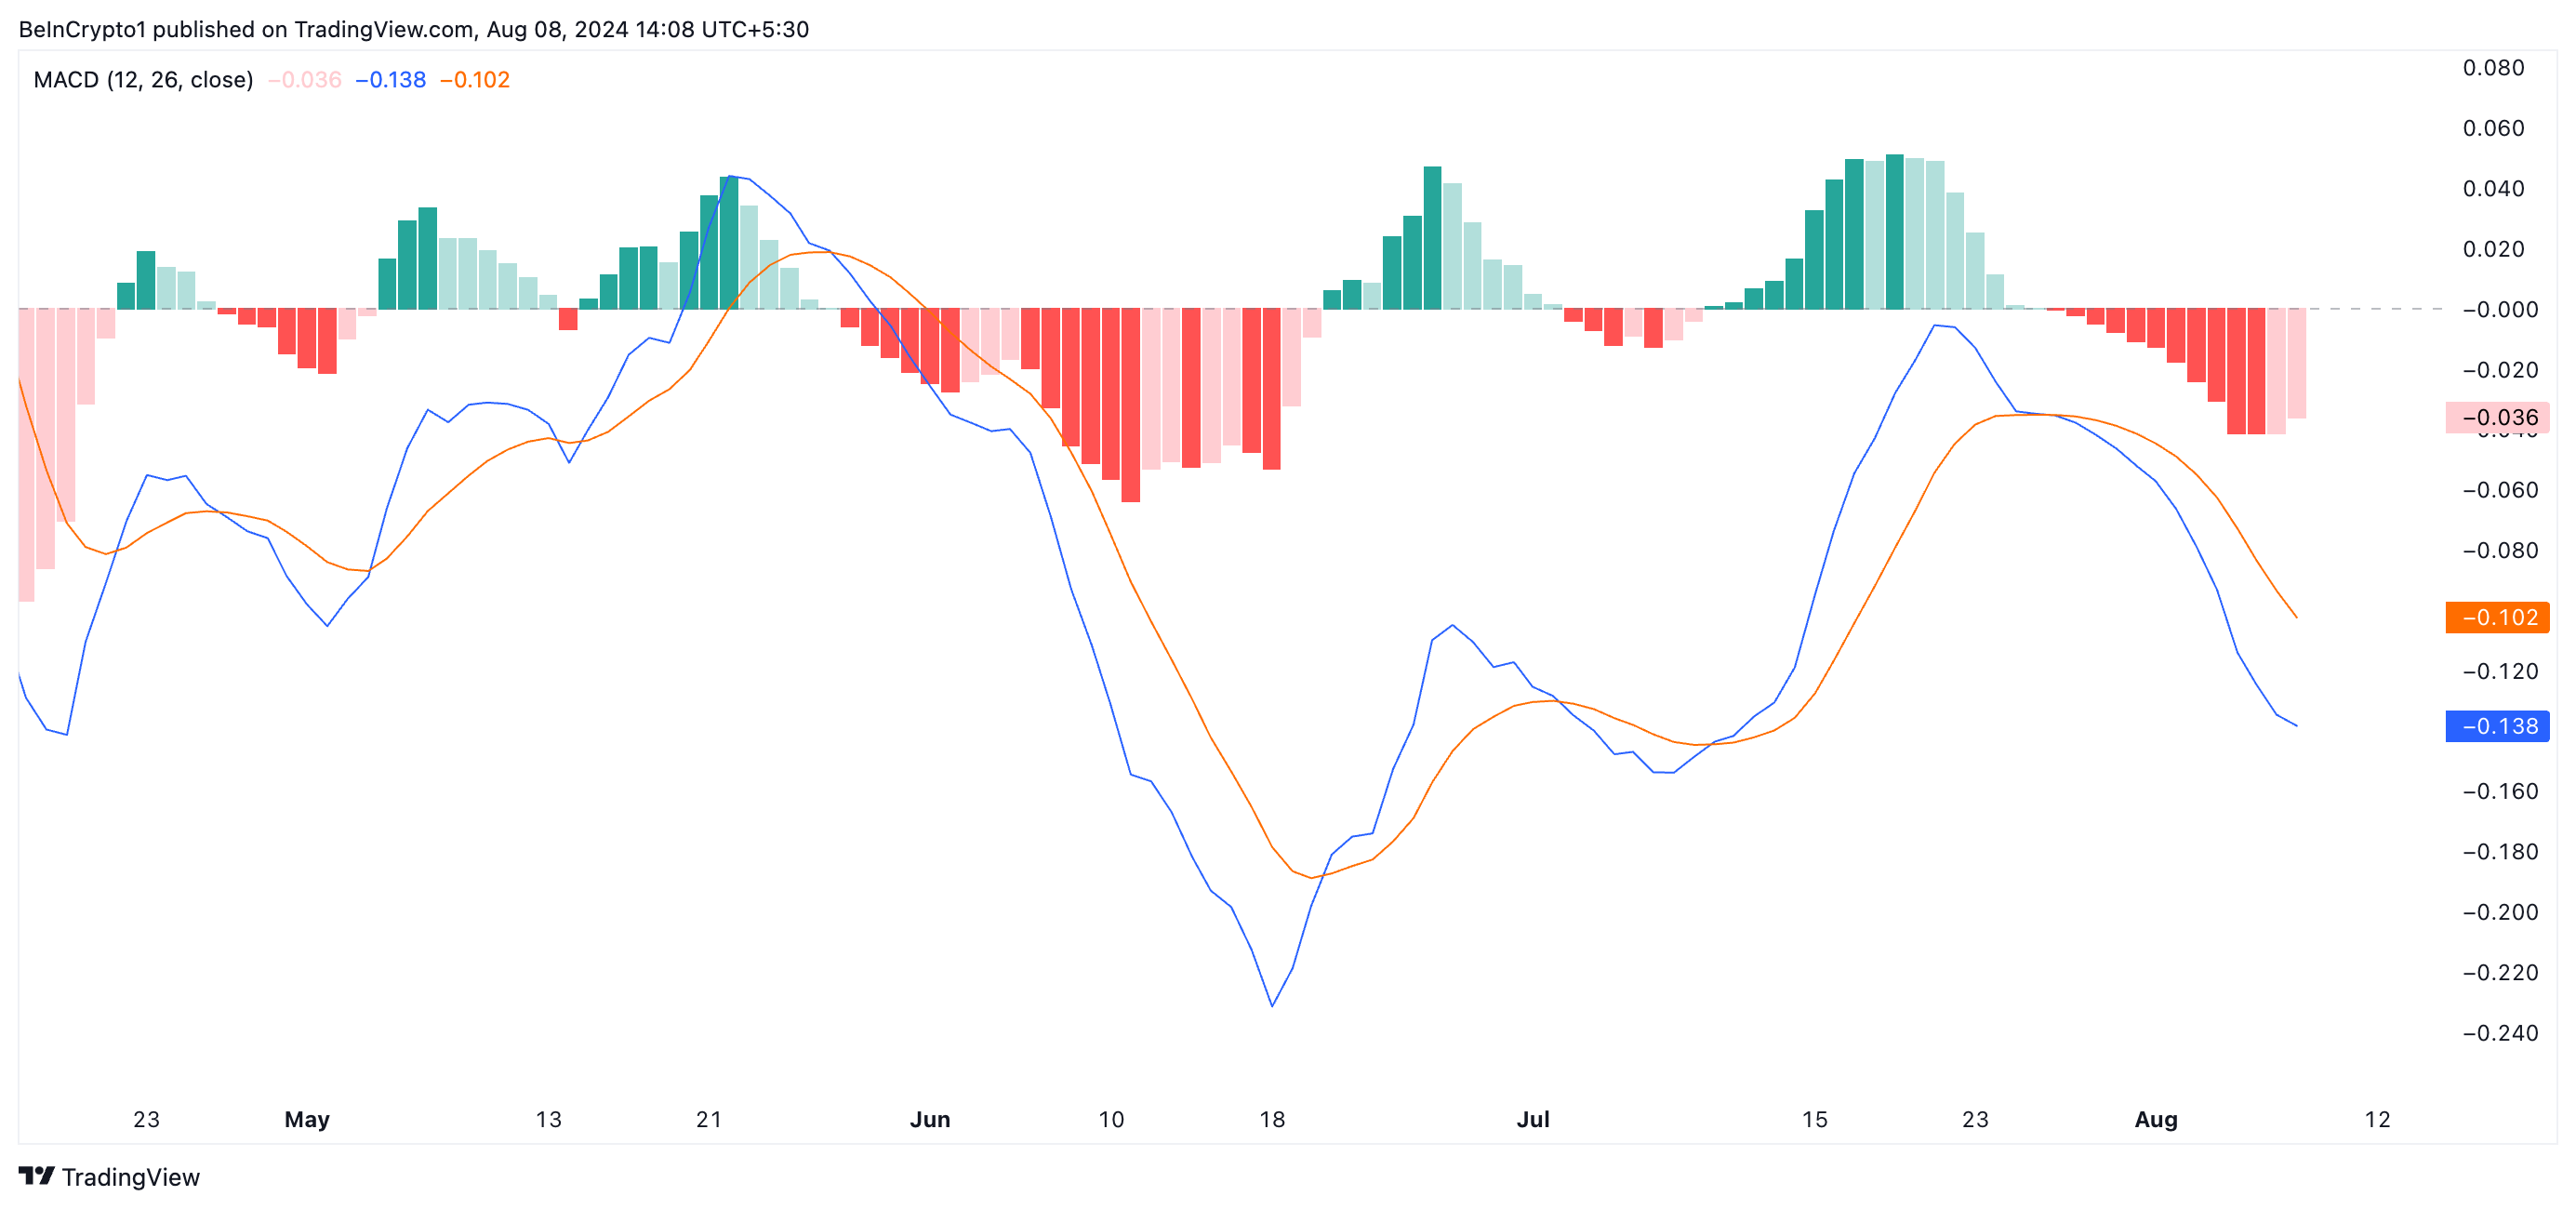
The MACD indicator measures the changes in an asset’s price trend, direction, and momentum. When the MACD line falls below the signal and zero lines, the asset’s price is under significant bearish influence and is experiencing a strong downtrend.
FET Price Prediction: More Losses Lie Ahead
While FET’s MVRV ratio may have flashed a buy signal, traders looking to trade against the current market trend must know that its price is at risk of falling further. If selling pressure remains high, FET may revisit its multi-month low of $0.70.
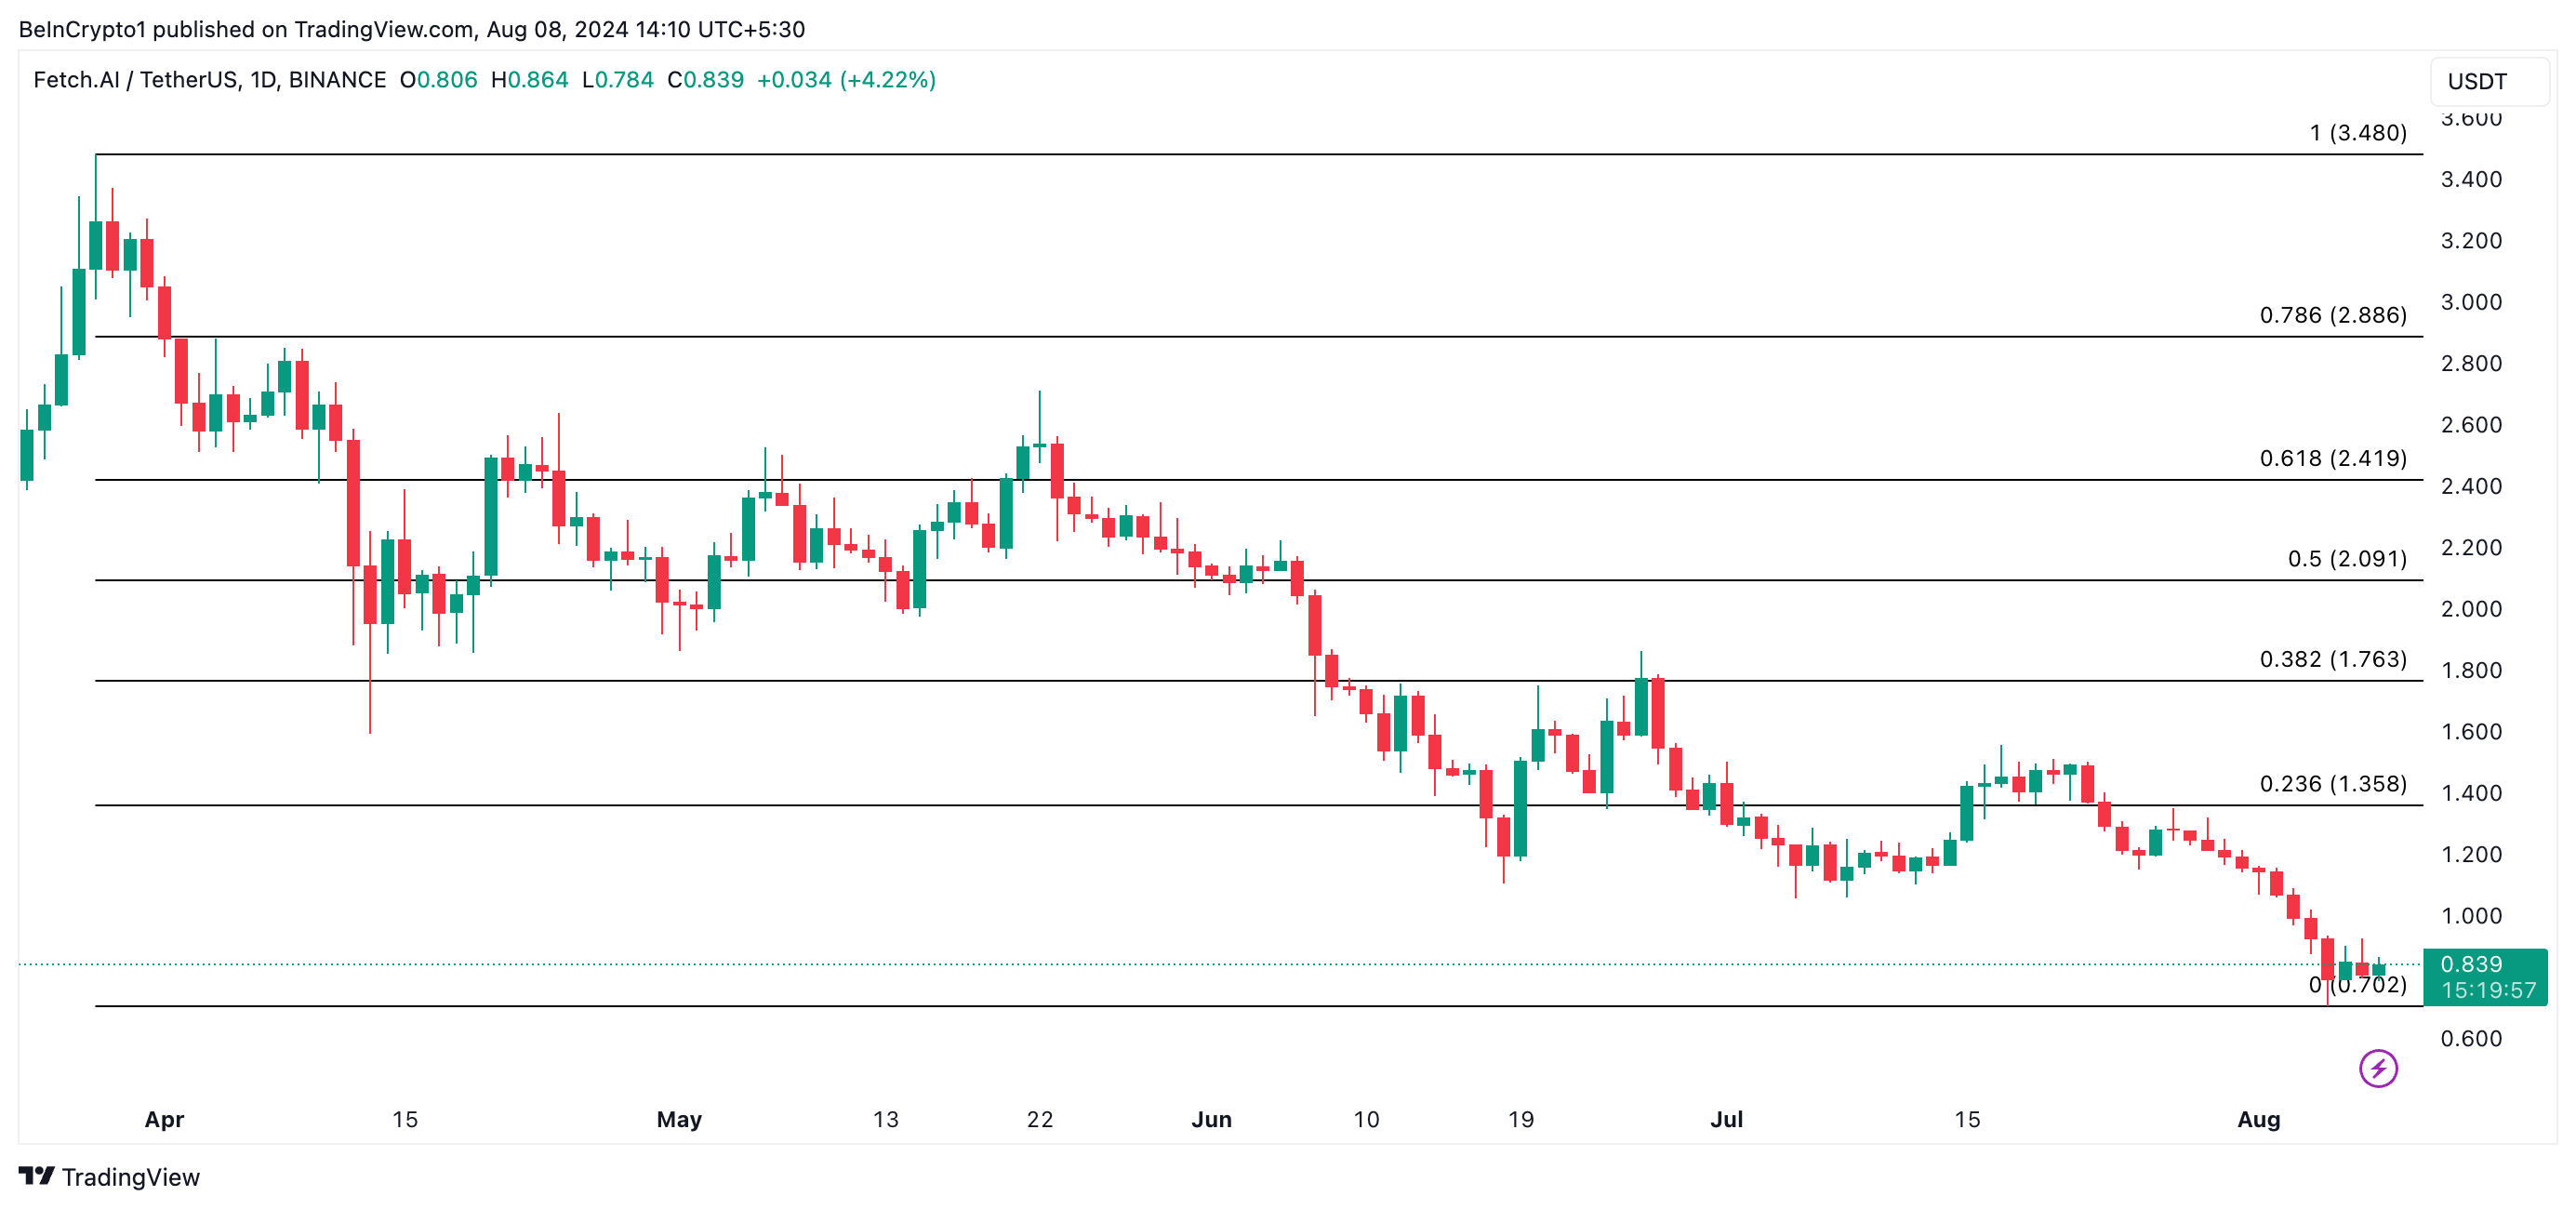
However, if demand for the altcoin surges, its price may climb to $1.34.
Disclaimer
In line with the Trust Project guidelines, this price analysis article is for informational purposes only and should not be considered financial or investment advice. BeInCrypto is committed to accurate, unbiased reporting, but market conditions are subject to change without notice. Always conduct your own research and consult with a professional before making any financial decisions. Please note that our Terms and Conditions, Privacy Policy, and Disclaimers have been updated.