
In this analysis, we’ll examine recent price movements and emphasize the significance of the $10 price threshold.
In this analysis, we’ll examine recent price movements, emphasizing the significance of the ten-dollar price threshold.
Render: 4H Price Analysis
Render had been consolidating within a narrow trading range characterized by low volatility. The 200 EMA (in Green) on the 4-hour chart was a crucial support level during this period.
Meanwhile, the 100 EMA (in Blue) on the 4-hour chart, in conjunction with the Baseline of the 4-hour Ichimoku cloud, had served as significant resistance for the past week.
However, yesterday, RNDR’s price broke above this resistance, surging upwards and penetrating the Ichimoku cloud. It tested the cloud’s upper boundary, positioned at $10.8.
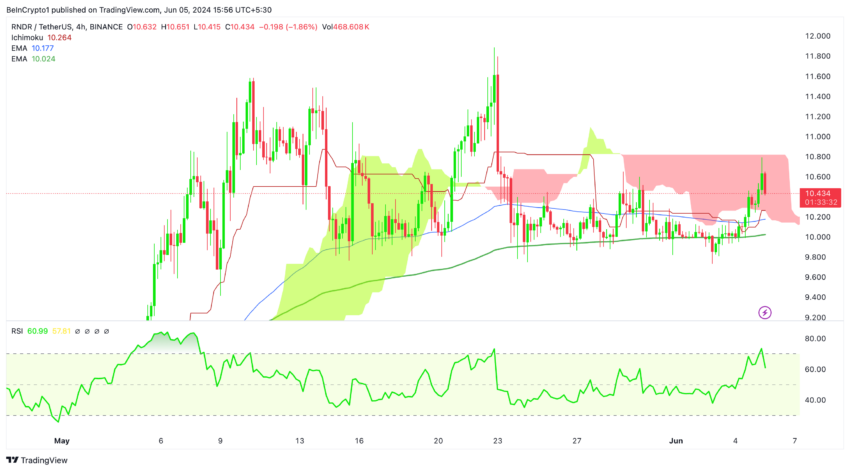
The price level of $10.8 may serve as a significant resistance barrier. A breakout beyond this level would promptly propel the price into the range of $11.3 to $11.5.
Read More: Render Token (RNDR): A Guide to What It Is and How It Works
In the recent analysis by BeInCrypto, emphasis was placed on the significance of monitoring the $10.2 price level for RNDR as critical resistance. The analysis also questioned whether the price would continue its upward trajectory to encounter further resistance at $11.3.
It was suggested that if Bitcoin’s price were to continue rising to the range of $72,000 to $73,000, RNDR would likely surpass the $11.3 price level.
On the 4-hour chart, the RSI had climbed to 70 when the price was trading near the $10.8 resistance level, but it’s now declining. This suggests a potential correction is underway.
If RNDR were to exit the cloud to the downside, it would likely shift market sentiment, potentially leading to the price settling from $9.9 to $10.2.
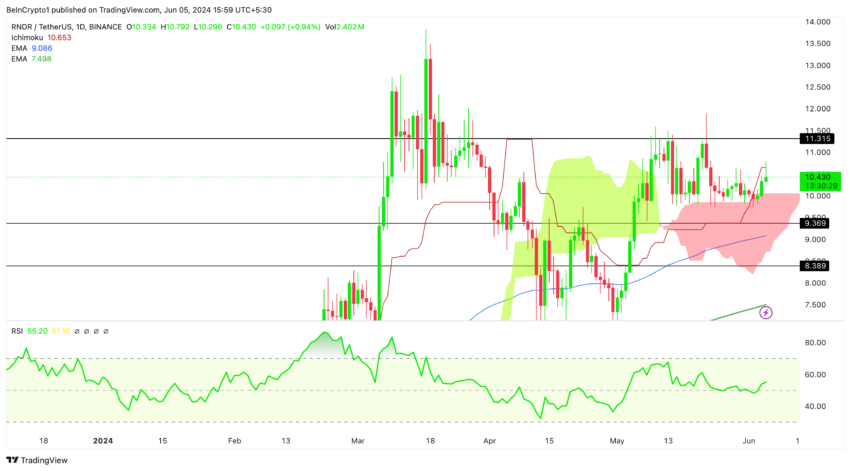
Render: Daily Price Analysis
The daily Ichimoku cloud has been a crucial support level, confirming this with a price rejection and suggesting bullish momentum will continue. Its upper boundary, standing firm at $10, provides strong mid-term support. Meanwhile, the red baseline (Red line) is a formidable resistance at $10.66.
Read More: Render Token (RNDR) Price Prediction 2024/2025/2030
Strategic Recommendations
Based on the analysis, consider closely monitoring the price action around the $10.8 resistance level. A breakout above this level could signal further upside potential towards $11.3 to $11.5.
Also, be prepared for a potential correction if Render exits the 4H cloud to the downside. Support is likely found in the $9.9 to $10.2 range.
Additionally, keep an eye on Bitcoin’s price movement, as it could influence RNDR’s trajectory, especially if Bitcoin continues to rise towards $72,000 to $73,000 in the midterm.
Disclaimer
In line with the Trust Project guidelines, this price analysis article is for informational purposes only and should not be considered financial or investment advice. BeInCrypto is committed to accurate, unbiased reporting, but market conditions are subject to change without notice. Always conduct your own research and consult with a professional before making any financial decisions. Please note that our Terms and Conditions, Privacy Policy, and Disclaimers have been updated.