March was a favorable month for BNB Coin, with the cryptocurrency achieving two new highs for the year within just a few days before experiencing a correction.
After a nearly two-week period of recovery, BNB Coin is showing signs of potentially reaching a new high in 2024. But is such a milestone achievable?
BNB Looks Promising
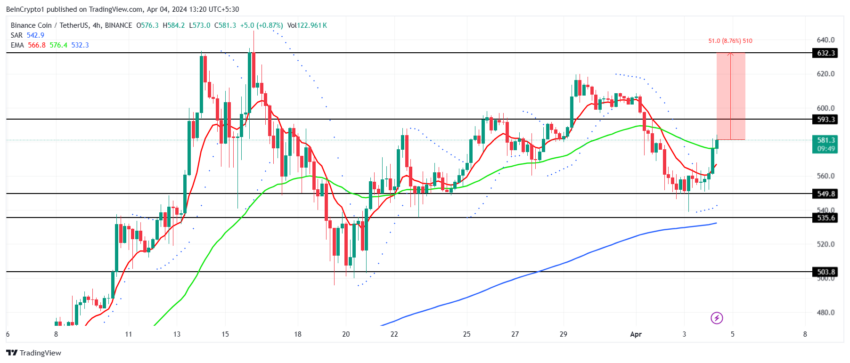
Following a rebound from the $550 support level, the value of BNB Coin has risen to $581 at the time of this analysis. This improvement reflects a recovery in the altcoin’s risk-return profile, which had been in a downtrend for several weeks.
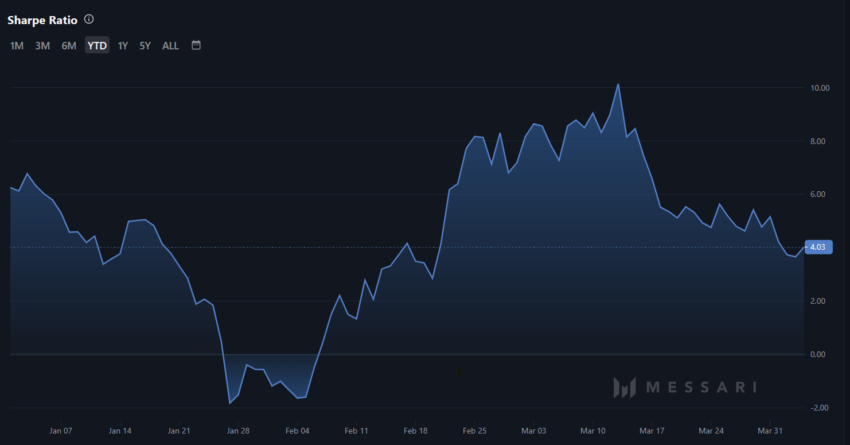
The Sharpe Ratio, a metric used to assess the risk-adjusted return of an investment by comparing its average return against its volatility, has recently shown an uptick toward 4.0 for BNB. This increase suggests that BNB’s risk-adjusted returns are sufficiently attractive to draw new investors to the asset potentially.

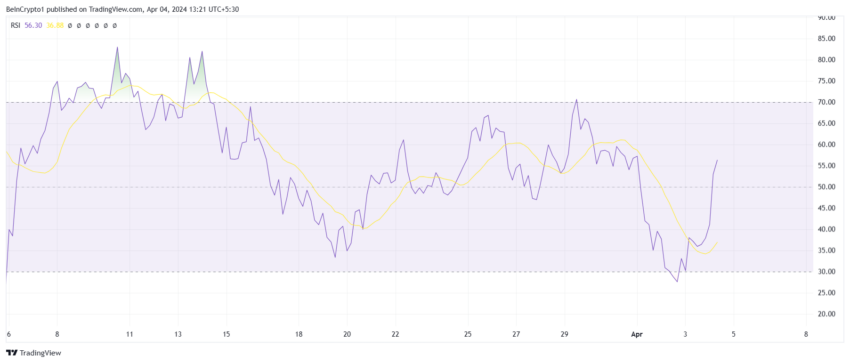
Moreover, the Relative Strength Index (RSI) for BNB has re-entered the bullish territory. The RSI is a momentum oscillator that measures the velocity and magnitude of price movements, helping to identify overbought or oversold conditions.

Given that the RSI is well below the overbought level yet above the midpoint, there is an indication that BNB’s bullish momentum may be rekindled.
BNB Price Prediction: New Highs
BNB is approaching the $593 resistance mark, surpassing this level could propel the cryptocurrency beyond $600. Should the conditions discussed hold true, BNB will likely experience a surge, potentially reaching $632, setting new highs for the year.
Read More: How To Buy BNB and Everything You Need To Know

However, the $593 level has historically been a significant resistance point on the 4-hour chart. Should BNB fail to overcome this barrier, a correction back to $549 could be in the cards.
A drop below this support level would negate the bullish forecast, leading to a further downturn.
Disclaimer
In line with the Trust Project guidelines, this price analysis article is for informational purposes only and should not be considered financial or investment advice. BeInCrypto is committed to accurate, unbiased reporting, but market conditions are subject to change without notice. Always conduct your own research and consult with a professional before making any financial decisions. Please note that our Terms and Conditions, Privacy Policy, and Disclaimers have been updated.


