


On June 26, 2019, the XRP (XRP) price reached a high of $0.494. A rapid decrease ensued. XRP traded inside a range between $0.38-$0.42 until July 10. Another rapid decrease ensued. XRP has been trading between $0.30 and $0.33 since.
 Will XRP break out of this trading range? In order to answer this question, we will analyze the XRP price in different time-frames alongside technical indicators.
For our previous analysis, click here.
If you are interested in trading XRP (XRP) with a multiplier of up to 100x on our new partner exchange with the lowest fees, follow this link to get a free StormGain account!
Will XRP break out of this trading range? In order to answer this question, we will analyze the XRP price in different time-frames alongside technical indicators.
For our previous analysis, click here.
If you are interested in trading XRP (XRP) with a multiplier of up to 100x on our new partner exchange with the lowest fees, follow this link to get a free StormGain account!
XRP Price: Trends and Highlights for July 29
- XRP/USD is trading inside a short-term descending triangle.
- It is also trading inside a long-term symmetrical triangle.
- Daily moving averages are close to making/rejecting a bullish cross.
- Price increases have been small relative to prior decreases.
Current Pattern
A look at the two-hour time-frame shows that XRP is following a descending resistance line. The line acted as support in the period from June 28 to July 10, before price broke down.
Afterward, the XRP Price increased and validated it as resistance on July 20 and 26.
Combined with a horizontal support line at $0.30 that has been in place since July 19, XRP creates a descending triangle.
The line acted as support in the period from June 28 to July 10, before price broke down.
Afterward, the XRP Price increased and validated it as resistance on July 20 and 26.
Combined with a horizontal support line at $0.30 that has been in place since July 19, XRP creates a descending triangle.
 The descending triangle is considered a bearish pattern, making price breakdowns more likely.
Will XRP break down?
The descending triangle is considered a bearish pattern, making price breakdowns more likely.
Will XRP break down?
Long-Term
A look at the weekly time-frame shows that the XRP Price has been trading inside a symmetrical triangle for the past 350 days, since August 2018.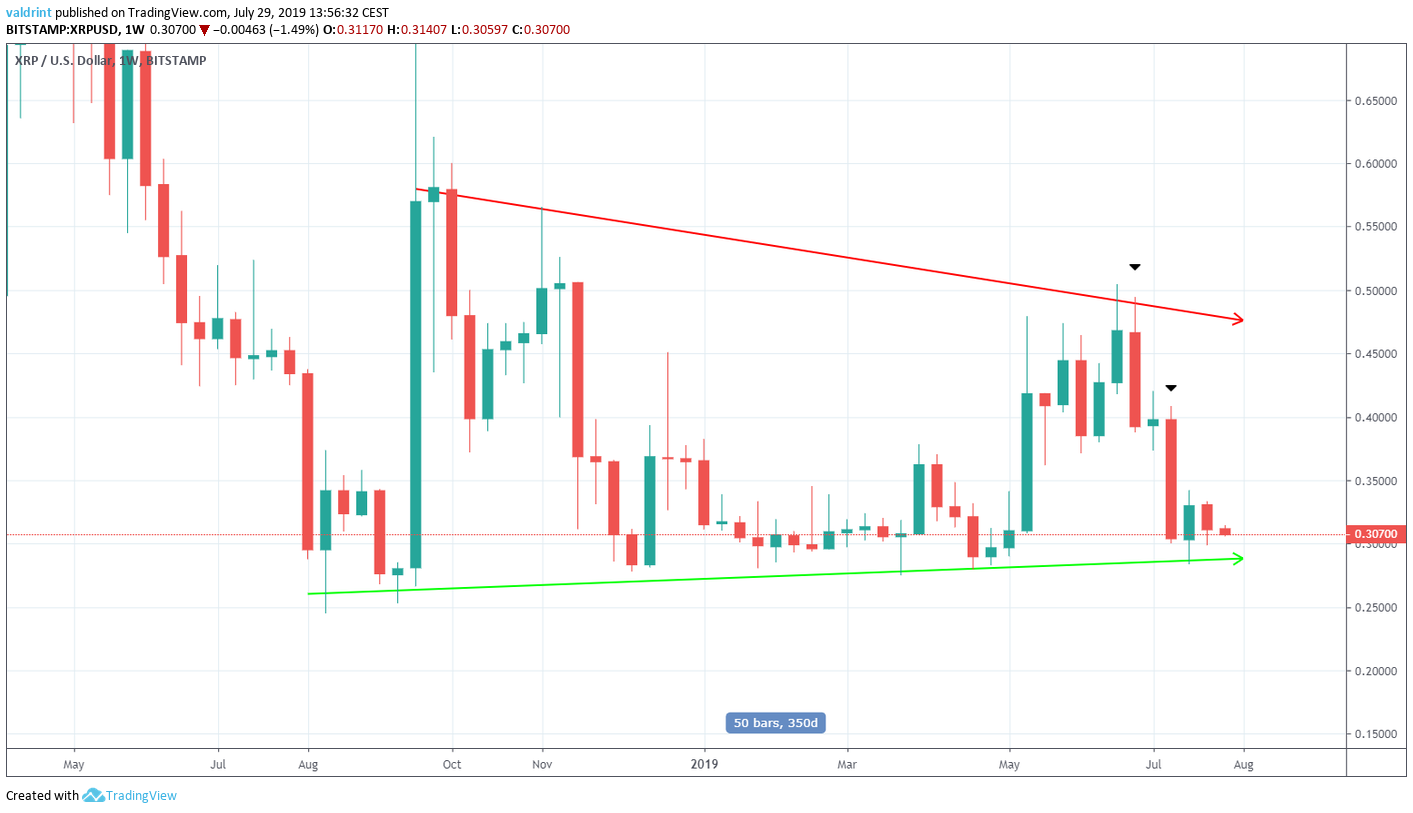 At the time of writing, it was trading very close to the support line of the triangle, as it has done for the majority of the time.
The price reached the resistance line at the end of June before a rapid decrease brought it down to the support line.
This is dissimilar to the previous movement from resistance to support, which was more gradual.
The current decrease was characterized by two bearish engulfing candlesticks, without any upward retracement.
A look at the daily chart shows that the price is in a critical position.
At the time of writing, it was trading very close to the support line of the triangle, as it has done for the majority of the time.
The price reached the resistance line at the end of June before a rapid decrease brought it down to the support line.
This is dissimilar to the previous movement from resistance to support, which was more gradual.
The current decrease was characterized by two bearish engulfing candlesticks, without any upward retracement.
A look at the daily chart shows that the price is in a critical position.
 The 10- and 20-day moving averages are approaching each other.
It is likely that soon either a bullish cross will occur or it will be rejected.
Since the price is trading below both MAs, and the 10-day MA has started to turn downward, a rejection seems more likely.
This view is supported by a lack of bullish divergence in momentum indicators.
Similar to the weekly time-frame, we can see that bullish candles have easily been contained inside the body of the previous bearish candle.
The 10- and 20-day moving averages are approaching each other.
It is likely that soon either a bullish cross will occur or it will be rejected.
Since the price is trading below both MAs, and the 10-day MA has started to turn downward, a rejection seems more likely.
This view is supported by a lack of bullish divergence in momentum indicators.
Similar to the weekly time-frame, we can see that bullish candles have easily been contained inside the body of the previous bearish candle.
 This has been especially visible with the candlestick for July 27.
The combination of these indicators and price movements makes us believe that the price will break down from the short-term descending triangle.
However, we do not believe the same will occur from the long-term symmetrical triangle.
To the contrary, we believe that the support line that has been in place for 350 days will not allow the price to break down.
This has been especially visible with the candlestick for July 27.
The combination of these indicators and price movements makes us believe that the price will break down from the short-term descending triangle.
However, we do not believe the same will occur from the long-term symmetrical triangle.
To the contrary, we believe that the support line that has been in place for 350 days will not allow the price to break down.
Future Movement
If the XRP price breaks down, a possible outline of future movement is shown below. The price is likely to undergo a small decrease, and reach the support line of the long-term triangle at $0.29.
Summary
The XRP price is trading inside a bearish short-term pattern and a neutral long-term one. The long-term outlook is bearish. According to our analysis, XRP will break down from the short-term triangle and reach the support line which is currently at $0.29. Do you believe XRP will break down from the triangle? Let us know in the comments below.Disclaimer: This article is not trading advice and should not be construed as such. Always consult a trained financial professional before investing in cryptocurrencies, as the market is particularly volatile. Images are courtesy of TradingView and Shutterstock.