The Altcoin Market Cap (TOTAL2) fell sharply this week, losing most of the gains from the previous one.
Despite this decrease, its bullish structure remains intact in both the horizontal and diagonal levels. Will TOTAL2 be able to regain its momentum and again spark hope for another altcoin season?
Altcoin Season Stumbles at First Roadblock
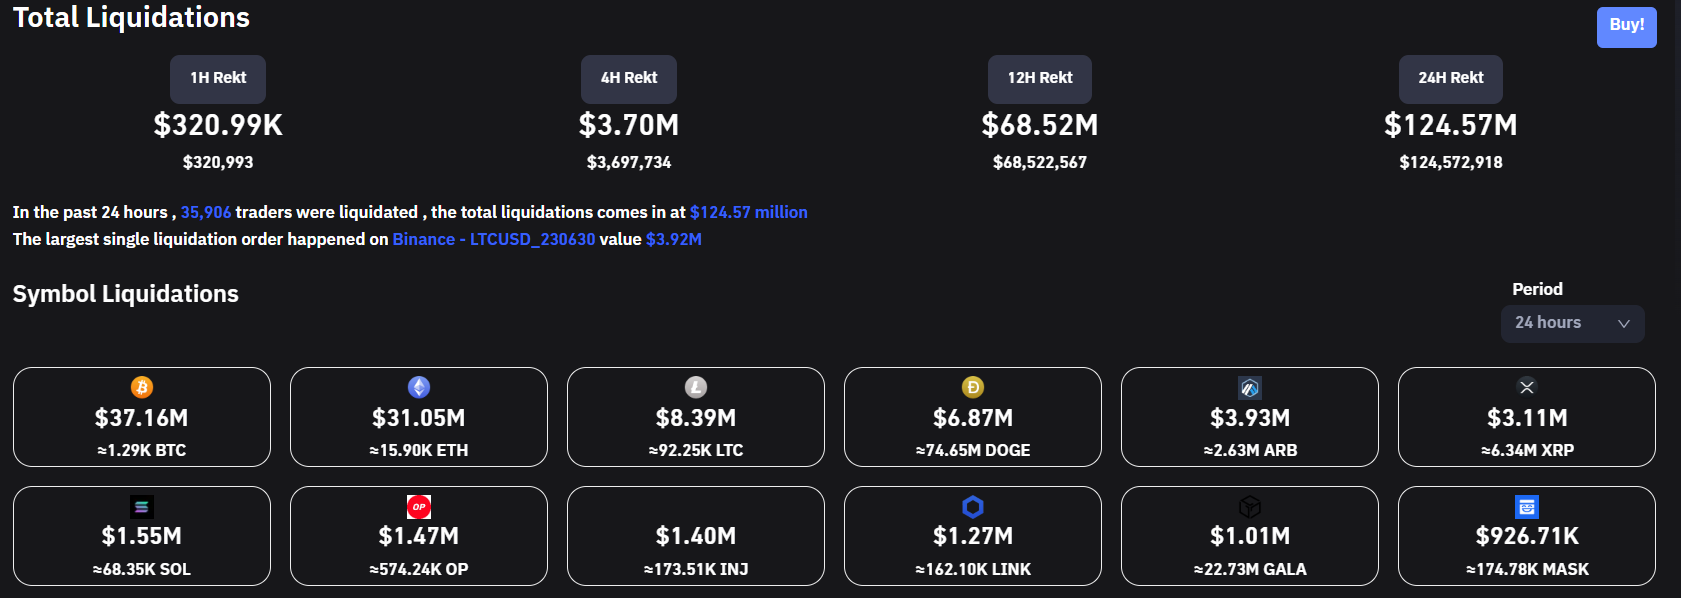
The recent bullish rally appears to have come to a halt. The recent market conditions saw bitcoin reaching a new yearly high, as well as ethereum, coupled with gains across the board on altcoins. Signaling the beginning of a possible altcoin season as bitcoin cooled off. However, steep corrections across the board have seen over $124 million in liquidations. Could this have a larger impact on a possible altcoin rally?

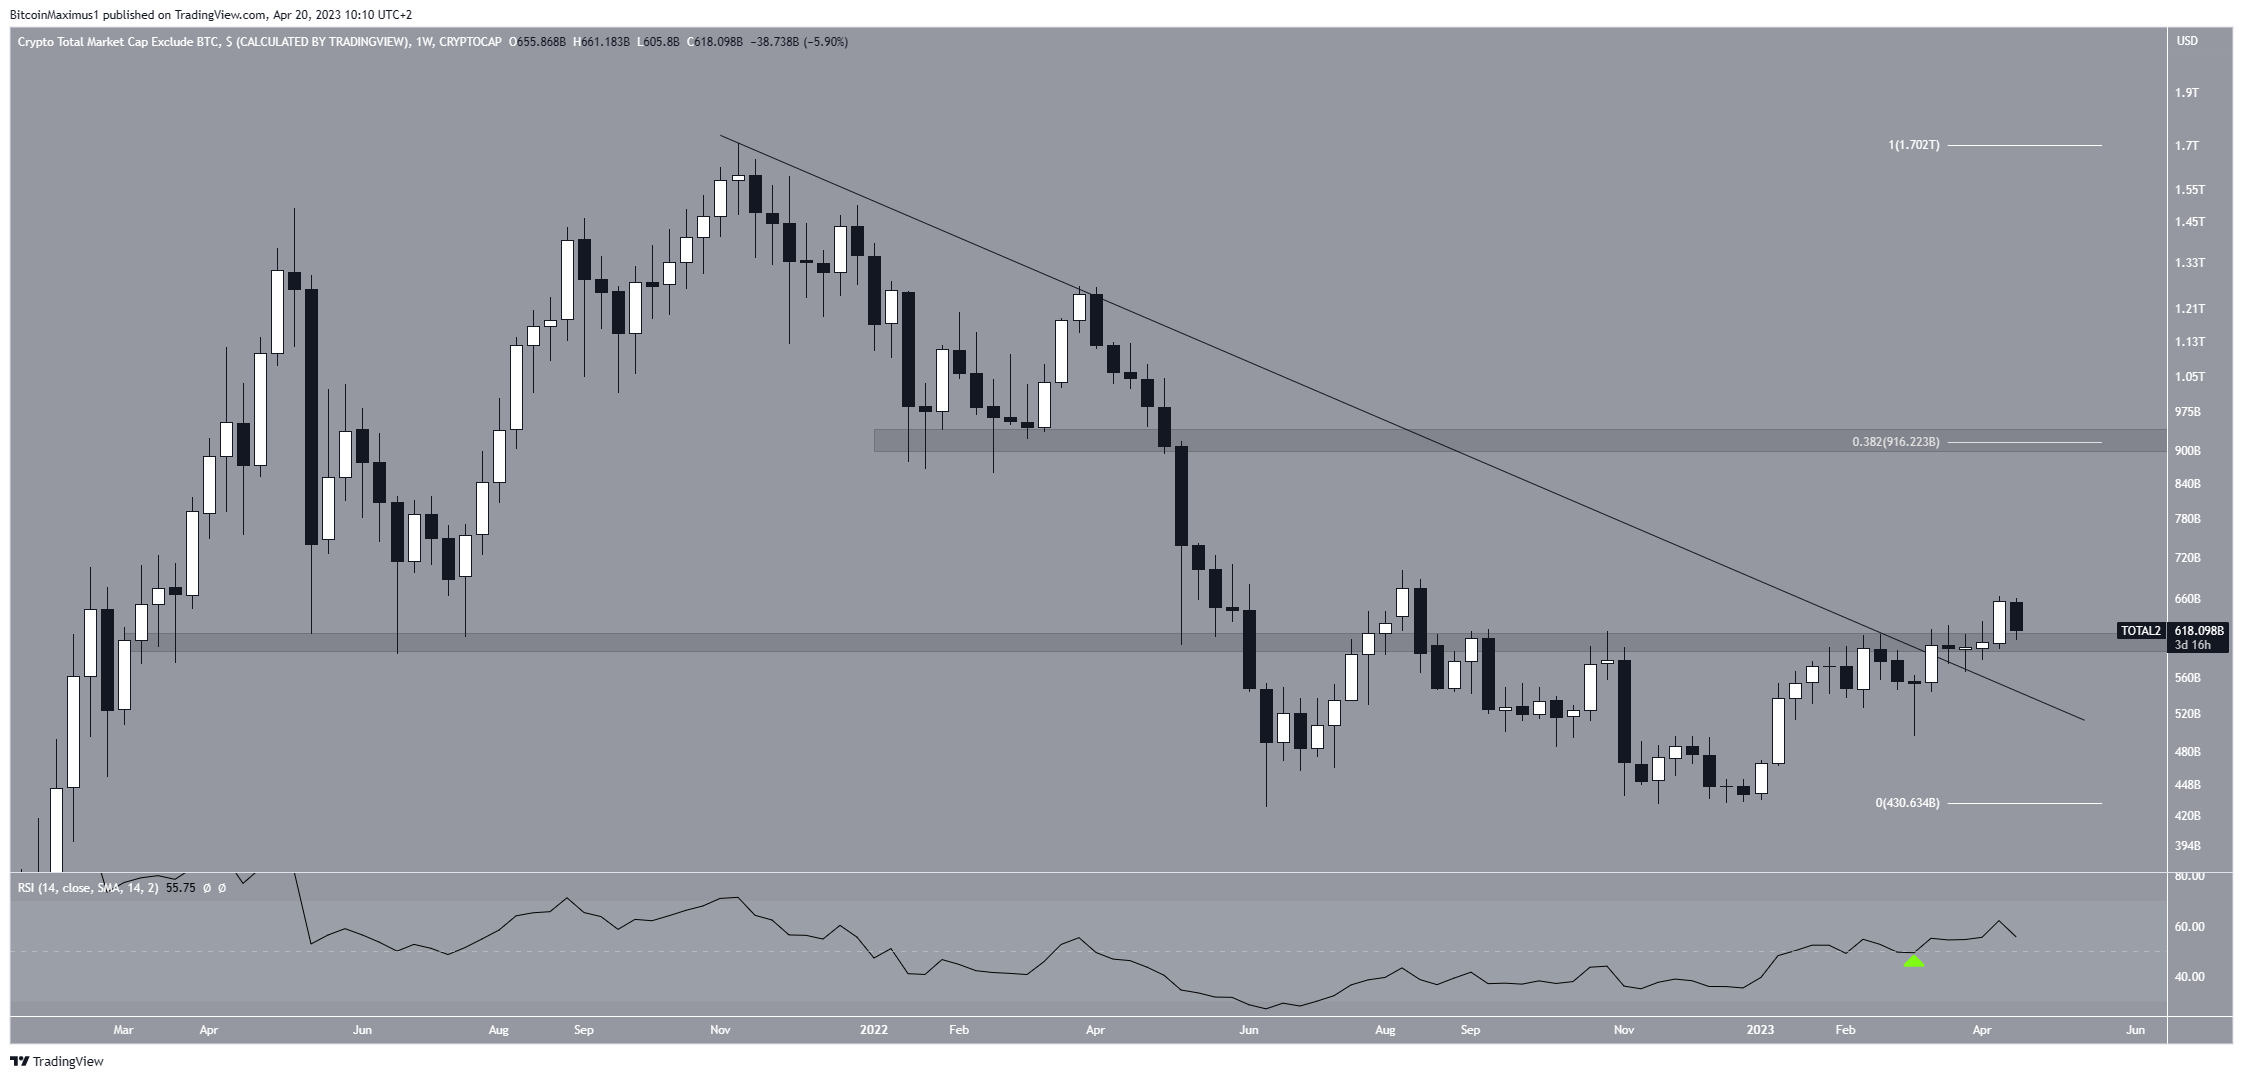
The Altcoin Market Cap increased sharply during the week of April 10-17. While doing so, it confirmed the breakout from a long-term descending resistance line that had been in place since the all-time high, and the $605 billion horizontal resistance area.
While TOTAL2 was trading below these levels, the trend was considered bearish. However, after moving above them, it is possible that bulls have regained the upper hand, and a new bullish reversal has begun. Both the previous resistance line and $605 billion area are now expected to provide support.

Besides the price action, the weekly Relative Strength Index (RSI) also provides a bullish reading. An upward trend and a reading above 50 suggest that the bull market is ongoing. The indicator moved above 50 at the beginning of March (green icon).
The Relative Strength Index (RSI) is a momentum indicator that evaluates the speed and magnitude of an asset’s recent price changes, offering insights into overvalued or undervalued conditions. Traders leverage RSI to make informed decisions about buying or selling these assets, based on its assessment of a crypto’s price momentum.
If the increase continues, the next resistance will be at $916 billion.
Altcoin Market Cap Price Prediction: Will Price Regain Footing?
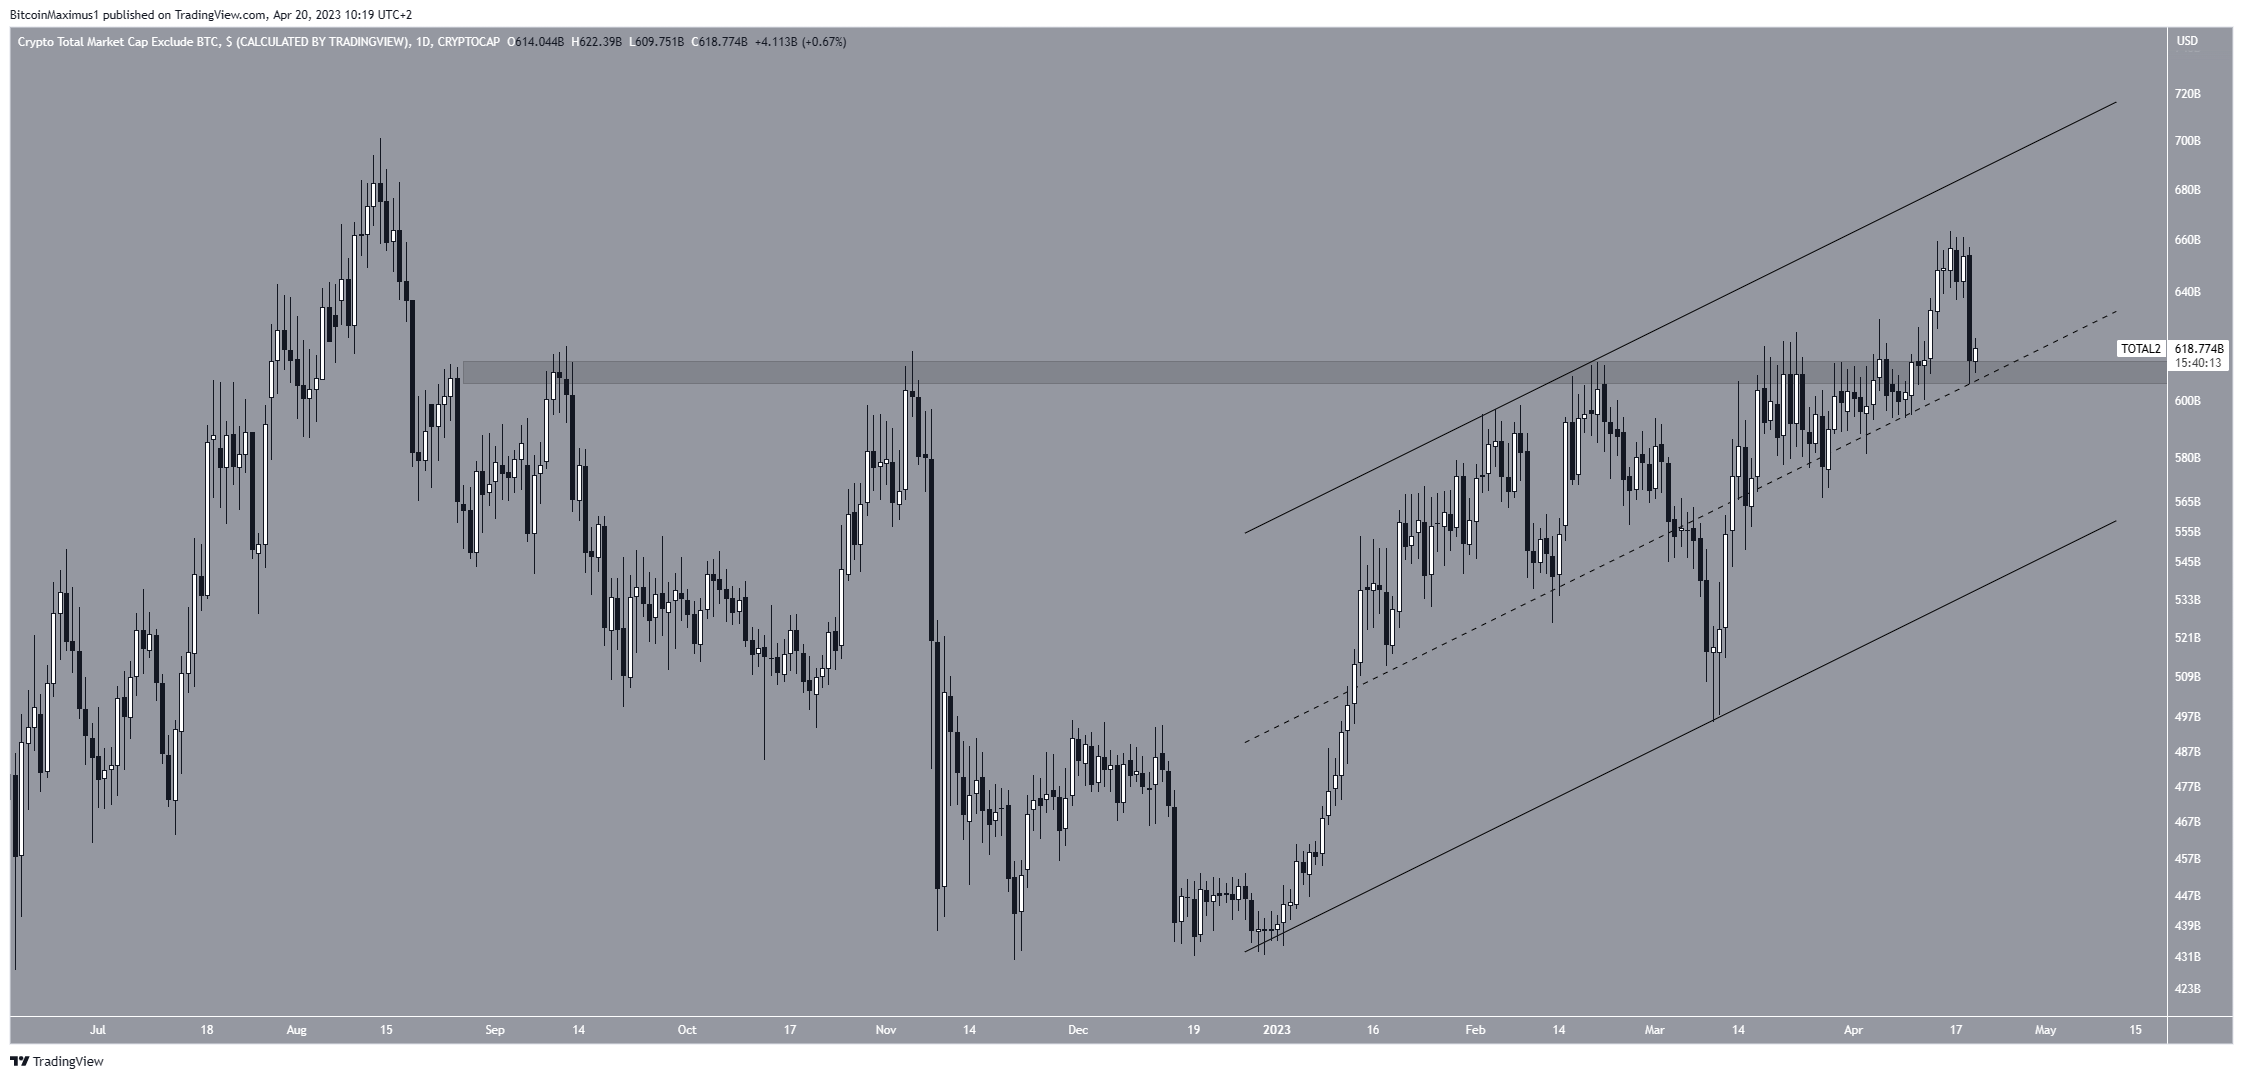
The technical analysis from the daily time frame aligns with the readings from the weekly one. The price is currently retesting the main horizontal support area, which in the daily time frame is at $610 billion.
Moreover, it is bouncing at the support line of an ascending parallel channel. When such channels contain price movements, numerous touches of both the resistance and support lines are expected.
Since the price now trades above the channel’s midline, an increase toward its resistance line is expected. The channel’s resistance line is at an average price of $720 billion.

Despite these bullish readings, a close below the $605 billion support area could trigger a sharp fall toward the channel’s support line at $560 billion.
For BeInCrypto’s latest crypto market analysis, click here.
Disclaimer
In line with the Trust Project guidelines, this price analysis article is for informational purposes only and should not be considered financial or investment advice. BeInCrypto is committed to accurate, unbiased reporting, but market conditions are subject to change without notice. Always conduct your own research and consult with a professional before making any financial decisions. Please note that our Terms and Conditions, Privacy Policy, and Disclaimers have been updated.


