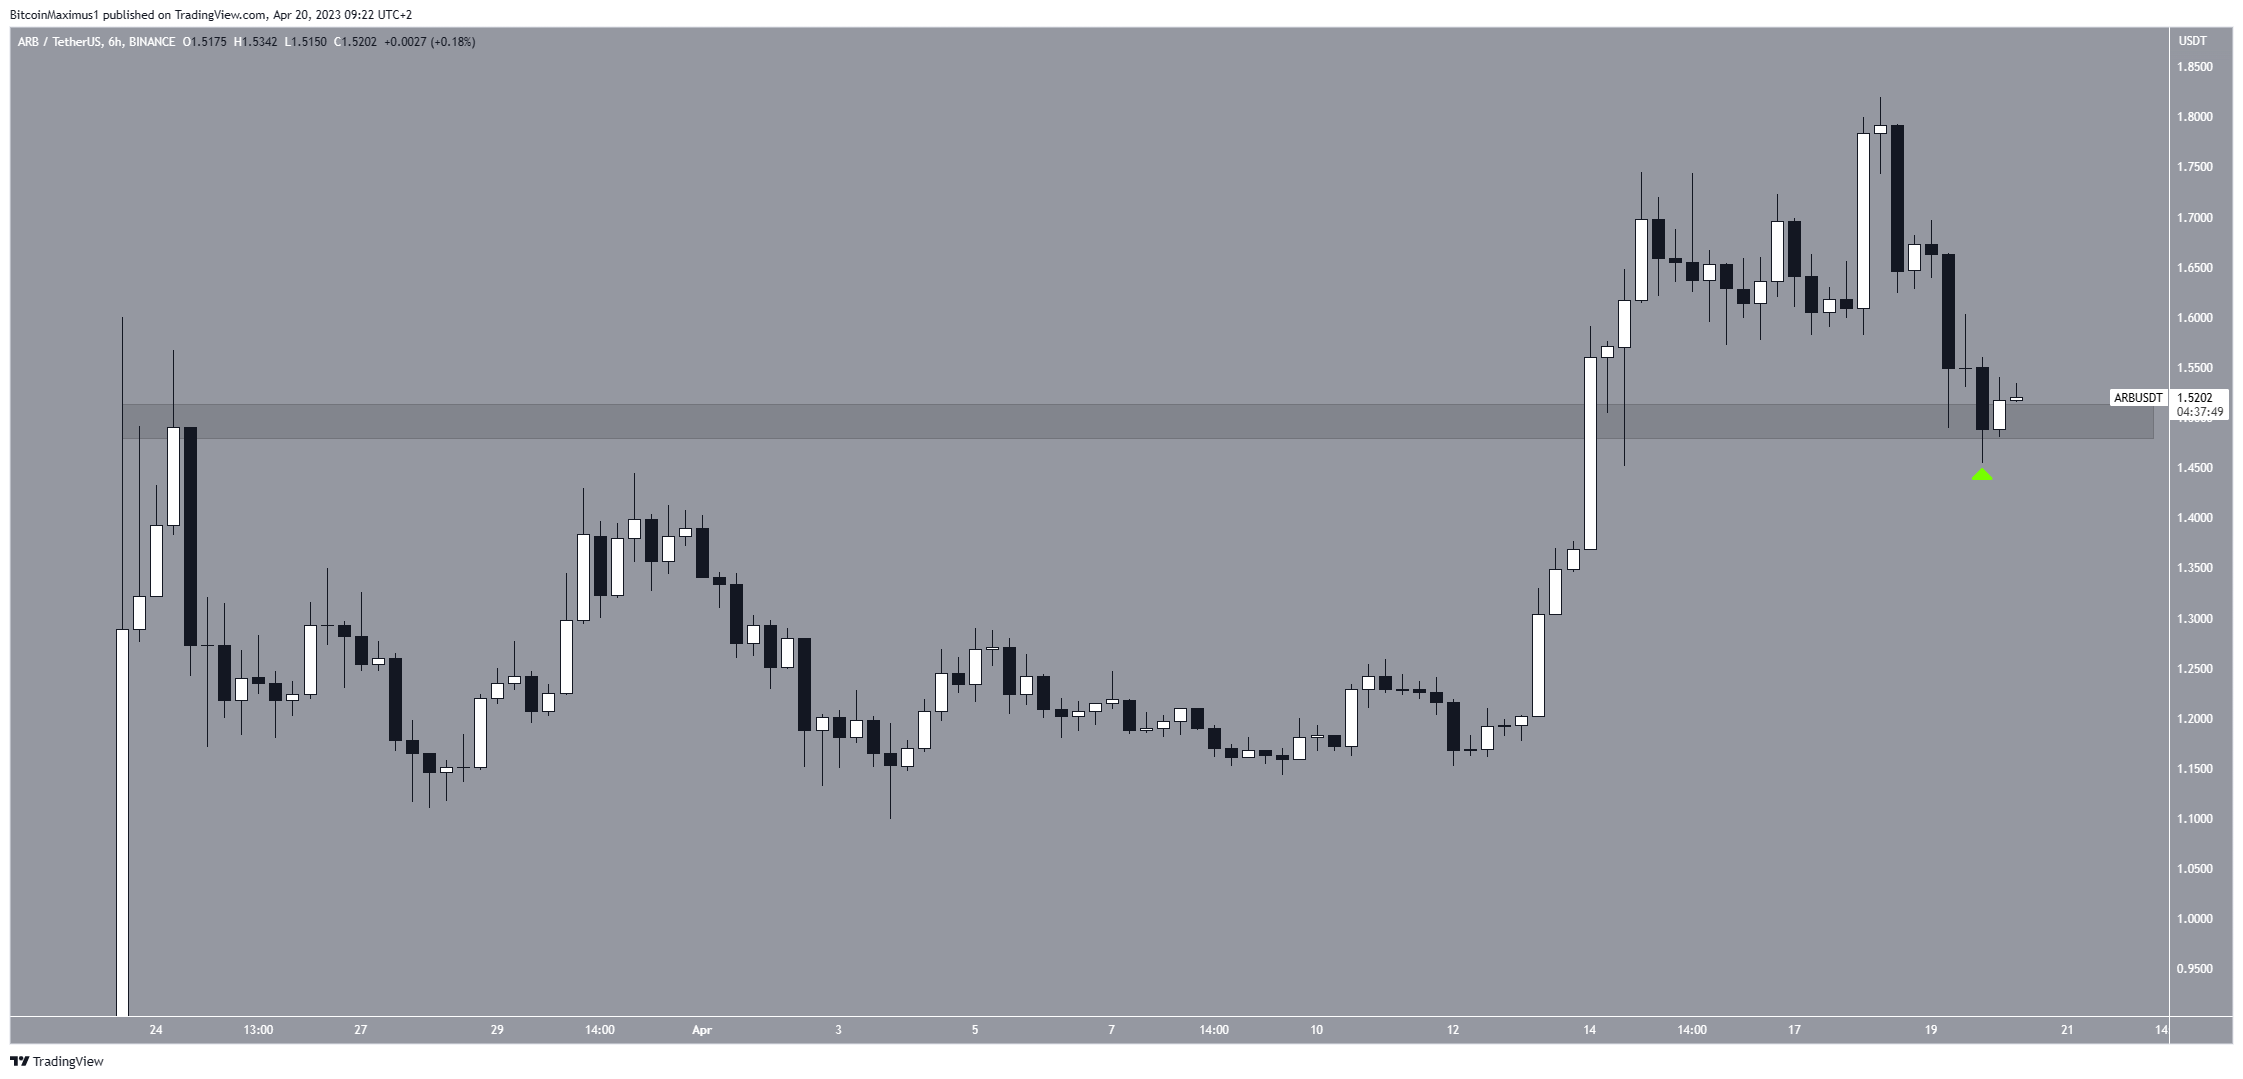
Despite reaching a new all-time high on April 18, the Arbitrum (ARB) price fell sharply on April 18. It is now attempting to find support and regain its footing.
Despite this decrease, the ARB price still trades above an important horizontal support area. Moreover, the wave count indicates that the trend is still bullish. Could ARB retest its recent high once again?
Arbitrum Price Falls After All-Time High
On April 14, the ARB price broke out from the $1.50 horizontal resistance area and reached a new all-time high of $1.82 four days later. After a breakout, the same horizontal level that previously provided resistance is expected to provide support.
This is what happened with the ARB price on April 19. After a sharp fall, the price bounced at the $1.50 horizontal area, validating it as support (green icon).

Additionally, the long lower wick created means that buyers stepped in at the $1.50 area and pushed the price upward. Therefore, the trend can be considered bullish as long as the price does not close below $1.50.
ARB Price Prediction: Is a New All-Time High on the Cards?
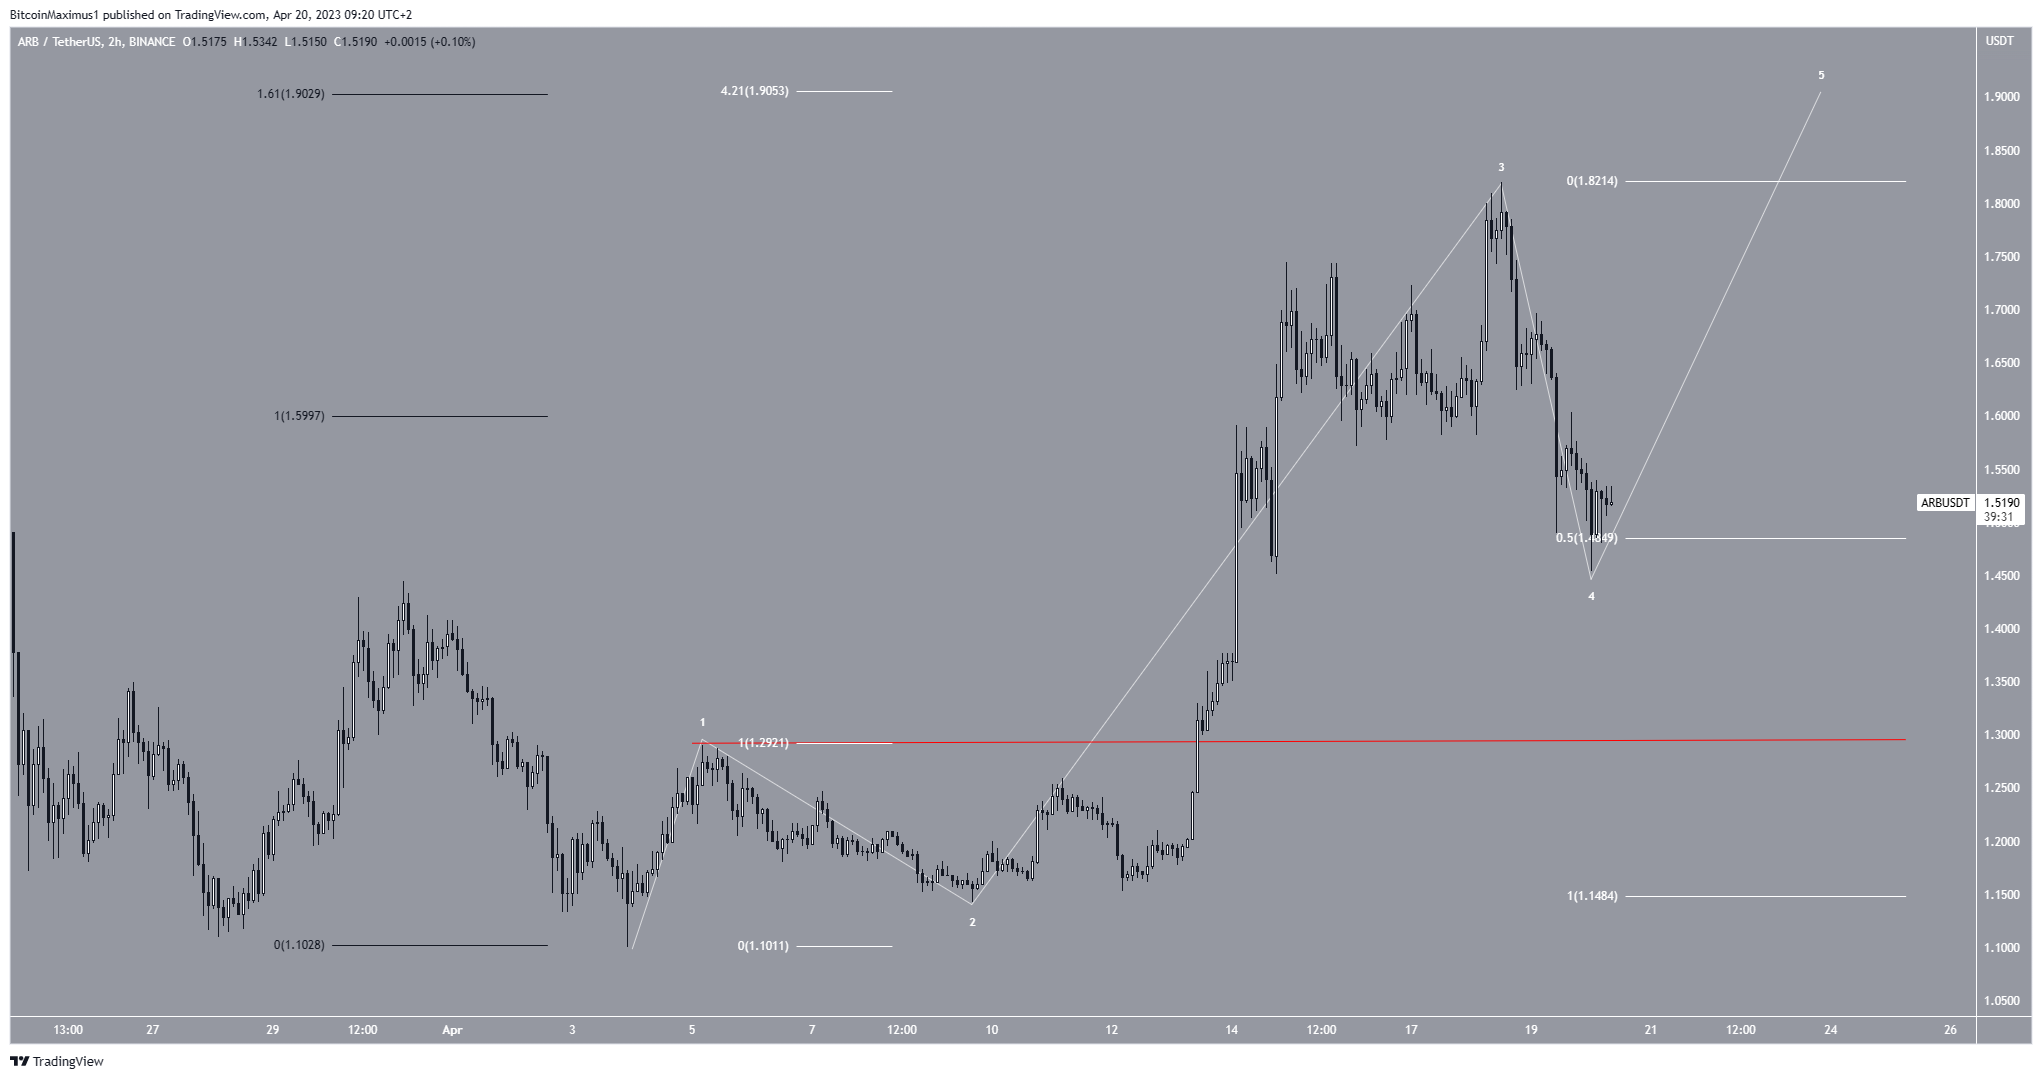
The technical analysis from the short-term two-hour chart gives a bullish ARB price prediction. The main reason for this is the wave count (white).
Elliott Wave theory is a tool used by technical analysts. It searches for repeating long-term price structures and investor behavior to determine the future trend.
The most likely wave count suggests that the ARB token price decrease is the beginning of wave four. Since wave four is usually shallow, it could end at the 0.5 Fib retracement support level at $1.49. The level also coincides with the previously outlined horizontal support area.
Fibonacci retracement levels are lines that traders use to predict where asset prices might go. Fibonacci retracement levels suggest that after a sharp price move in one direction, the price will retrace a portion of that increase and find support before resuming in the original direction.
They can also be used to determine the top of future upward movements. Doing so, the most likely target for the top of the move is at $1.90. The target is found by the 4.21 Fib extension of wave one (white) and the 1.61 extension of the previous drop (black).

However, a minimum price below the wave one high (red line) and $1.28 will invalidate this bullish Arbitrum price forecast. This is because according to Elliot Wave guidelines, wave four cannot overlap with wave one. So, if that occurs, the ARB price could decrease toward $1.
For BeInCrypto’s latest crypto market analysis, click here.
Disclaimer
In line with the Trust Project guidelines, this price analysis article is for informational purposes only and should not be considered financial or investment advice. BeInCrypto is committed to accurate, unbiased reporting, but market conditions are subject to change without notice. Always conduct your own research and consult with a professional before making any financial decisions. Please note that our Terms and Conditions, Privacy Policy, and Disclaimers have been updated.


