

The Cardano (ADA) price cleared a long and short-term horizontal resistance level, confirming the potential for a bullish reversal.
The daily time frame provides a decisively bullish outlook for ADA. There are three main reasons for this:
Firstly, the ADA price broke out from a long-term descending resistance line on March 30. Before the breakout, the line had been in place for 325 days. Breakouts from such long-term structures usually lead to significant increases.
Secondly, the breakout was preceded by a daily RSI breakout from its bearish divergence trendline (green line). Such breakouts in the RSI usually precede breakouts in price, as was the case for ADA. The RSI is now above 50, supporting the continuation of the increase.
Finally, the ADA price reclaimed the $0.425 resistance area.
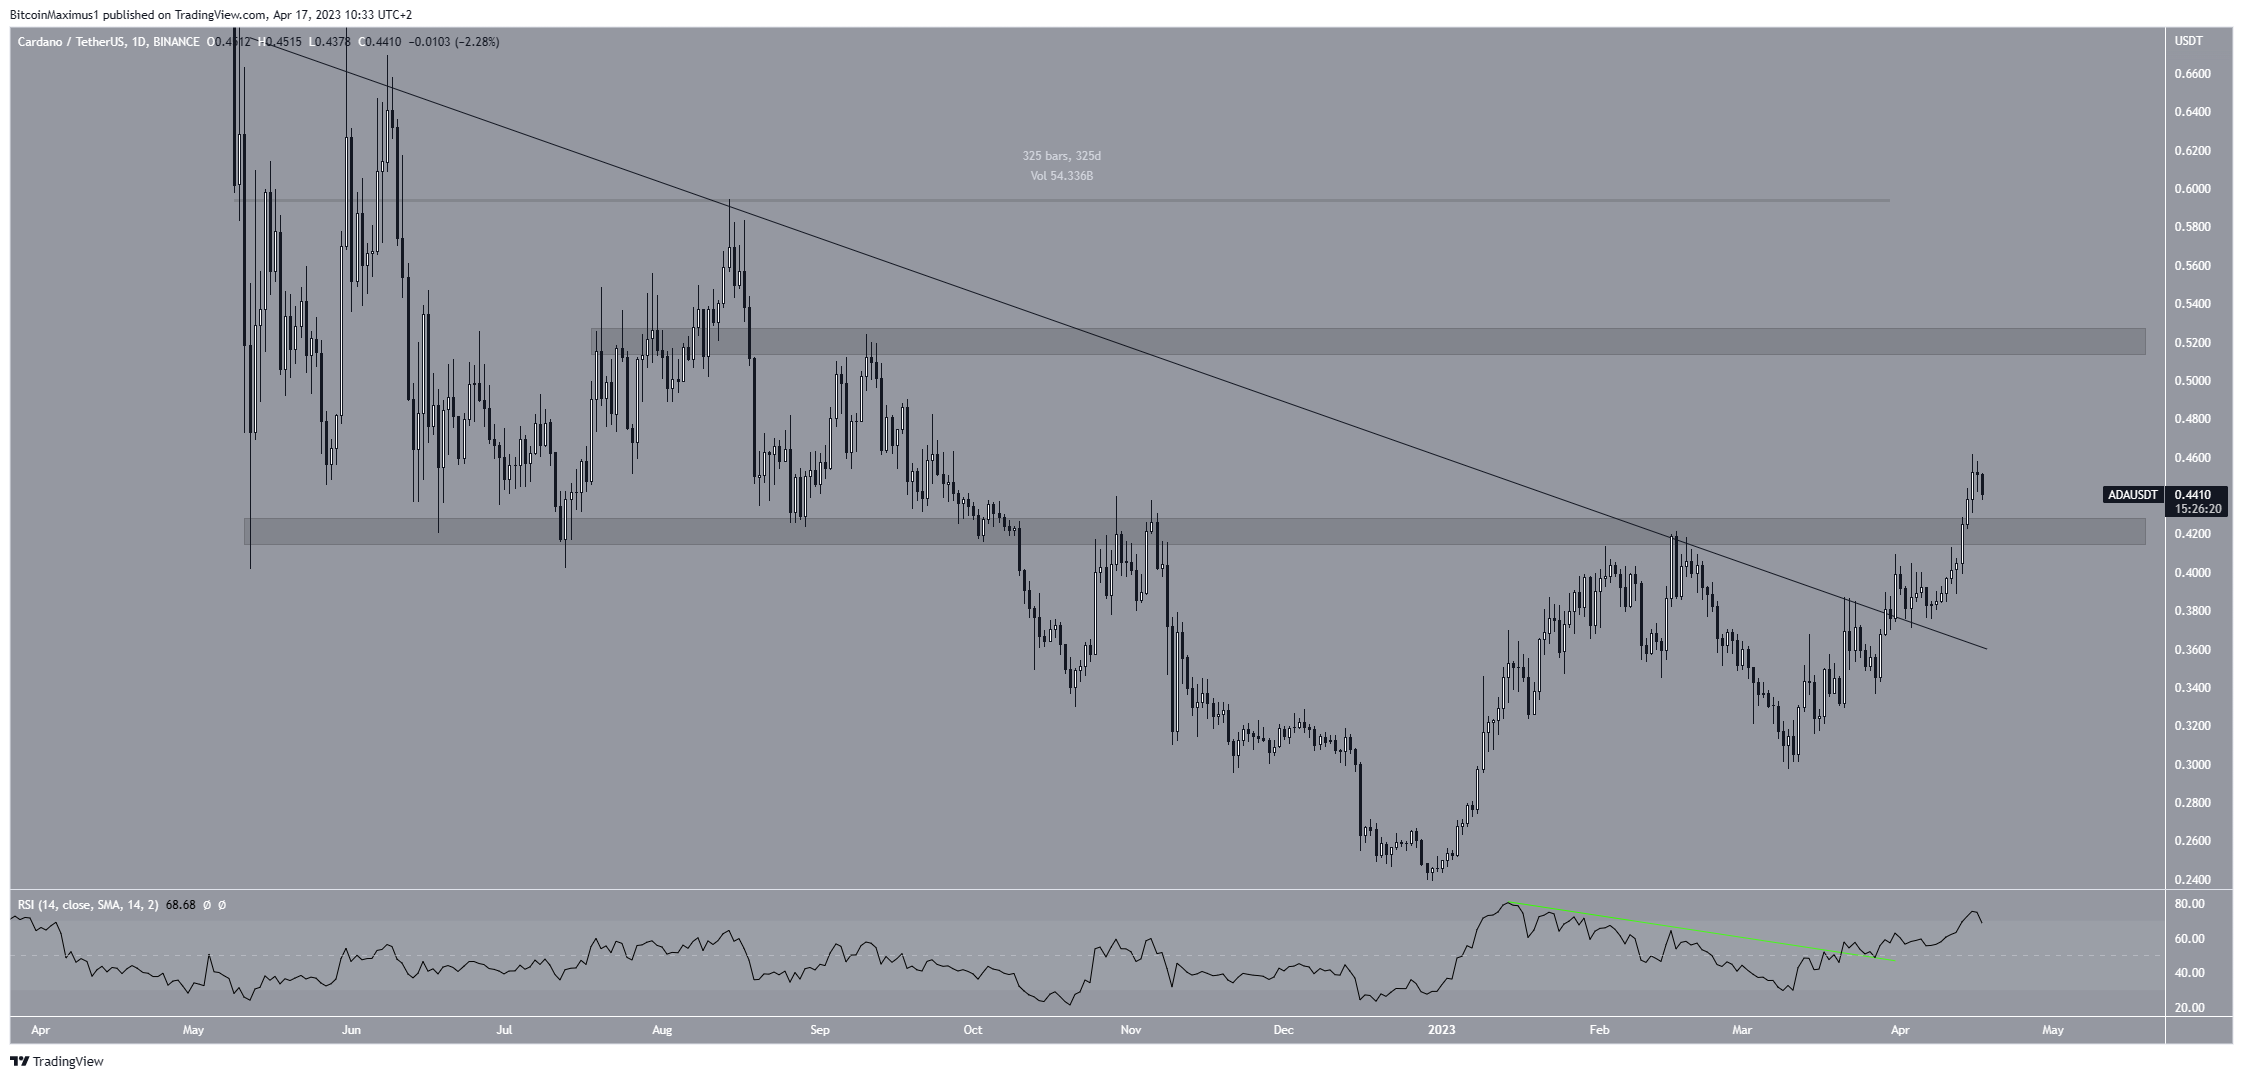
As a result, all signs point to the continuation of the increase toward the next resistance at $0.520.
A daily close below $0.425 would invalidate this bullish forecast and could cause a drop to the resistance line at $0.360.
Cardano (ADA) Price Long-Term Breakout Supports Short-Term Readings
The readings from the weekly time frame align with those from the daily one. In January 2023, the ADA price broke through a descending resistance line that had been in place since the all-time high in August 2021, indicating a potential significant upward movement.
Afterward, it validated it as support (green icon) in March 2023 and created a higher low. More importantly, ADA broke out from the long-term $0.425 horizontal resistance area last week, which aligns with the short-term one. This movement was also combined with an RSI increase above 50.
Therefore, the weekly time frame supports the continuation of the increase toward the next resistance, which in this timeframe is at $0.570. This bullish ADA price forecast would be invalidated with a weekly close below 50. In that case, ADA could drop to $0.320.

To conclude, the most likely ADA price forecast is an increase toward the next resistance levels at $0.525 and possibly $0.565. A close below $0.425 would invalidate this bullish outlook. If that occurs, ADA could decrease to $0.320.
For BeInCrypto’s latest crypto market analysis, click here.
Disclaimer
In line with the Trust Project guidelines, this price analysis article is for informational purposes only and should not be considered financial or investment advice. BeInCrypto is committed to accurate, unbiased reporting, but market conditions are subject to change without notice. Always conduct your own research and consult with a professional before making any financial decisions. Please note that our Terms and Conditions, Privacy Policy, and Disclaimers have been updated.
