The OKB price reached a new all-time high on Feb. 5. It has not shown any major signs of weakness, suggesting that the upward movement could continue.
OKB is a cryptocurrency created by the OK Blockchain Foundation and OKEx, a Maltese cryptocurrency exchange. It is the native token of the OKEx exchange. OKB is a utility token allowing users to access the cryptocurrency exchange’s unique features.
The coin is used to calculate and pay trading fees, to grant users voting and governance access on the platform, and to reward users for holding OKB. It is worth mentioning that the OKEx exchange currently has $7.97 billion in assets and $4.01 billion in open interest. The ratio of less than two to one is in stark contrast to Binance, which has a ratio of more than six to one. Open interest is the number of derivative contracts that have not been settled yet. Therefore, this ratio is worrisome in regard to the liquidity of the exchange.
OKB Price Reaches New All-Time High
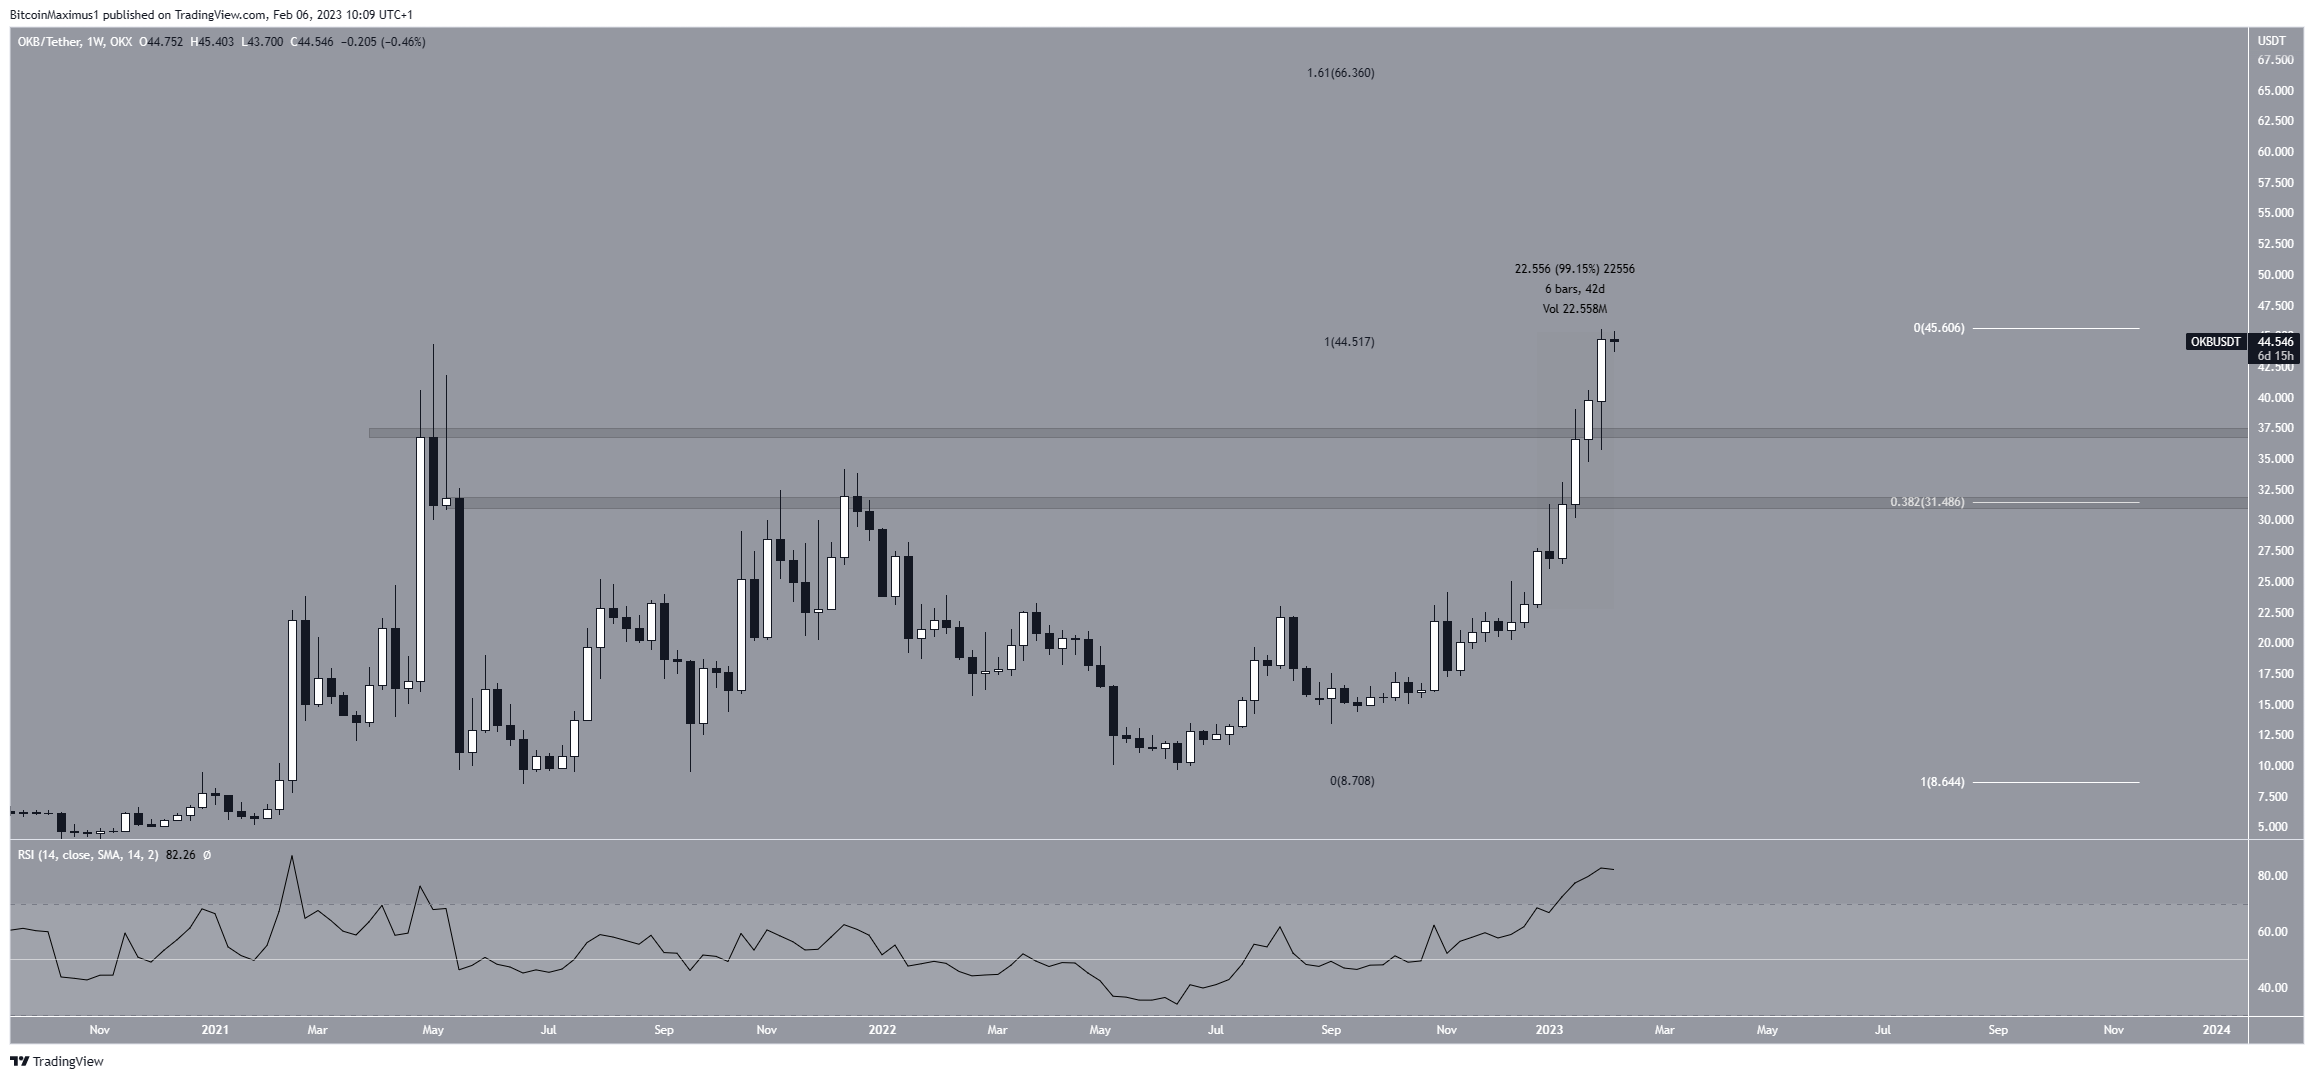
The OKB price has increased since June 2022. The rate of increase accelerated in December of the same year, and the price has posted gains of 99% since then. On Feb. 5, the OKB price reached a new all-time high of $45.54.
Despite the massive increase, there are no signs of weakness yet. The weekly RSI is oversold but has not generated any bearish divergence. This allows for the upward movement to continue.
The closest support areas are found at $37 and $31.50. As long as the OKB price does not close below the latter, the upward movement can still be considered intact, boding well for the future price.
On the other hand, the next resistance is estimated to be at $66.36, created by the 1.61 external Fib retracement of the most recent drop.

OKB Price Prediction for February: No Signs of Weakness Yet
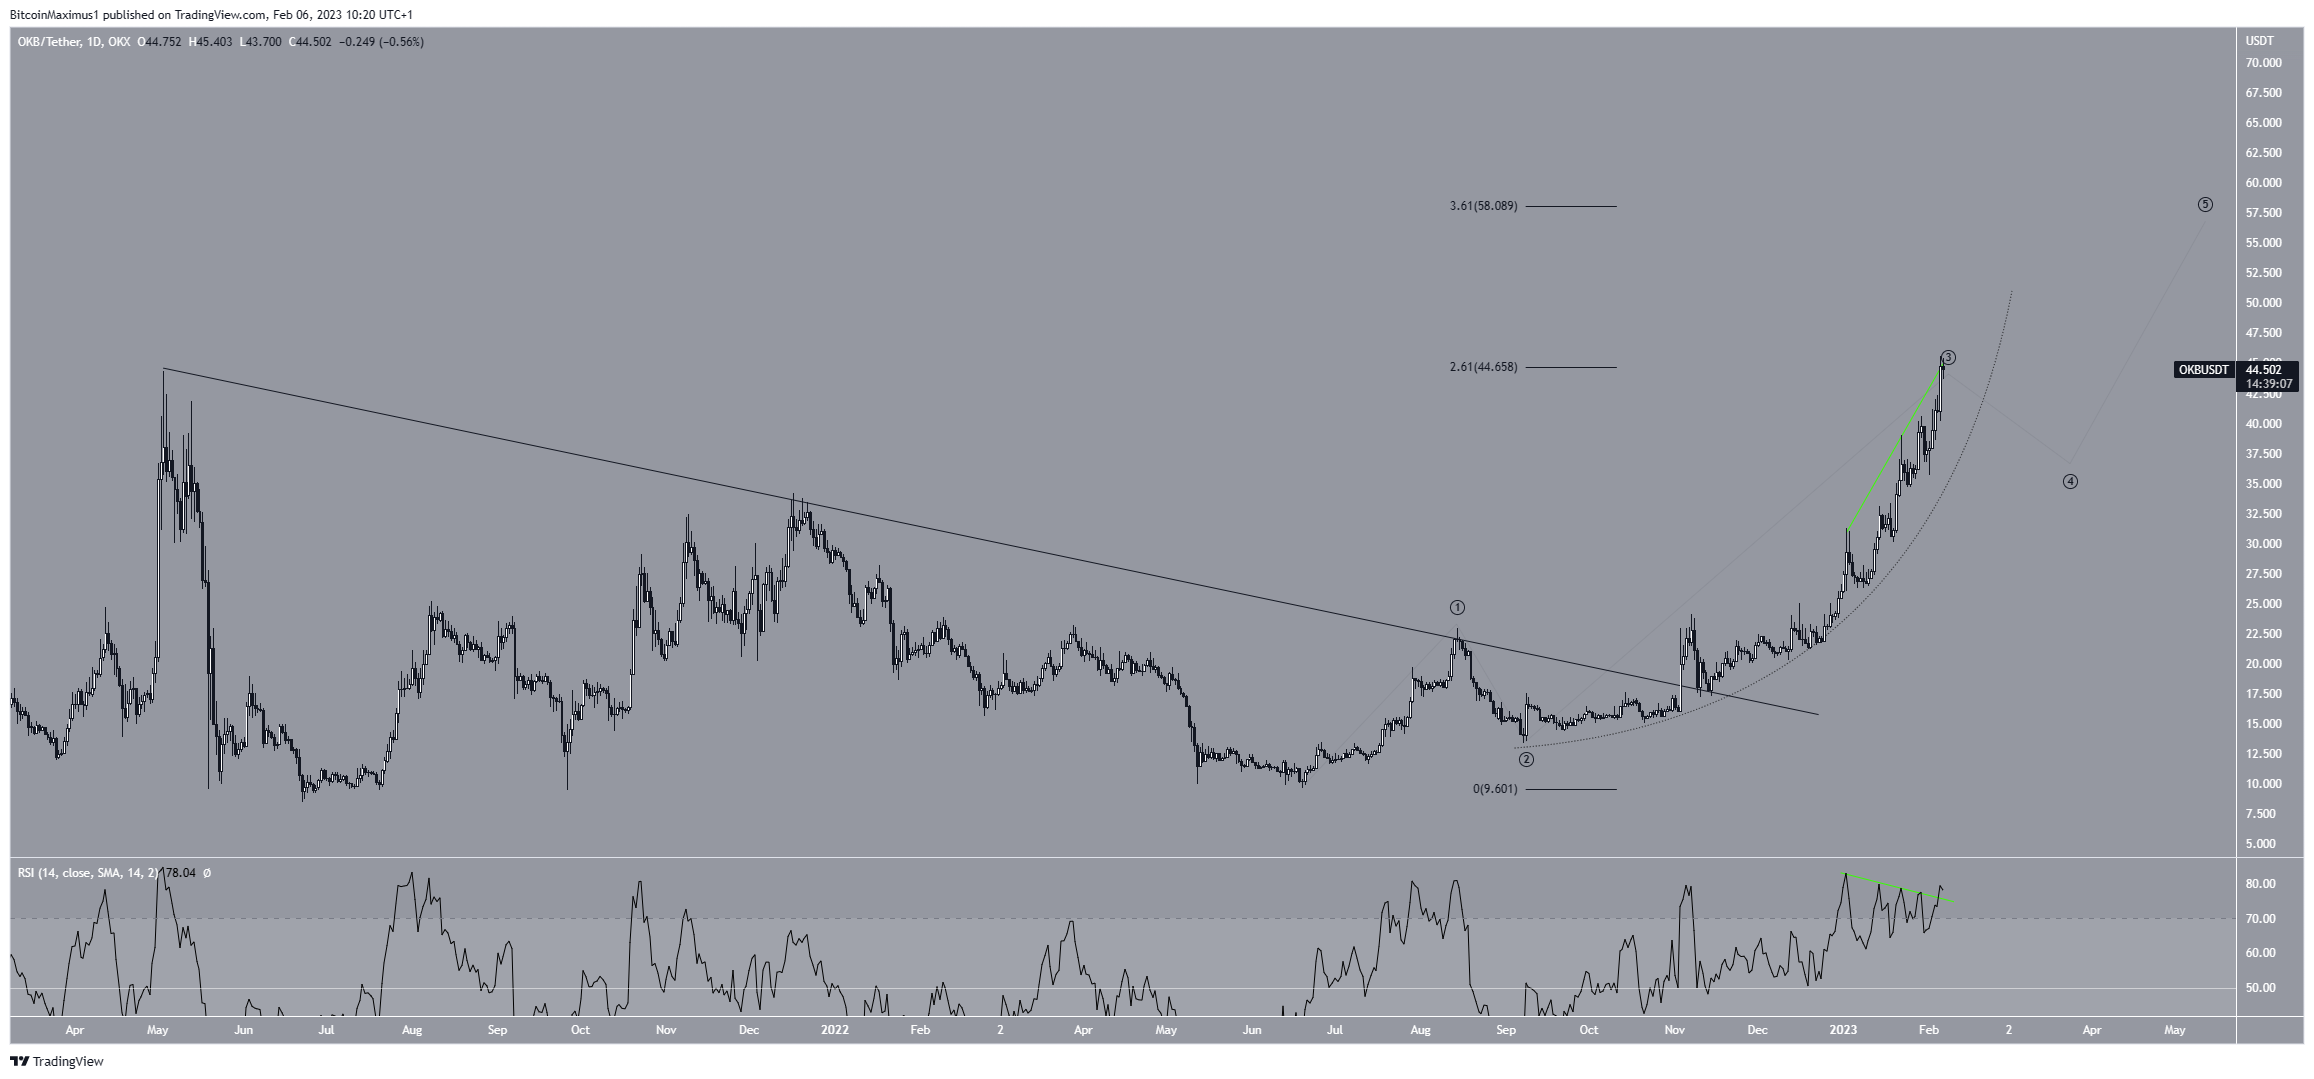
The technical analysis from the daily chart shows that the move accelerated after the OKB price broke out from a long-term descending resistance line. Since then, it has increased in a parabola (dotted). The movement has taken the shape of a five-wave increase. If so, OKB is currently in wave three.
The price is at the 2.61 extension of wave one, so it could get rejected soon. If not, the upward movement could continue to the next resistance at $58.10. This is closer to the previously outlined $66.36 resistance area.
Since the daily RSI broke out from its bearish divergence trendline, the continuation of the increase is the most likely scenario.
In any case, a breakdown from the parabola would likely mean that the price is in a corrective phase in wave four, invalidating this bullish OKB price forecast.

To conclude, the OKB price outlook is still bullish, and OKB is expected to increase toward $58-$66. However, a breakdown from the parabola would mean that the upward move is finished, and the price could correct back to the $31-$37 range.
For BeInCrypto’s latest crypto market analysis, click here.
Disclaimer
In line with the Trust Project guidelines, this price analysis article is for informational purposes only and should not be considered financial or investment advice. BeInCrypto is committed to accurate, unbiased reporting, but market conditions are subject to change without notice. Always conduct your own research and consult with a professional before making any financial decisions. Please note that our Terms and Conditions, Privacy Policy, and Disclaimers have been updated.

