BTC
Bitcoin (BTC) has been increasing alongside an ascending support line since Jan 24. It has bounced at this line numerous times, most recently doing so on April 25.
During several of these bounces, BTC created either bullish engulfing or hammer candlesticks. It did the same during the April 25 bounce. It remains to be seen if this will be the catalyst for a significant upward movement.
ETH
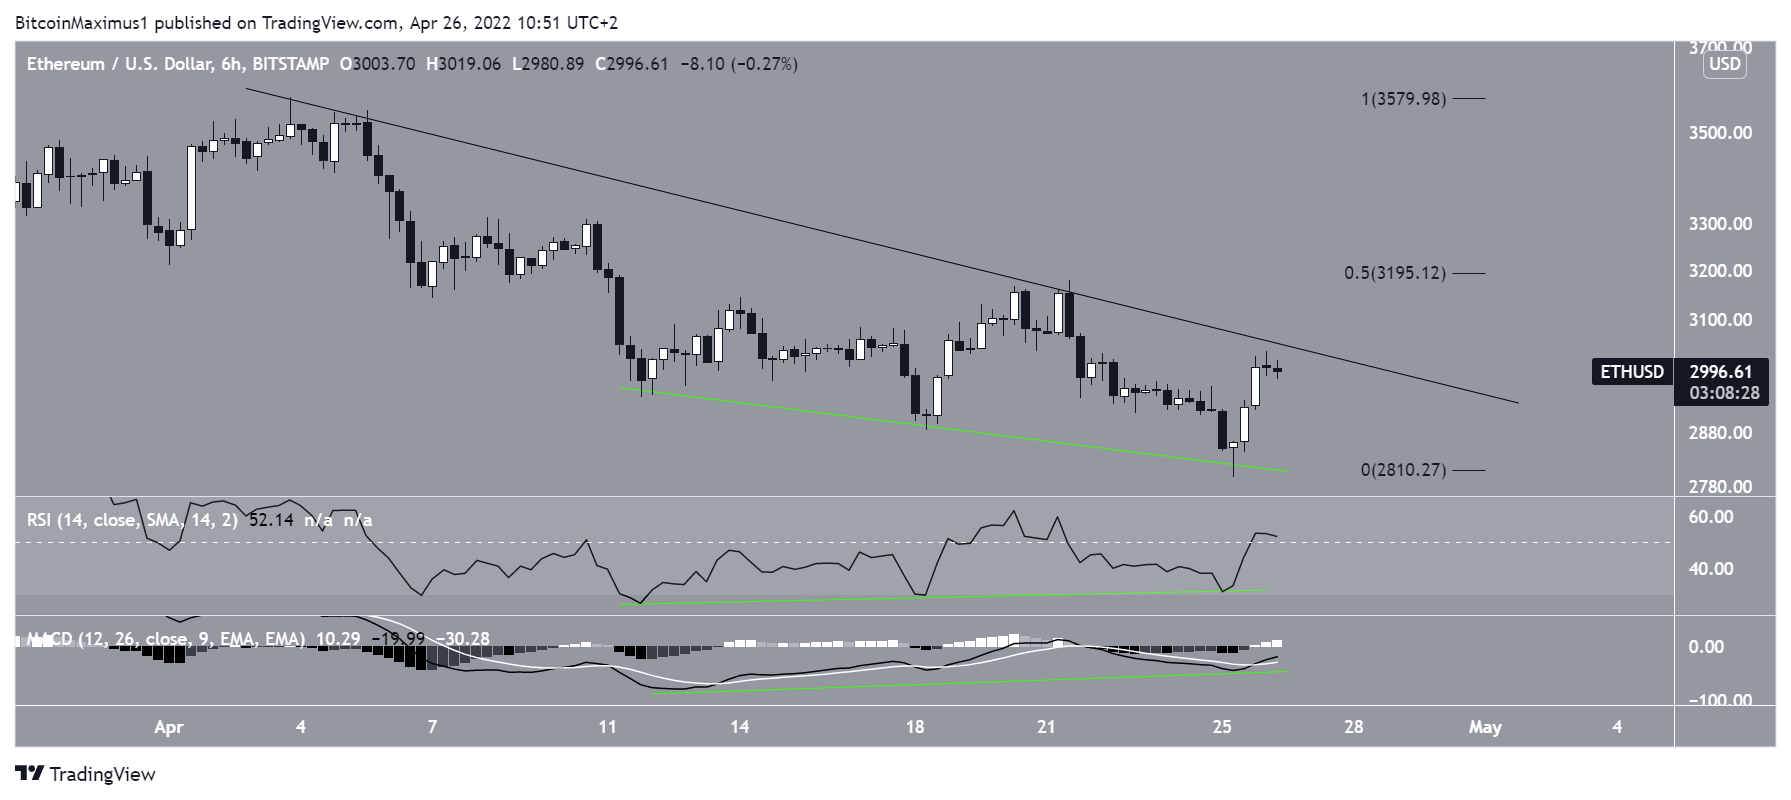
Ethereum (ETH) has been decreasing underneath a descending resistance line since April 3. The downward movement has so far led to a low of $2,798 on April 25.
In the period from April 11 to 25, both the RSI and MACD generated significant bullish divergences (green lines). Such divergences often lead to upward movements, as was the case from April 25 to 26.
If a breakout occurs, the closest resistance area would be at $3,200. This is the 0.5 Fib retracement resistance level.
XRP
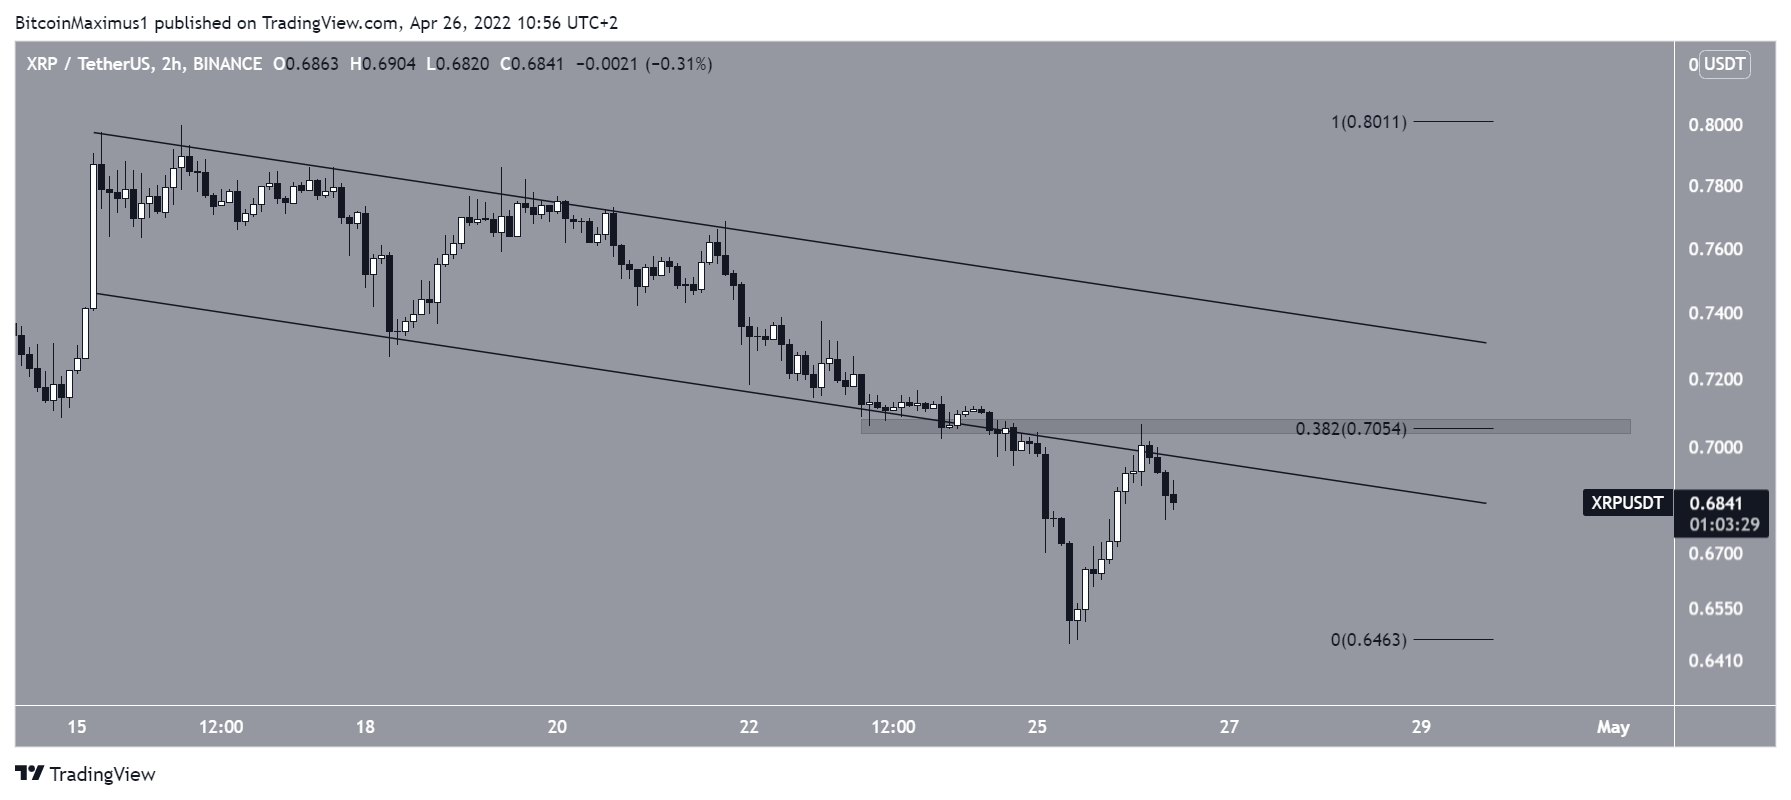
XRP has been decreasing inside a descending parallel channel since April 15. On April 24, XRP broke down from both the channel and the $0.70 horizontal area. This led to a low of $0.64 on April 25.
While XRP has been moving upwards since, it was rejected by both the channel and the $0.70 area on April 26. Until XRP reclaims this level, the trend cannot be considered bullish.
LUNA
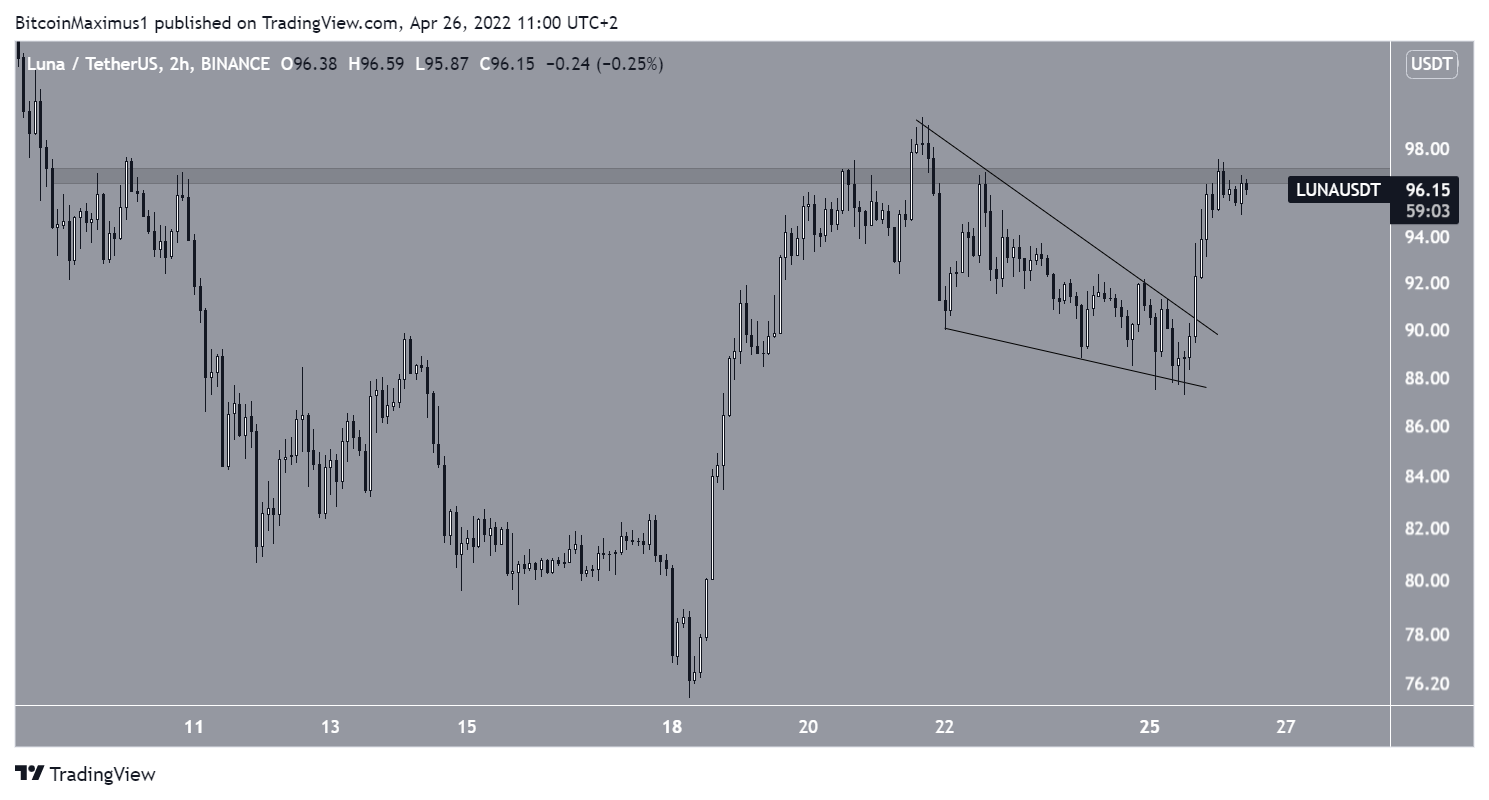
Terra (LUNA) has been decreasing inside a descending wedge since April 21. The wedge is considered a bullish pattern, meaning that it leads to breakouts the majority of the time.
On April 25, LUNA broke out from the wedge and proceeded to reach a high of $97.50 on April 26. The price is currently trading inside the $96.70 area. With the exception of a deviation on April 21, the area has been acting as resistance since April 10.
A breakout above this resistance could initiate a sharp upward movement.
ETC
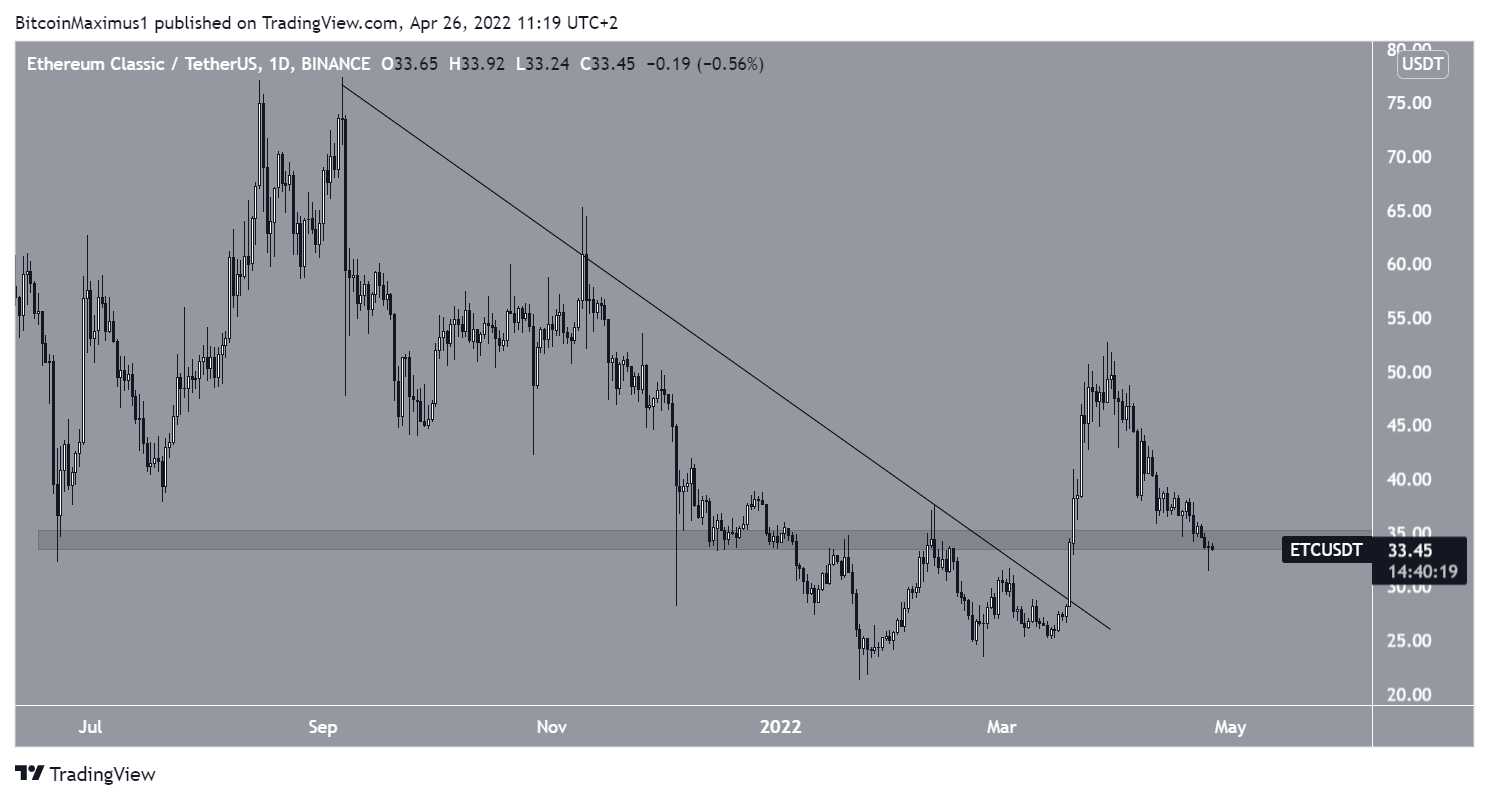
On March 19, Ethereum Classic (ETC) broke out from a descending resistance line and proceeded to reach a high of $52.66 on March 29.
However, ETC has been falling since. It proceeded to reach a low of $31.38 on April 25.
So far, ETC has managed to stay inside the $34.50 horizontal support area. However, a breakdown below it could be the catalyst for a sharp fall.
RSR
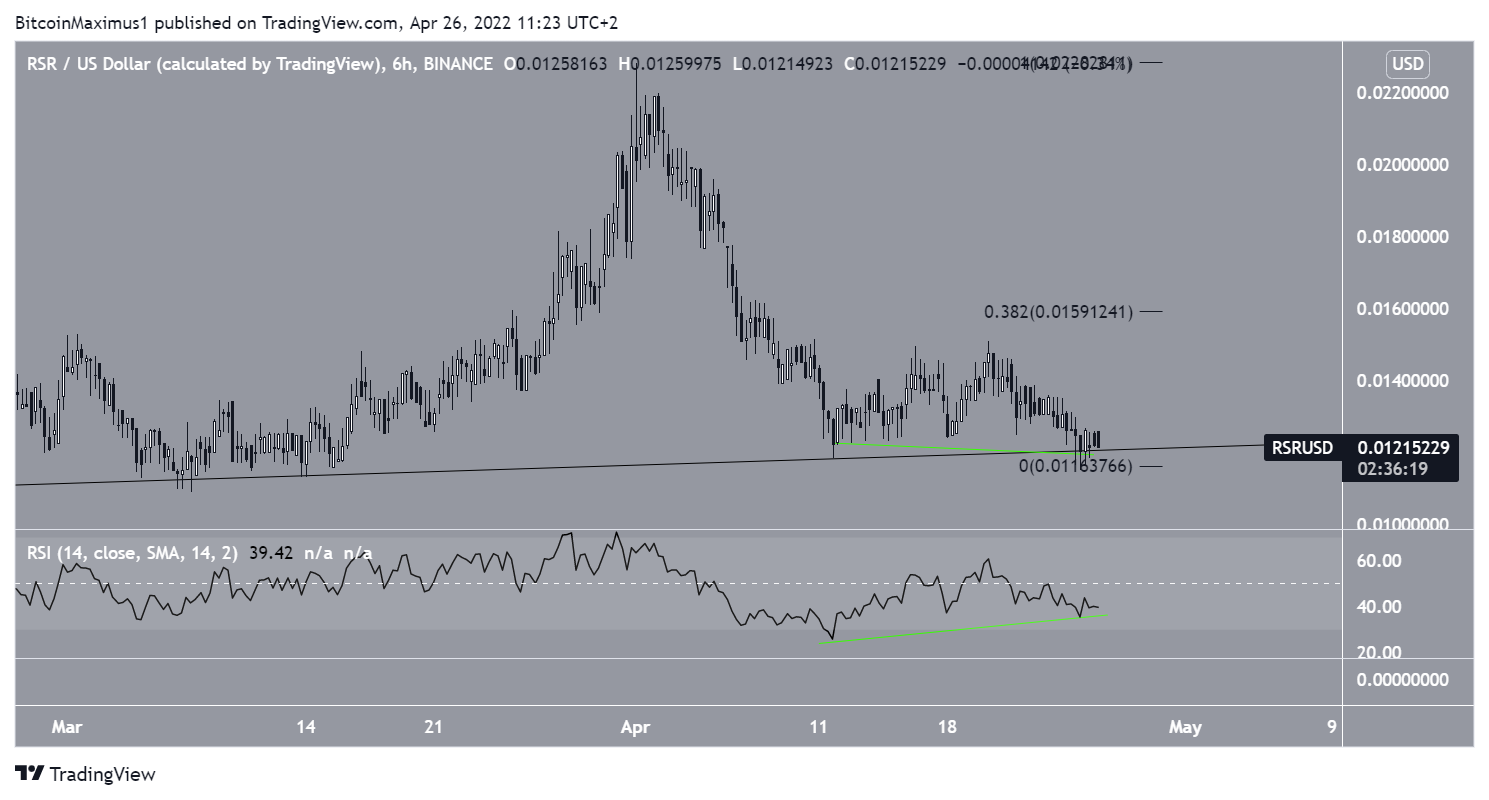
Reserve Rights (RSR) has been increasing alongside an ascending support line since Feb 24. The line has been validated five times so far, most recently on April 25.
During the two most recent touches, the RSI has generated bullish divergence. In addition to this, the movement resembles a double bottom, which is considered a bullish pattern.
If a bounce transpires as a result of the divergence and bullish pattern, the closest resistance would be at $0.016.
DOGE
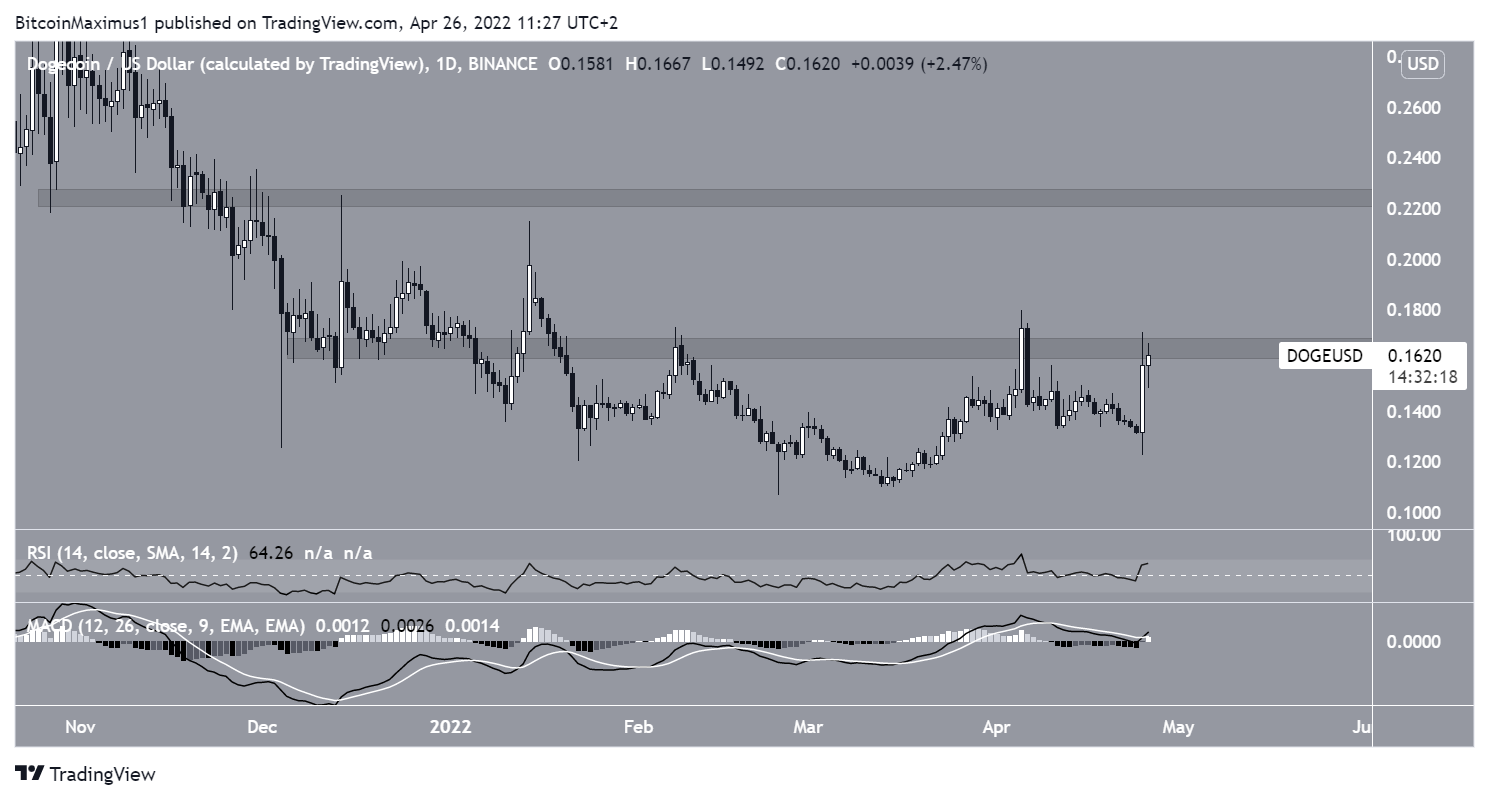
Dogecoin (DOGE) has been moving upwards since March 14, and created a higher low on April 25.
The same day, it created a large bullish candlestick that took it to a high of $0.171 the same day.
However, DOGE decreased slightly and is now trading inside the $0.165 horizontal area once more.
Despite the decrease, the RSI and MACD are both bullish, supporting the possibility of a breakout. If one occurs, the next resistance would be at $0.225.
For Be[In]Crypto’s latest Bitcoin (BTC) analysis, click here
Disclaimer
In line with the Trust Project guidelines, this price analysis article is for informational purposes only and should not be considered financial or investment advice. BeInCrypto is committed to accurate, unbiased reporting, but market conditions are subject to change without notice. Always conduct your own research and consult with a professional before making any financial decisions. Please note that our Terms and Conditions, Privacy Policy, and Disclaimers have been updated.


