
BeInCrypto looks at five biggest altcoins losers in the entire crypto market this week, specifically from Feb. 17-24.
The altcoins that have fallen the most in the entire crypto market are:
- Loopring (LRC) price fell by 13.62%
- Render Token (RNDR) price fell by 12.13%
- dYdX (DYDX) price fell by 11.89%
- Fantom (FTM) price fell by 10.25%
- Aptos (APT) price fell by 9.03%
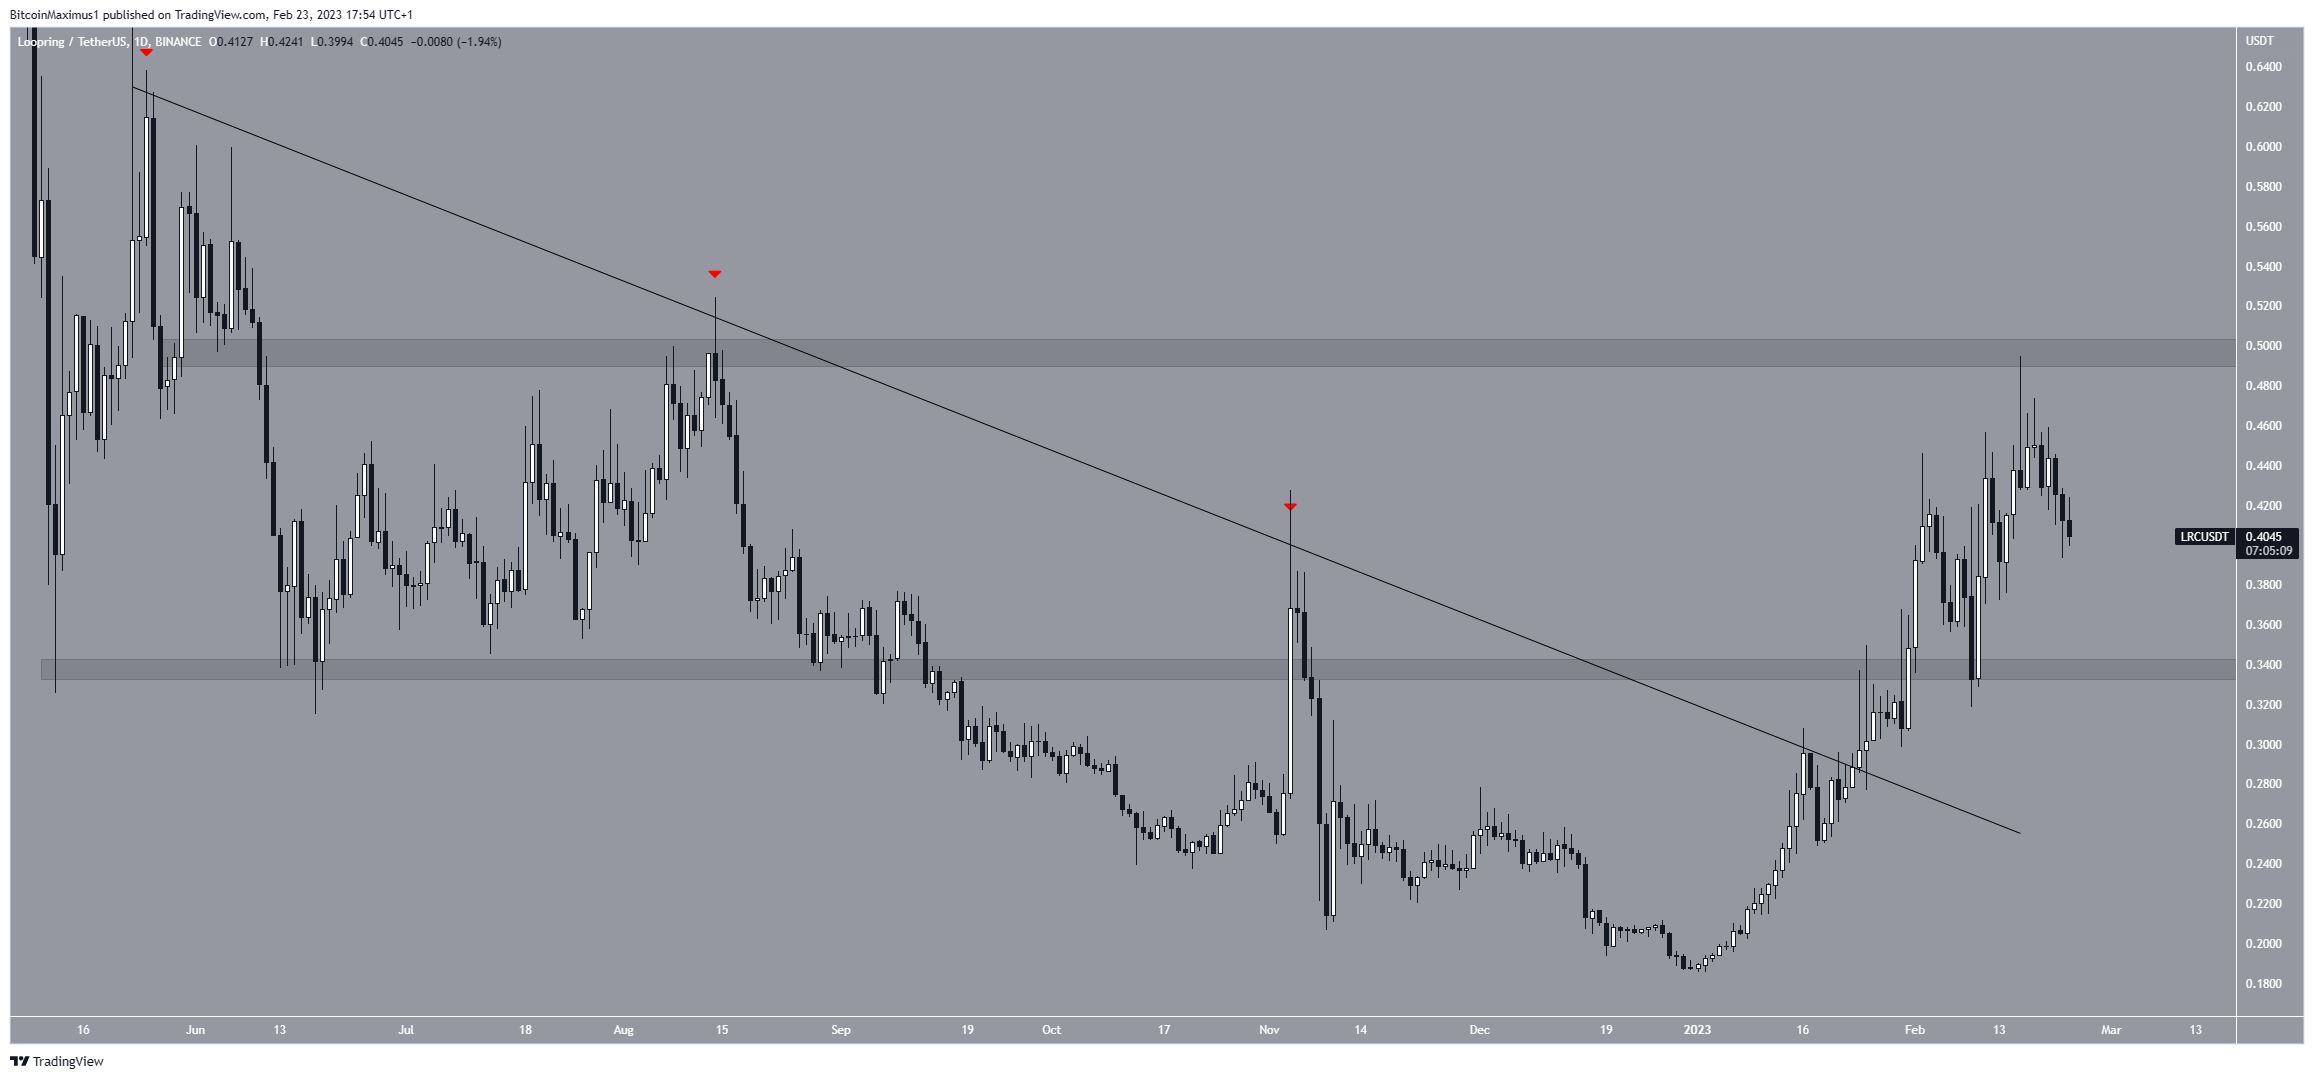
Loopring (LRC) Price Leads Crypto Losers
The LRC price broke out from a descending resistance line on Jan. 23. The increase led to a high of $0.49 on Feb. 16. However, the price created a long upper wick and has fallen since.
Whether the LRC price breaks out above $0.50 or continues to decrease will likely determine the future movement. A breakout could take the price to $0.60, while the continuing of the decrease could cause a fall to $0.33.
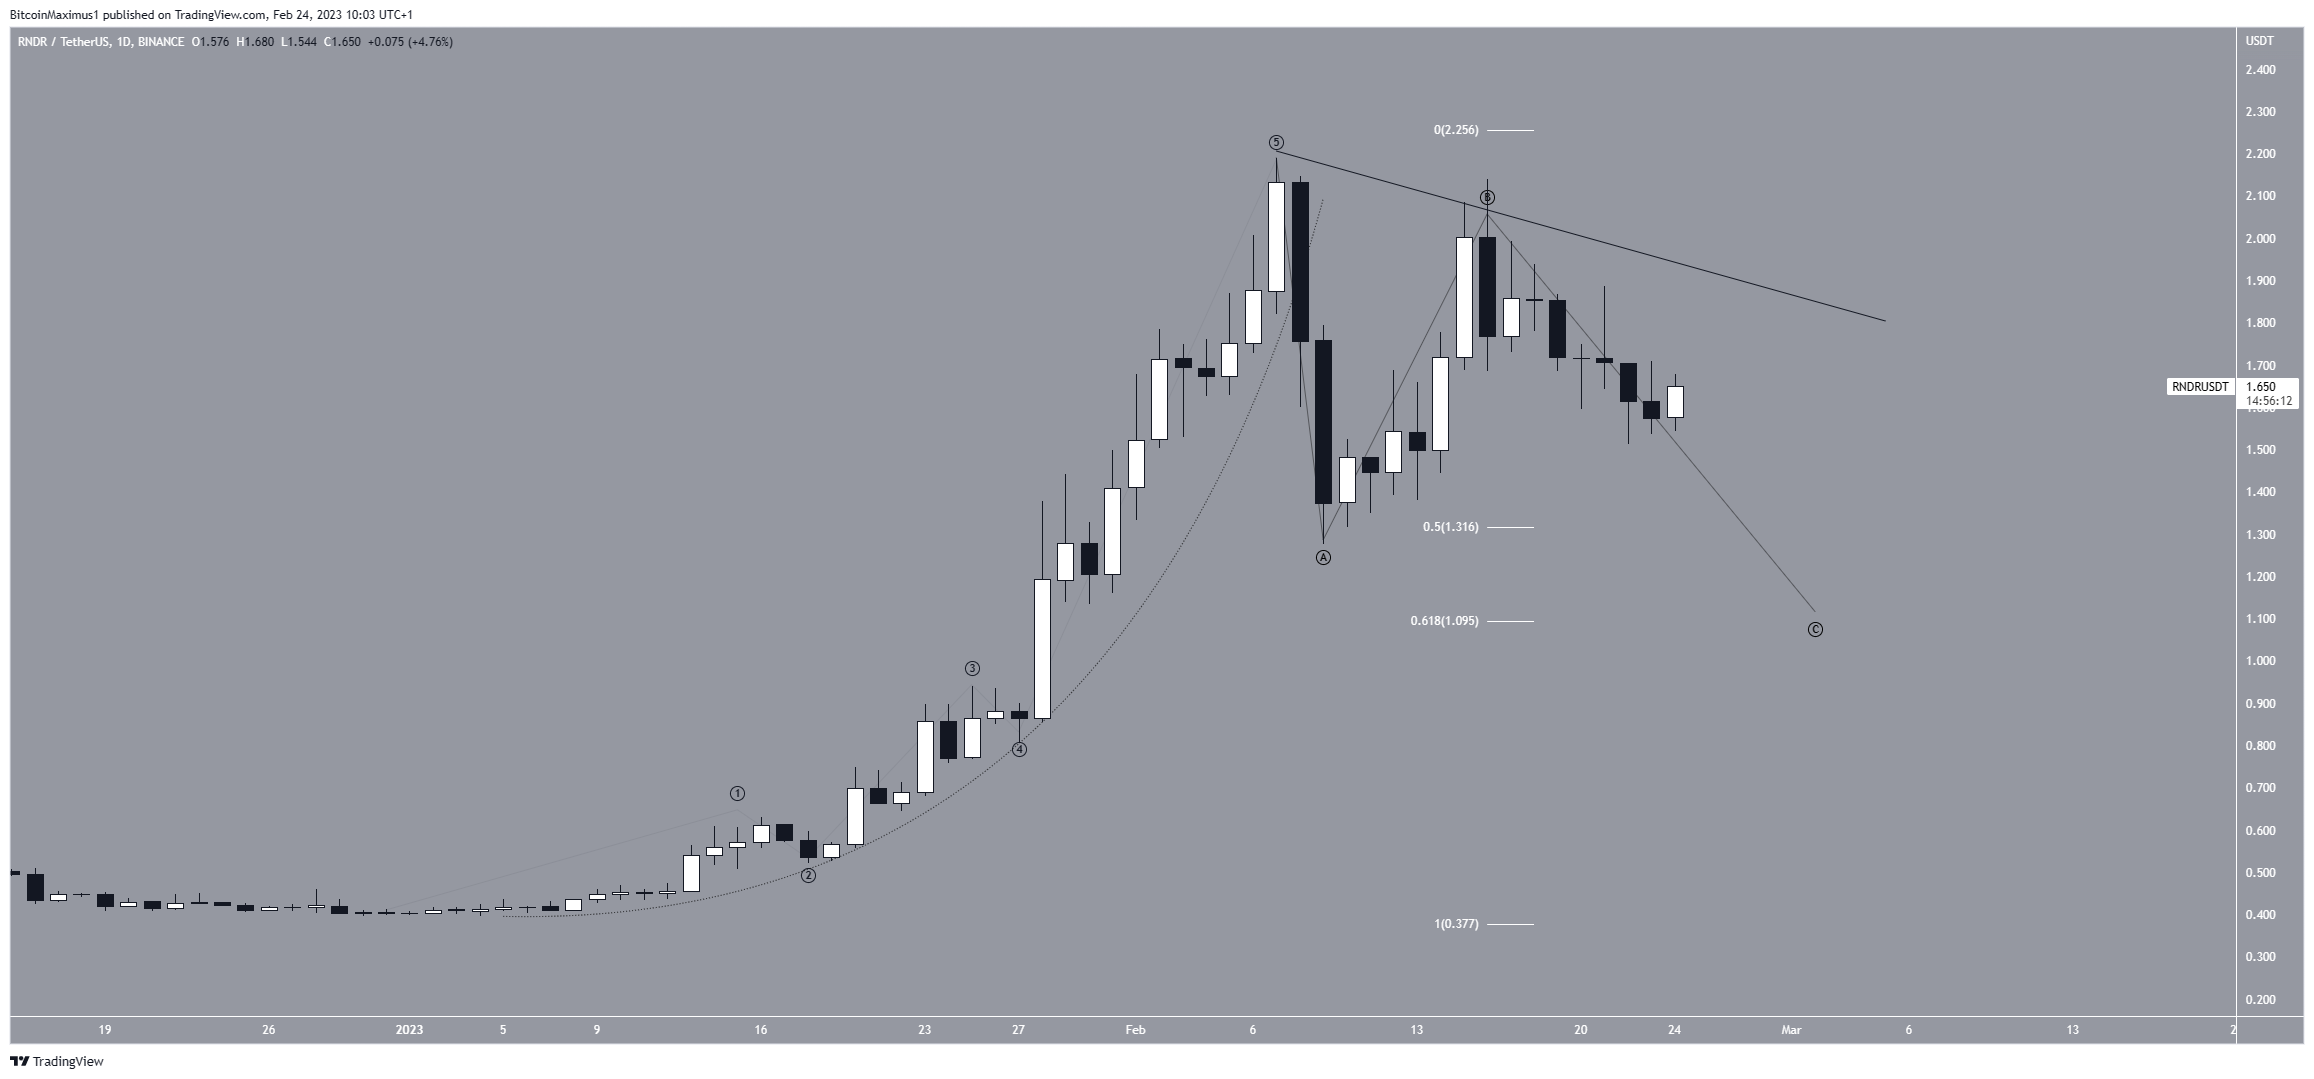
Render Token (RNDR) Breaks Down From Parabola
The RNDR price had increased alongside a parabolic ascending support line since the beginning of the year. The increase led to a high of $2.19 on Feb. 7.
However, the price broke down from the parabola the next day. It is now likely in the C wave of an A-B-C corrective structure. The most likely level for the correction to end would be at the 0.618 Fib retracement support level at $1.09.
However, if the RNDR price breaks out from the current short-term descending resistance line, it could increase to $2.20.
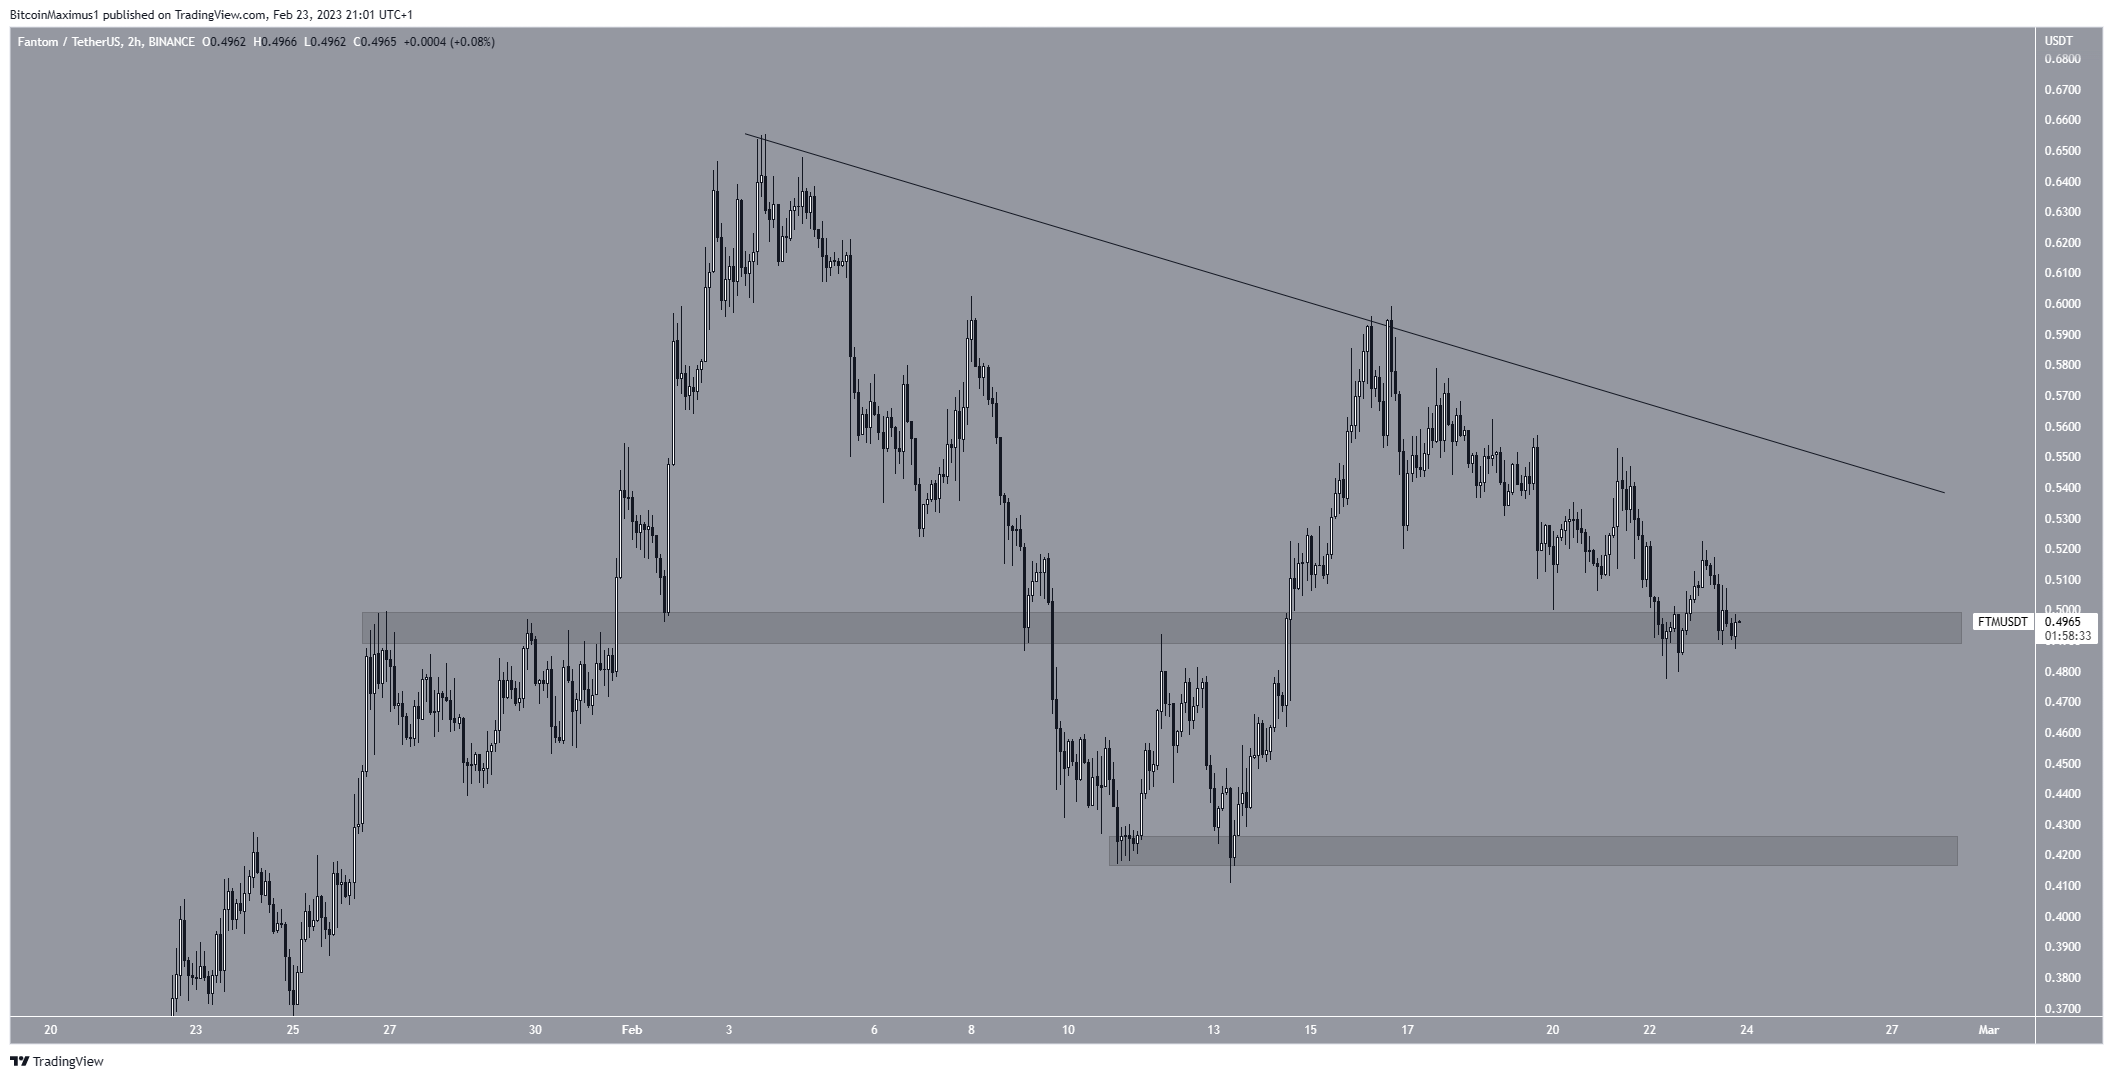
Fantom (FTM) Trades Inside Support
Similar to APT, the FTM price has fallen under a descending resistance line since Feb. 3. More recently, the line caused a rejection on Feb. 16.
The FTM price is currently trading inside the $0.495 support area. Whether it bounces or breaks down could determine the future trend’s direction. A bounce could lead to a retest of the resistance line, while a breakdown could lead to a fall toward $0.420.
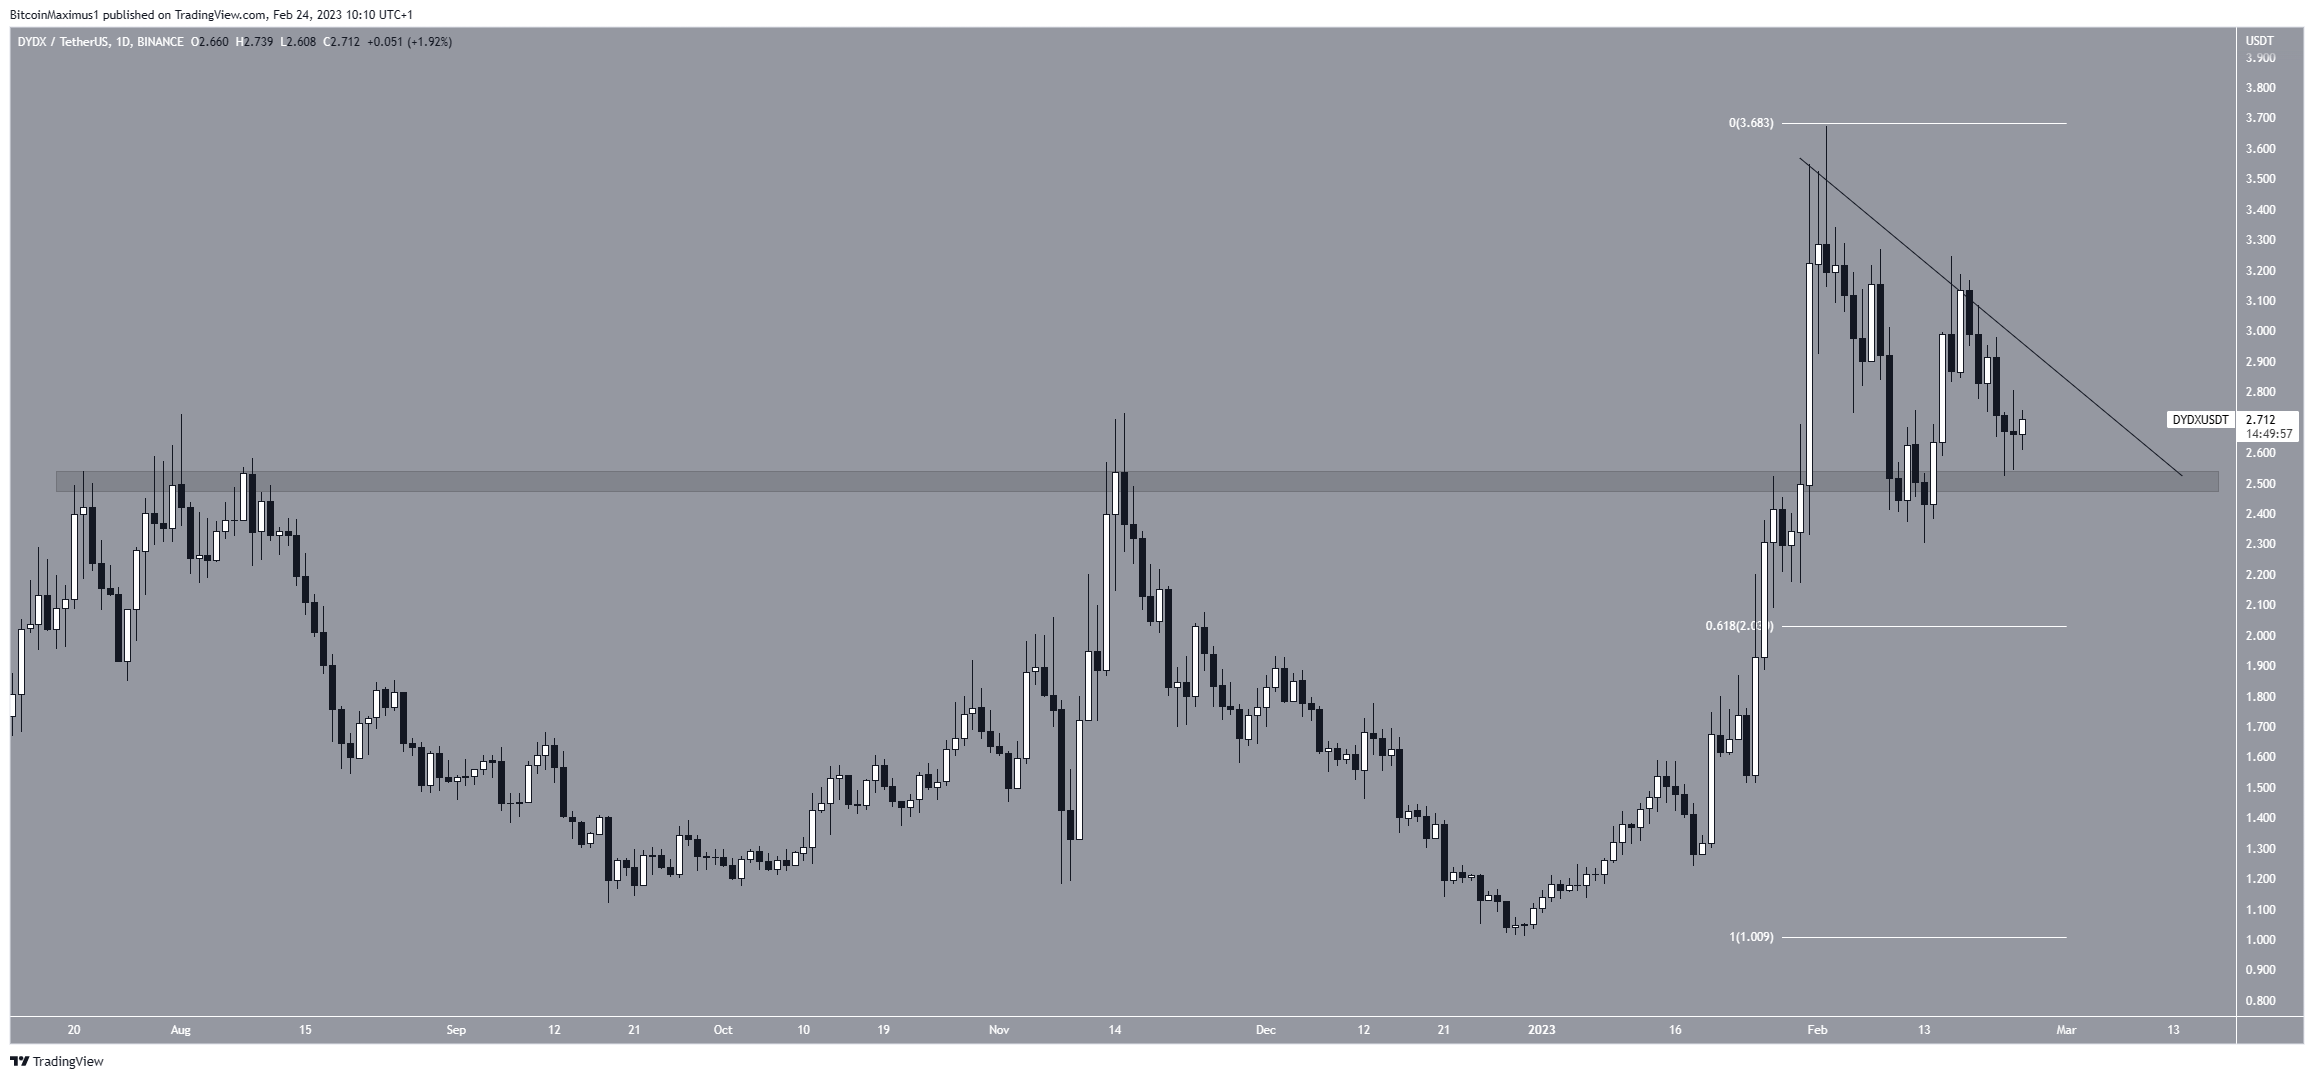
dYdX (DYDX) Bounces at Support
The DYDX price has fallen below a descending resistance line since Jan. 30. The line caused a rejection on Feb. 16.
Currently, the price is trading between the $2.50 horizontal support area and the descending resistance line. If it breaks out from the line, it could increase to $3.50.
However, if it breaks down below $2.50, the price could fall to $2.00.
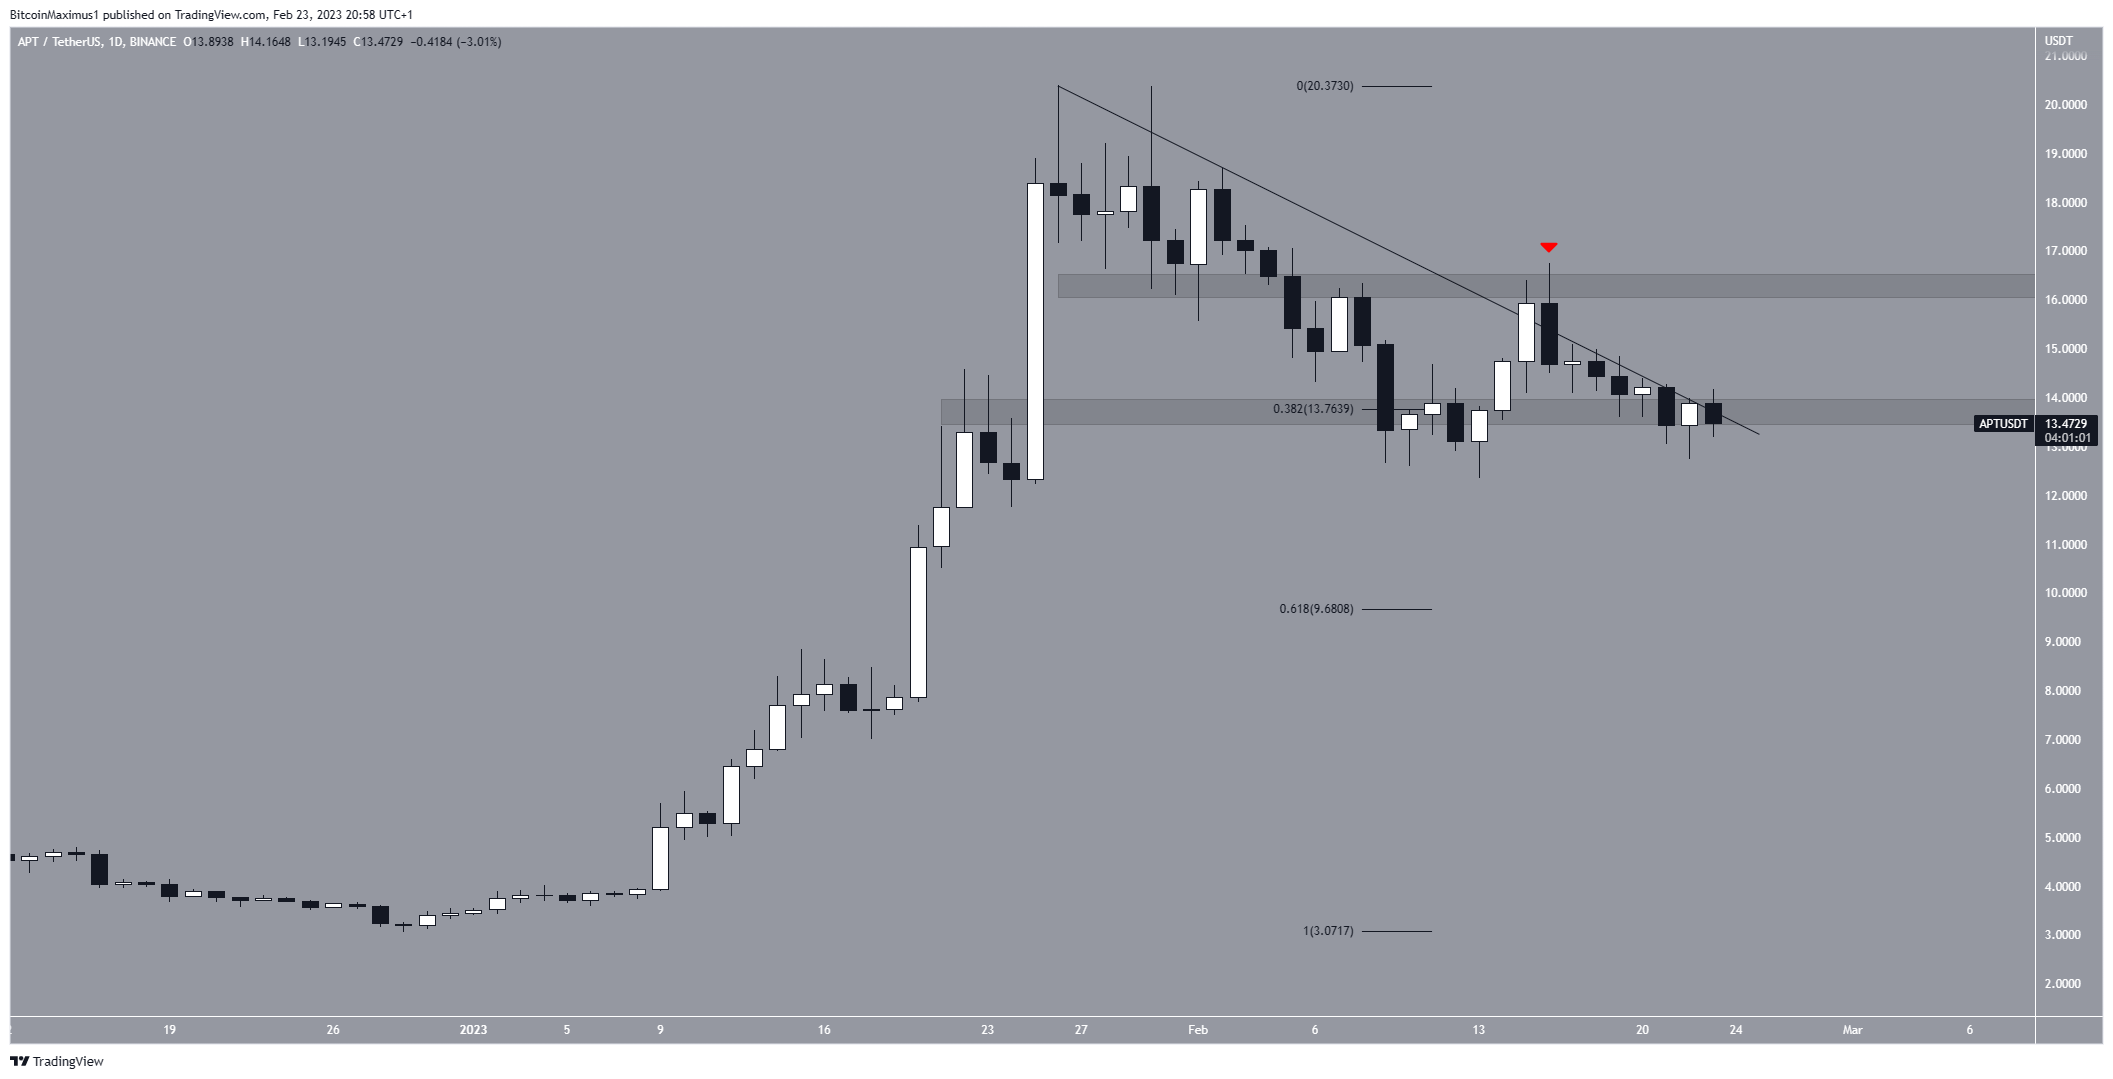
Aptos (APT) Price Follows Resistance Line
The APT price has fallen below a descending resistance line since Jan. 26. The line has caused numerous rejections, most recently on Feb. 16 (red icon).
When combined with the $13.76 support area, the price action creates a descending triangle, which is considered a bearish pattern. As a result, a breakdown from it would be the most likely future price forecast. In that case, the APT price could fall to $9.68.
However, if the price breaks out from the triangle instead, an increase toward $16.50 could follow.
For BeInCrypto’s latest crypto market analysis, click here.
