


While the month of April started out bullish for the cryptocurrency market, a sharp fall that began on April 14 caused several cryptocurrencies to lose all of their gains and even post negative rates of increase.
April saw a turbulent crypto market with prices showing extreme volatility, bearish crypto prices were seen towards the end of the month. These four cryptocurrencies were hit especially hard, and their formations suggest that more downside is expected as a new month kicks off.
Polygon (MATIC) Price Loses Critical Support
The Polygon (MATIC) price broke down from an ascending support line on April 19. The line had previously shaped the slope of the increase since the beginning of the year.
As a result, the breakdown from this indicates that the upward movement is done, and a new move to the downside has begun.
Moreover, the price lost the critical Fib and horizontal support level at $1.05. According to the Fibonacci retracement levels principle, following a significant price change in one direction, the price is expected to partially retrace or go back to a previous price level before resuming in its original direction, and these levels can also be utilized to identify the top of future upward movements.
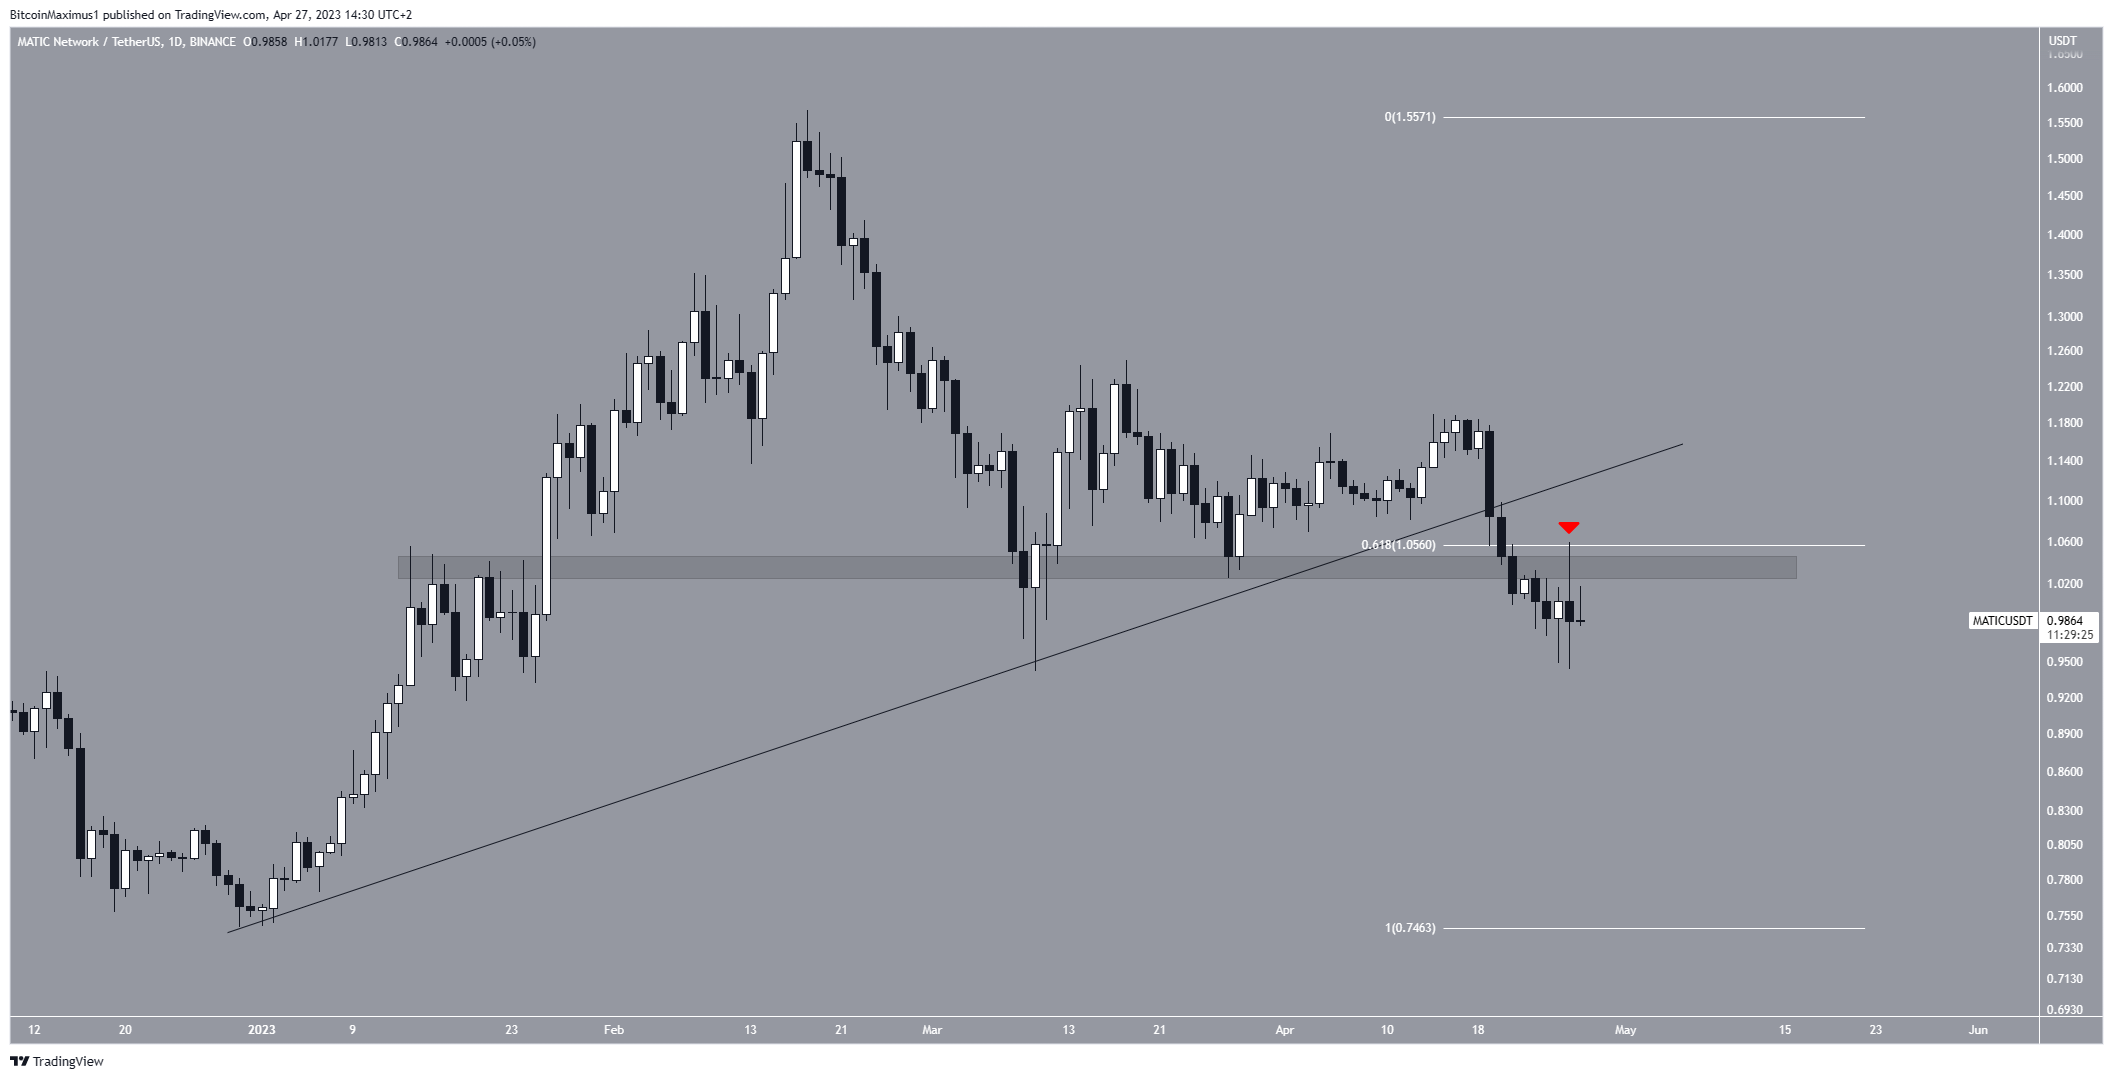
After breaking down, the cryptocurrency validated the $1.05 level as resistance (red icon). This supports the possibility that more downside is expected before the price reaches a bottom.
Due to the lack of support below the current price, MATIC could fall to its yearly low of $0.74. A close above $1.05 will make this bearish forecast invalid. In that case, MATIC could reach the previous ascending support line at $1.20.
However, bearish momentum currently indicates more downside can be expected.
PancakeSwap (CAKE) Price Falls to New Yearly Low
The CAKE price has decreased since breaking down from an ascending support line on April 19. The decrease has been swift, allowing for no trace of a bounce.
The CAKE token price reached a new yearly low of $2.57 and risks further breakdown from the $2.55 horizontal support area. If it does break down, it will decrease below its 2022 low.
Due to the lack of support below the current price, this could cause a sharp fall to $0.70.
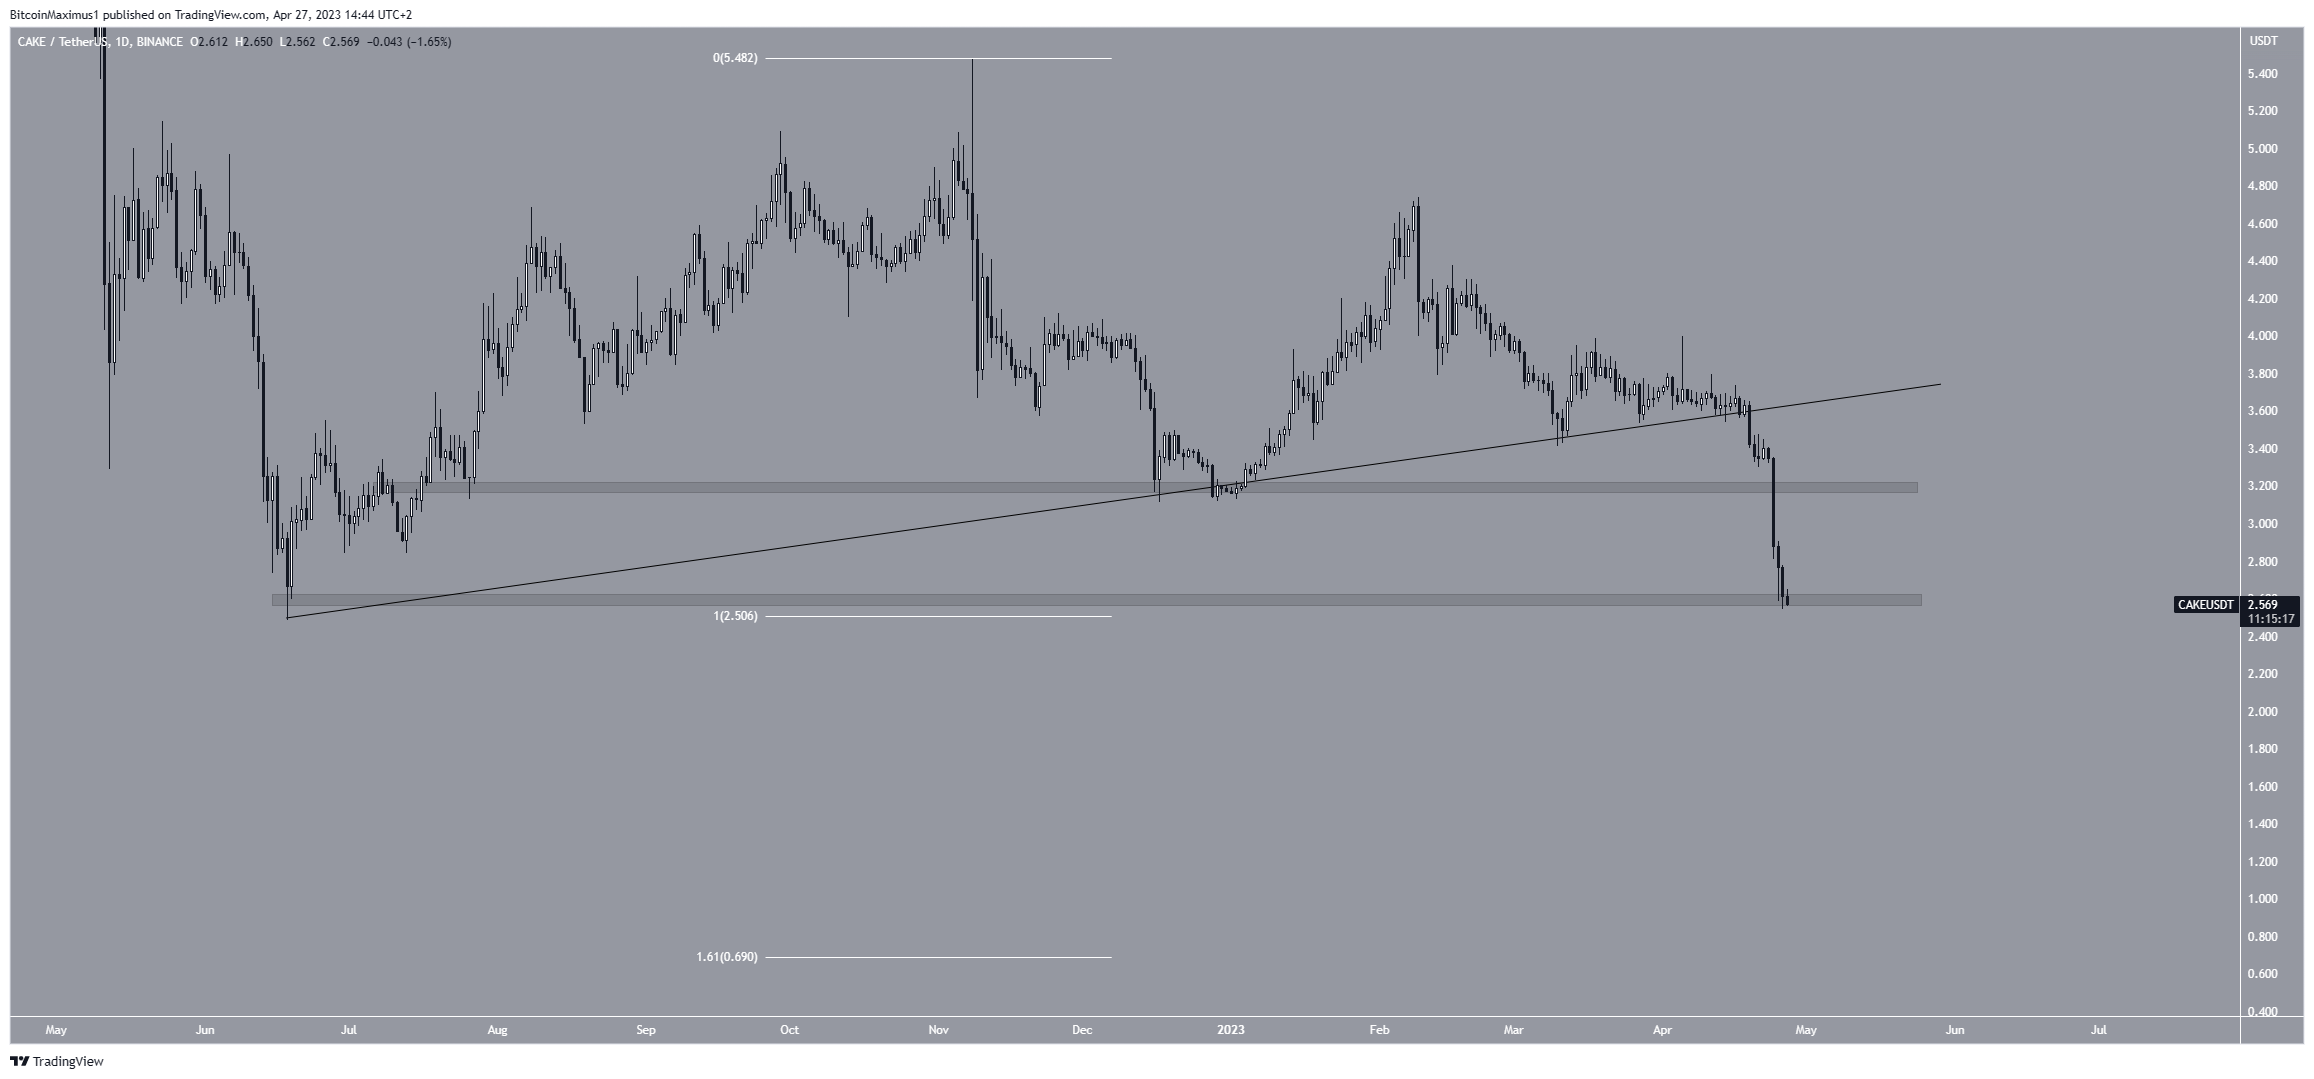
However, if the cryptocurrency bounces, it could increase toward the $3.20 area, which would now be expected to provide resistance.
Optimism (OP) Price Risks Breakdown From Bearish Pattern
The OP price has fallen under a descending resistance line since the beginning of February. Besides the line, the price has also reacted to the $2.0 horizontal support area.
When combined, they create a descending triangle, which is considered a bearish pattern. This means that the pattern leads to breakdowns most of the time.
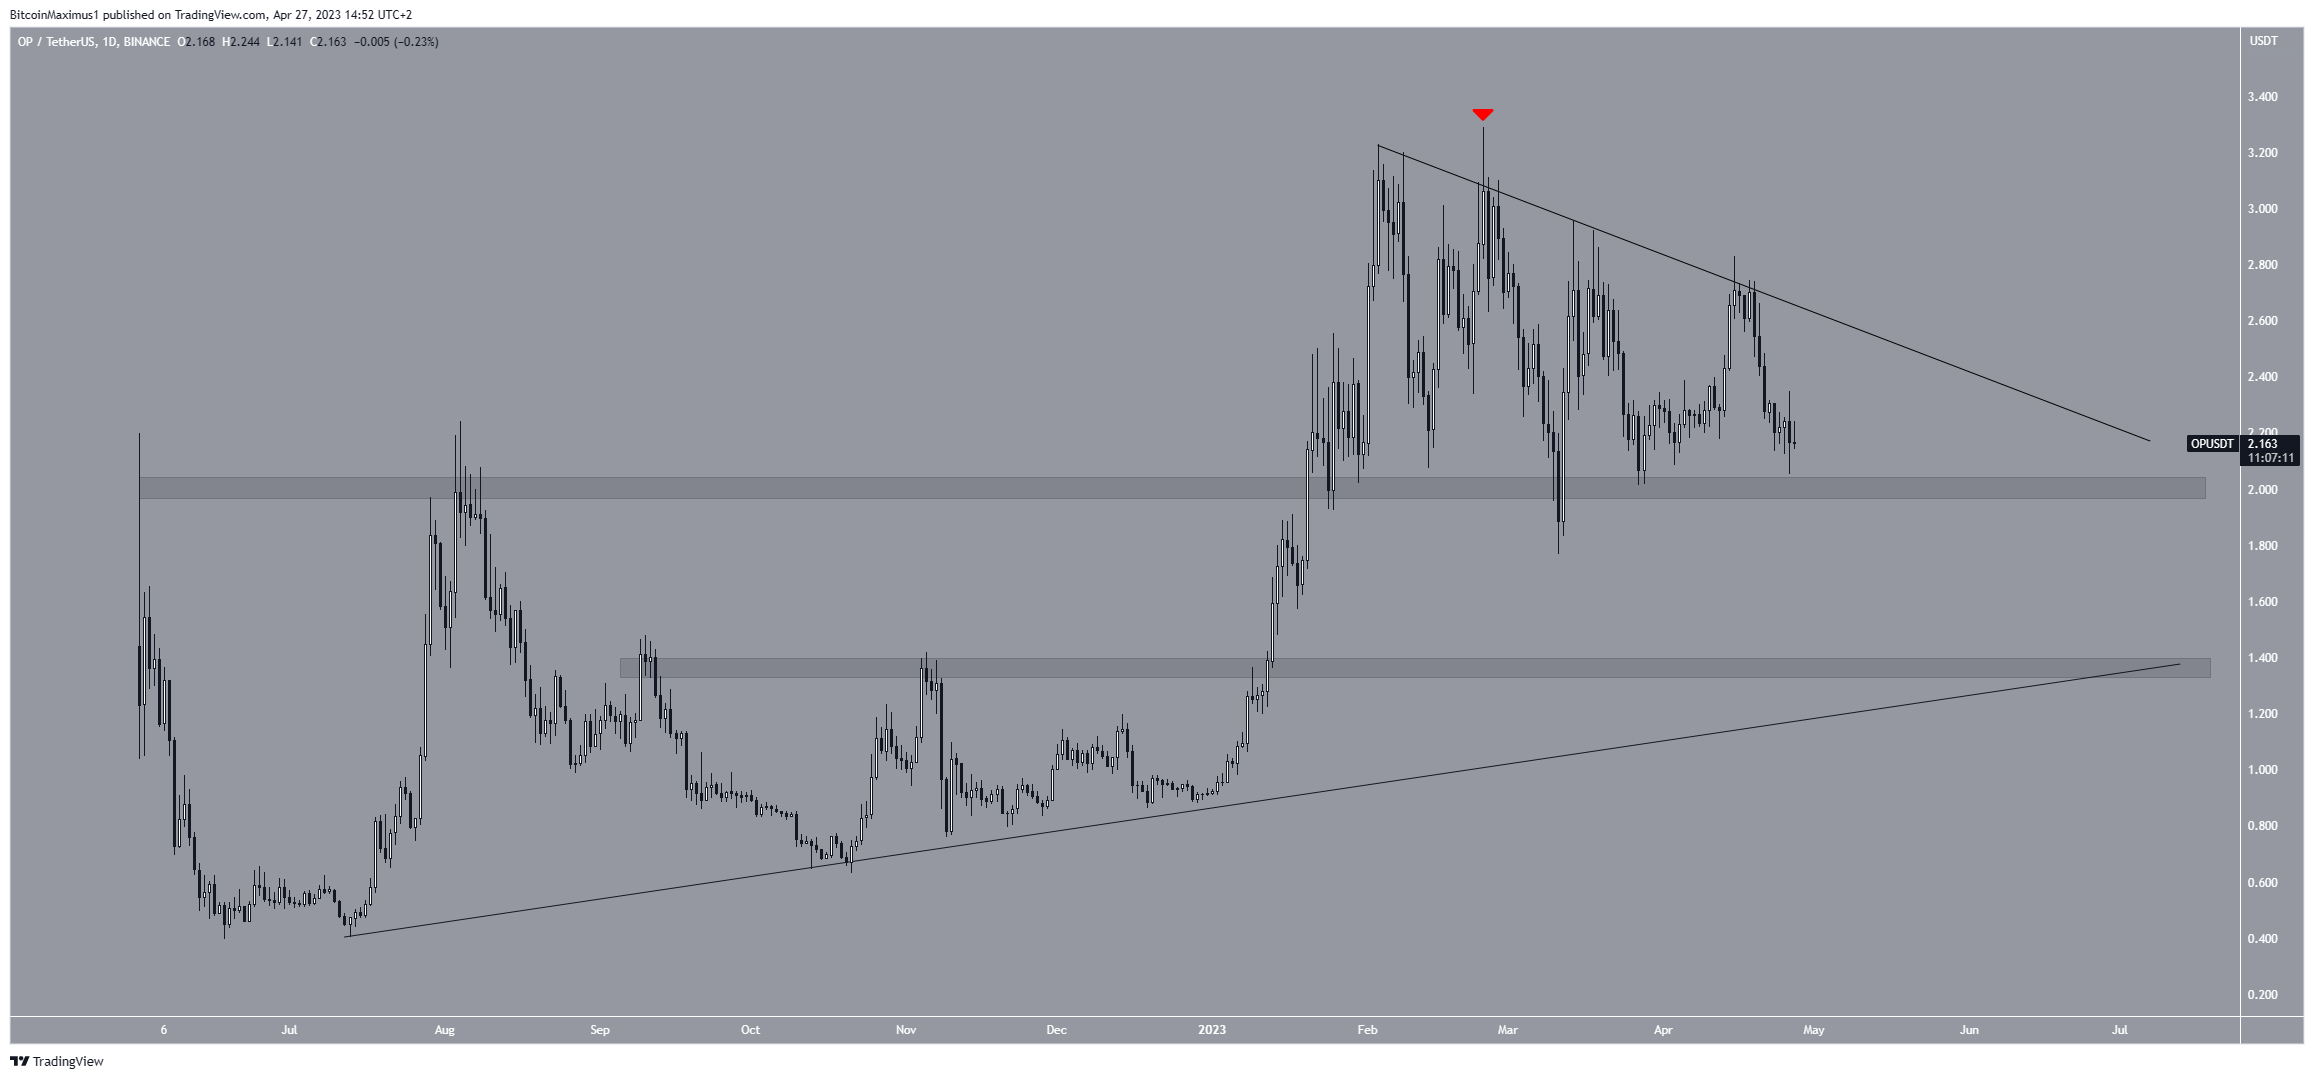
If a breakdown occurs, the OP price could fall to the next closest support at $1.30. The support is created by a horizontal support area and an ascending support line.
On the other hand, if the bearish crypto manages to bounce at the $2.0 area, an increase to the descending resistance line at $2.25 would be possible.
The Graph (GRT) Price Falls After Corrective Structure
The GRT price began an upward movement on March 10. However, it failed to sustain it and reversed the trend on April 21. The decrease caused a breakdown from an ascending support line, suggesting that the upward movement is complete.
Moreover, the preceding increase closely resembles an A-B-C corrective structure. Utilizing the Elliott Wave theory, technical analysts examine long-term price patterns and investor psychology that recur to determine the direction of a trend.
Since the correction faces upwards, it means that the trend is bearish.
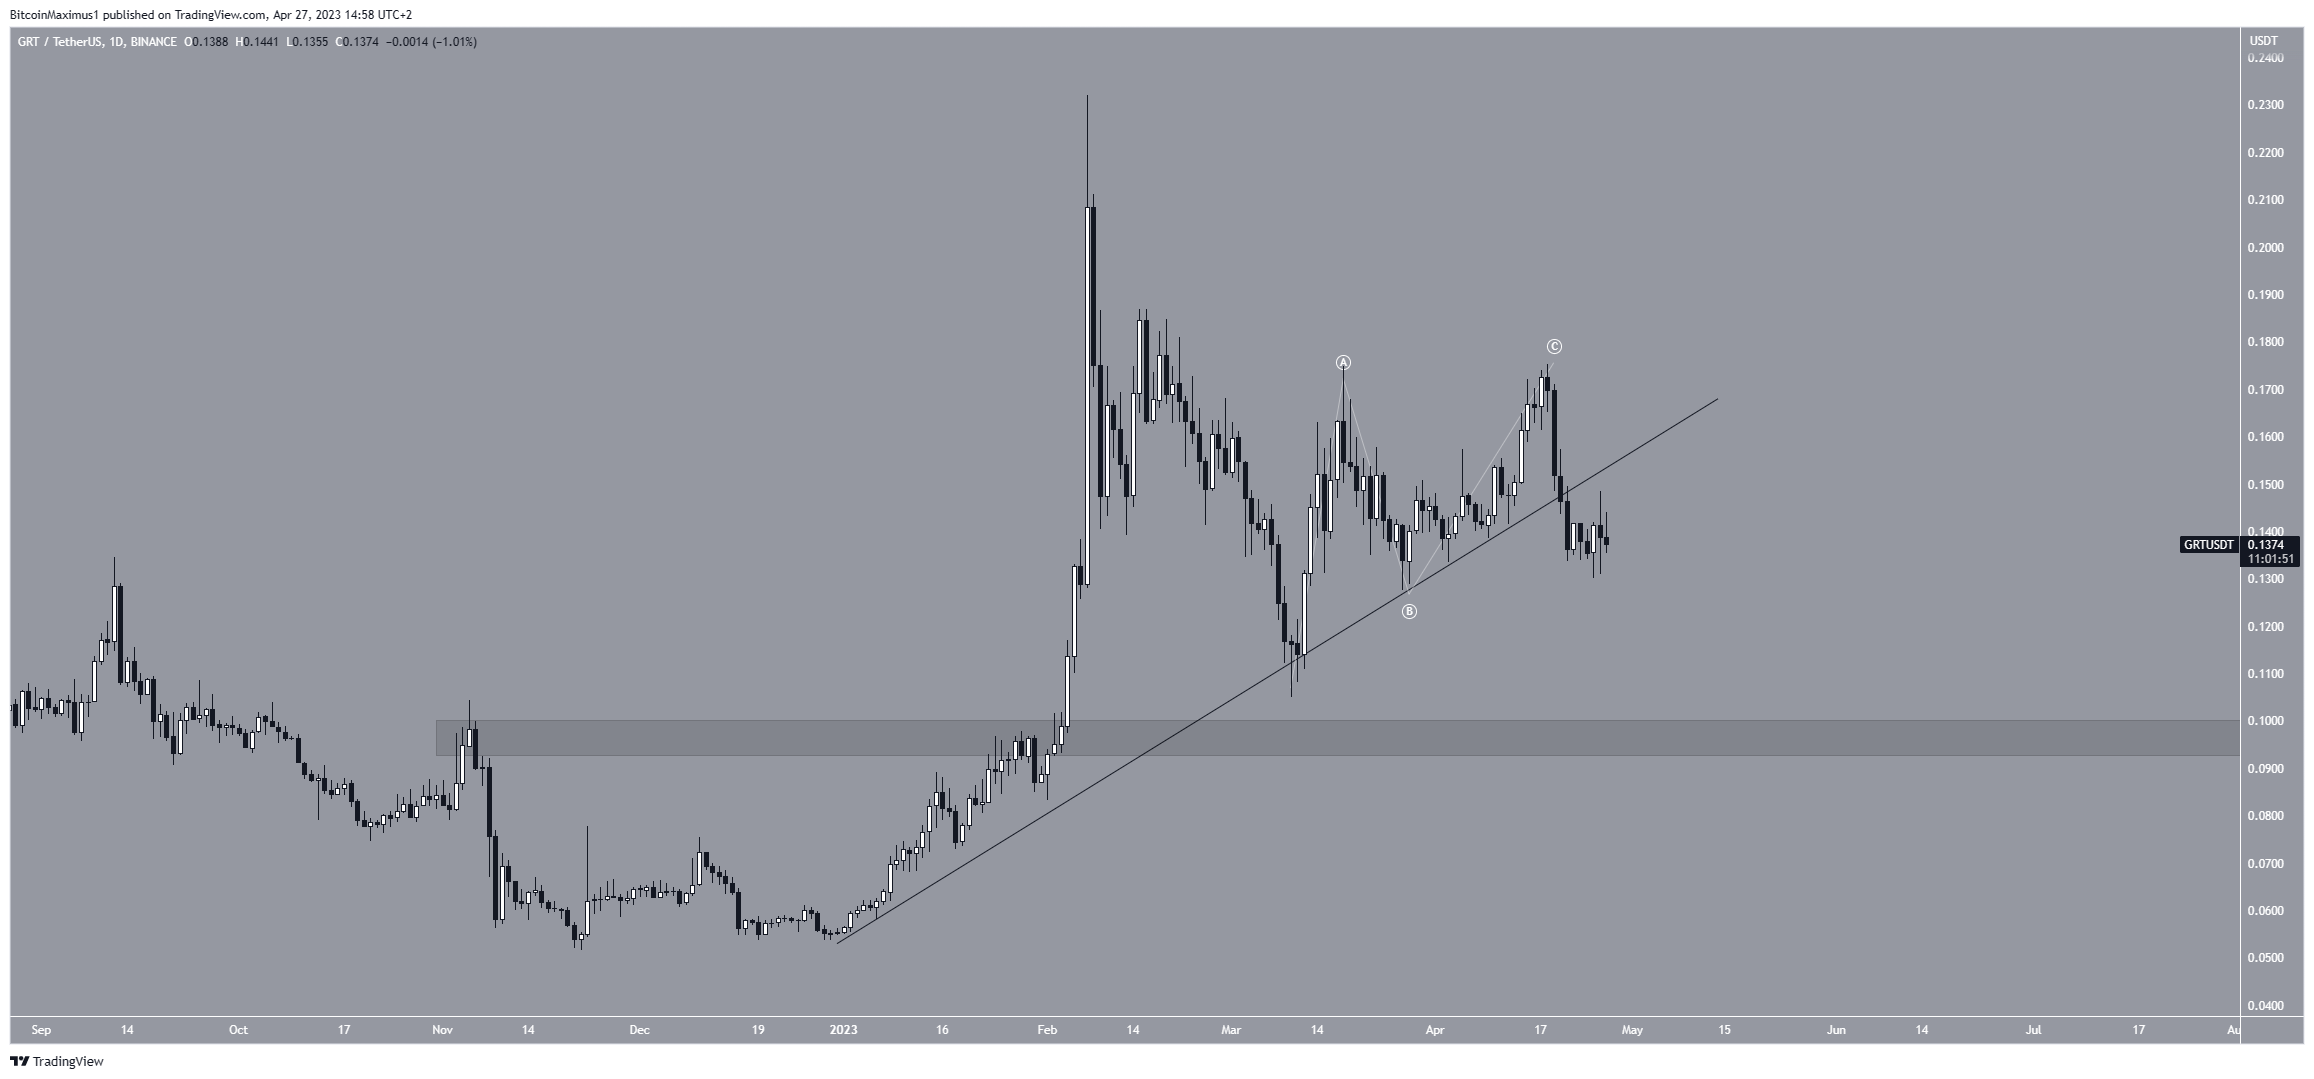
If the decrease continues, the bearish crypto could drop to the next closest support area at $0.095. Reclaiming the ascending support line will invalidate this bearish forecast and could lead to an increase toward $0.22.
For BeInCrypto’s latest crypto market analysis, click here


