
Crypto markets enter the second week of March with several catalysts building across different projects. Network upgrades, large token supply events, and community milestones could introduce volatility in the days ahead. As these developments unfold, three altcoins to watch come into focus.
Each pick is supported by a mix of fundamental triggers and emerging technical setups on the charts.
Polkadot (DOT)
Polkadot is one of the altcoins to watch this week as the network prepares for a major tokenomics update that could reshape its supply dynamics. The upgrade, rolling out around March 12–14, will significantly reduce new DOT issuance and introduce long-term supply controls. Emission cuts often strengthen scarcity narratives in crypto markets, which can influence sentiment around March altcoins if demand remains stable.
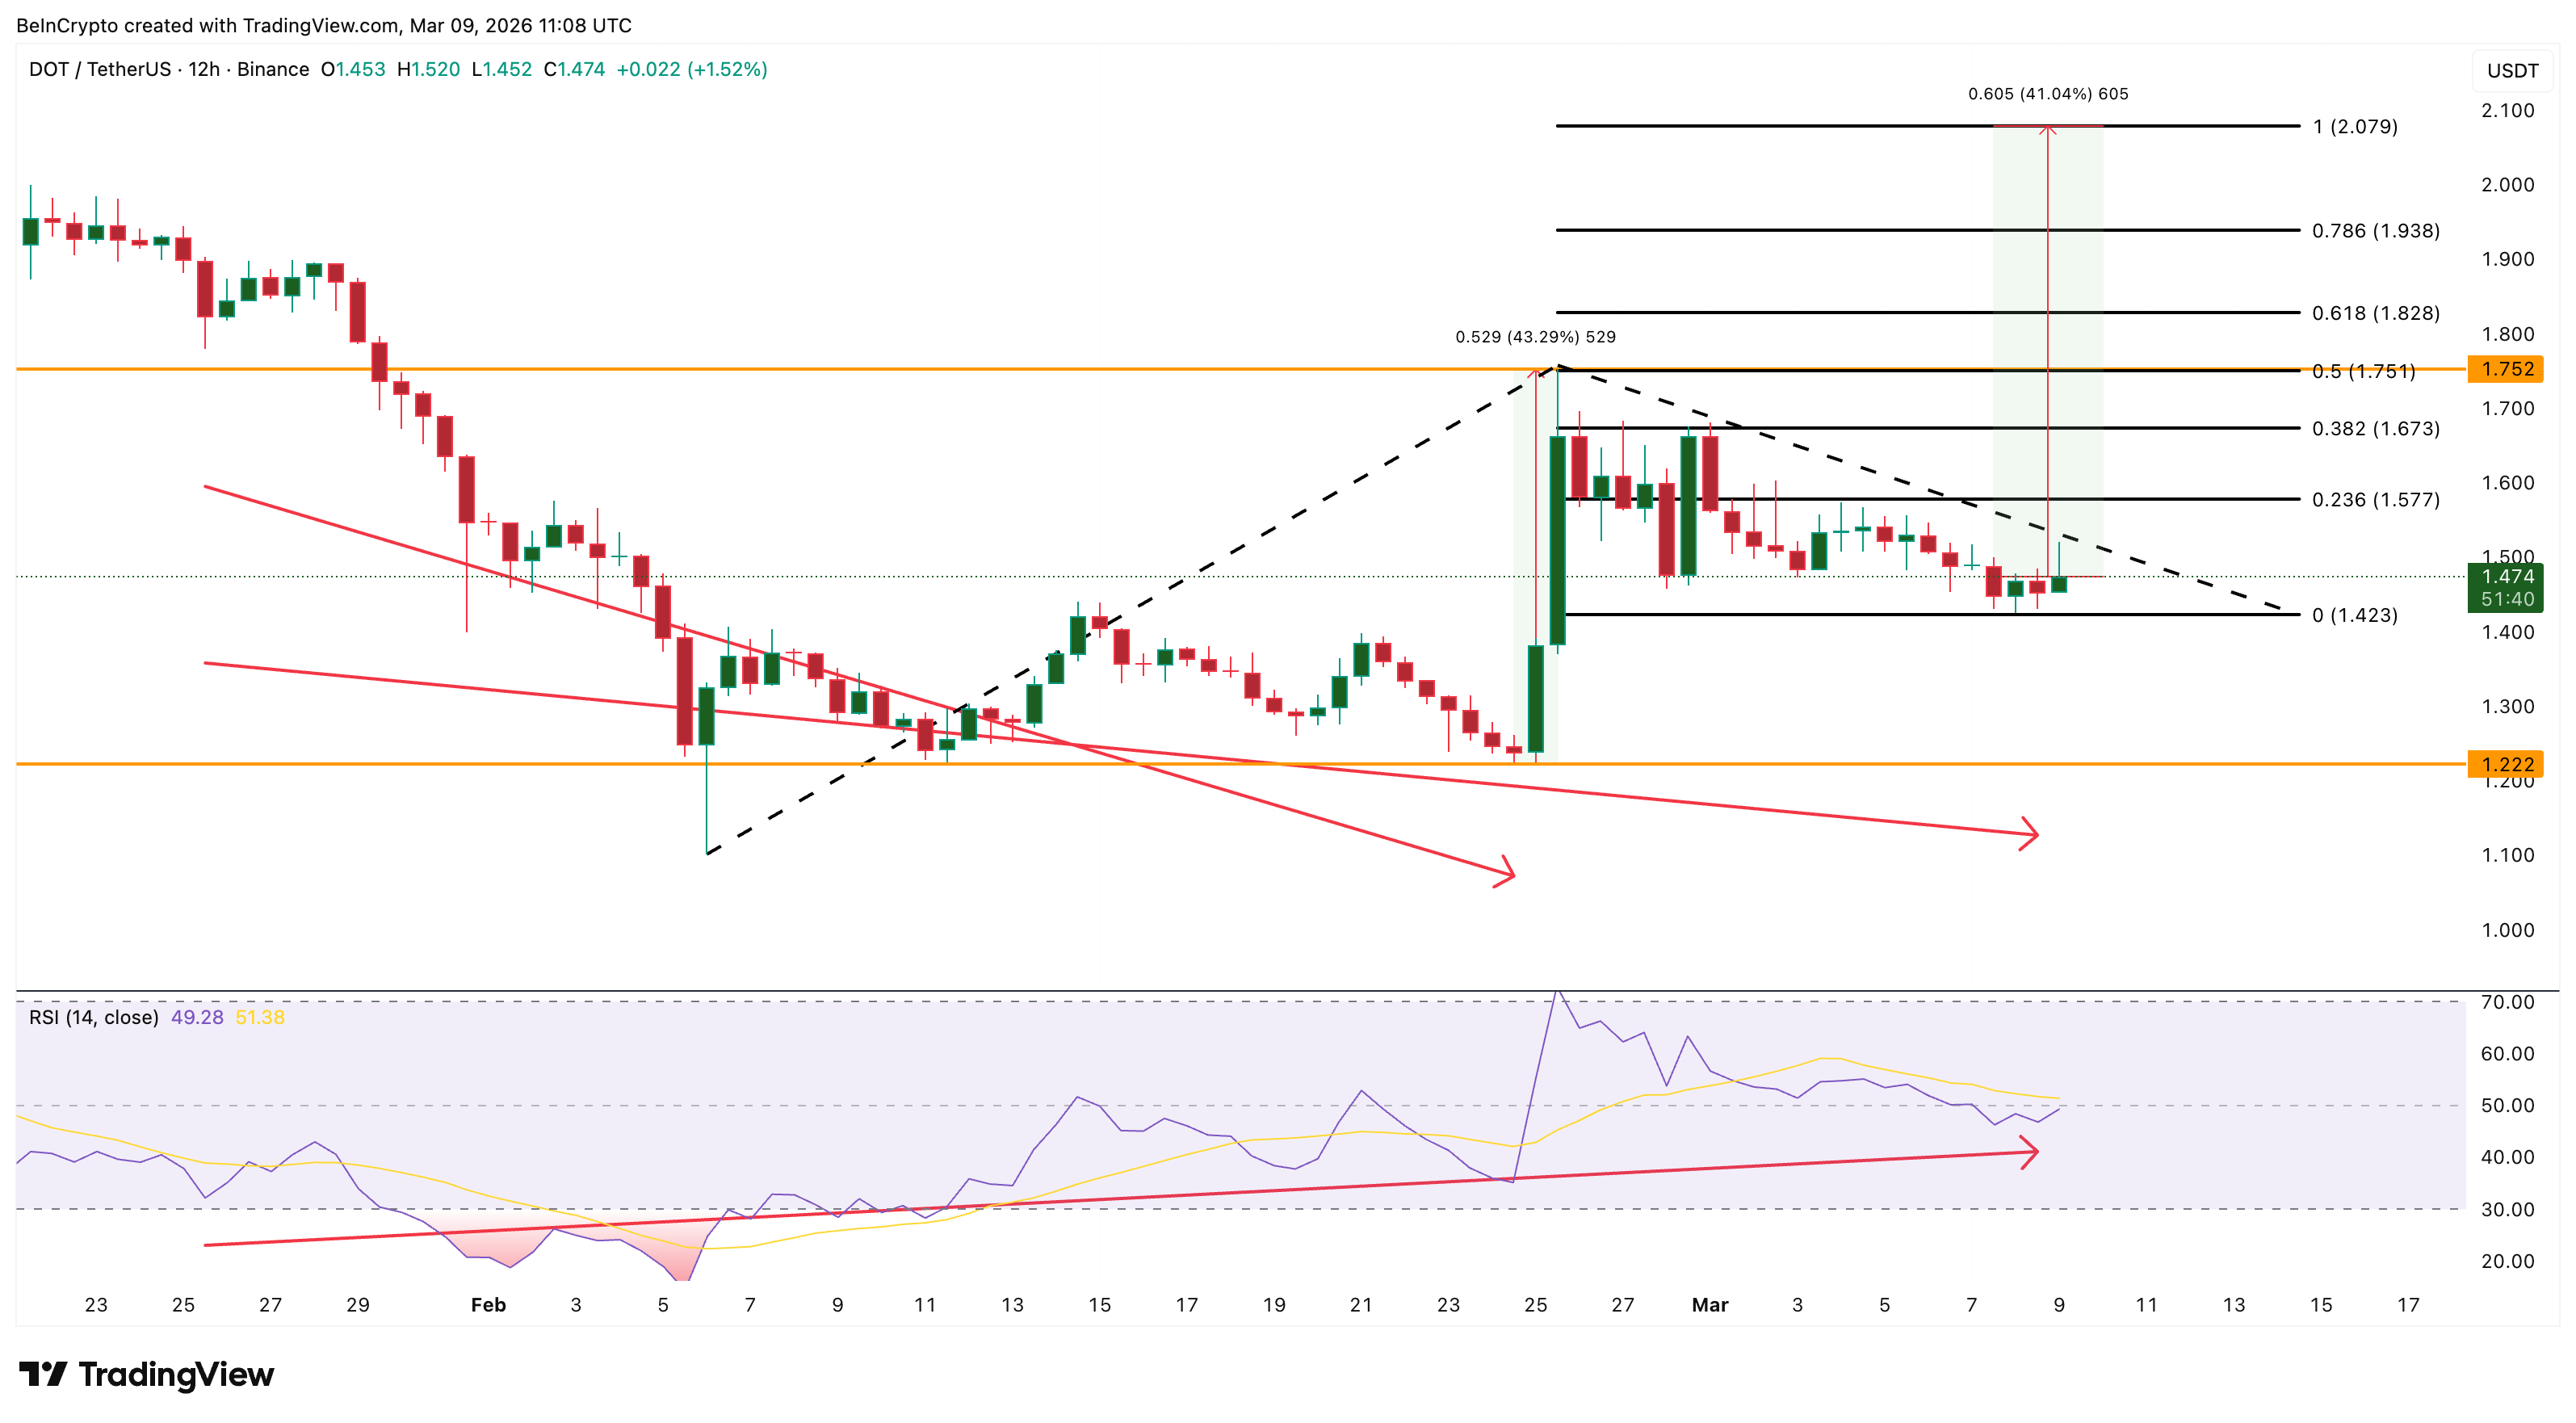
From a price perspective, Polkadot has shown mixed momentum. The token is trading mostly flat recently and remains down roughly 63% over the past year. However, short-term performance has improved, with DOT still up about 10–11% over the past month. The token also staged a sharp 43% rally between February 24 and February 25. It climbed to a local high near $1.75 before entering a corrective phase.
Technically, the chart now shows a potential bullish divergence on the Relative Strength Index (RSI). RSI is a momentum indicator that measures the strength of price movements. Between January 25 and March 8, Polkadot’s price printed a lower low. The RSI, on the other hand, formed a higher low, suggesting selling pressure may be weakening. A similar divergence appeared earlier between January 25 and February 24, just before the 43% rally mentioned above.
Want more token insights like this? Sign up for Editor Harsh Notariya’s Daily Crypto Newsletter here.
If buyers defend the $1.42 support, DOT could attempt another push higher. A breakout above $1.75 resistance may open the path toward $2.07, a move similar in magnitude to the previous rally.
However, the bullish outlook would weaken if DOT loses the $1.42 support. A breakdown below that level could push the price toward $1.22, invalidating the near-term recovery thesis and reinforcing the broader downtrend.
WhiteBIT Coin (WBT)
WhiteBIT Coin (WBT) is another altcoin to watch this week as the market approaches one of the largest token supply events scheduled for March. The token recently gained additional visibility after its Kraken listing went live on March 5, bringing new liquidity and institutional exposure.
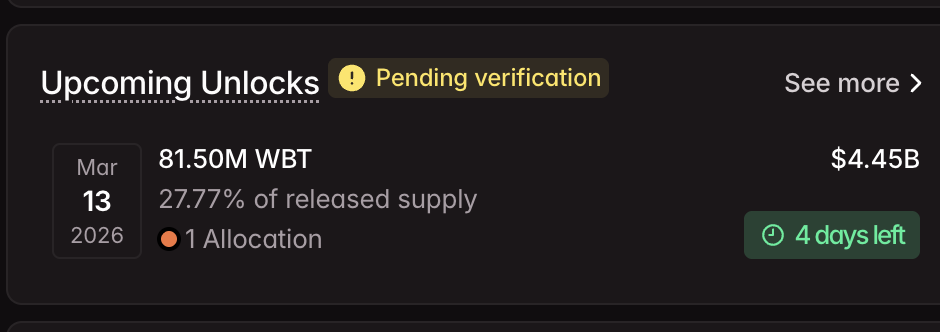
However, the biggest catalyst arrives on March 13. 81.5 million WBT tokens are scheduled to unlock in a cliff release, when a large number of previously locked tokens are released all at once, instead of gradually over time.
At current prices near $52–54, the event represents roughly $4.4 billion worth of tokens, increasing circulating supply by a large margin. Such cliff unlocks often introduce short-term selling pressure, making WBT one of the most closely watched March altcoins this week.
Despite the upcoming supply event, the technical structure remains bullish on the 12-hour chart. WBT has gained about 11% over the past seven days and remains up roughly 90% year-on-year, highlighting a strong broader trend.
Between February 28 and March 6, the token rallied nearly 20%, forming a sharp upward move that now appears to be consolidating in what resembles a bullish flag pattern.
If buyers push the WBT price above $55, the flag breakout could trigger a move toward $66.
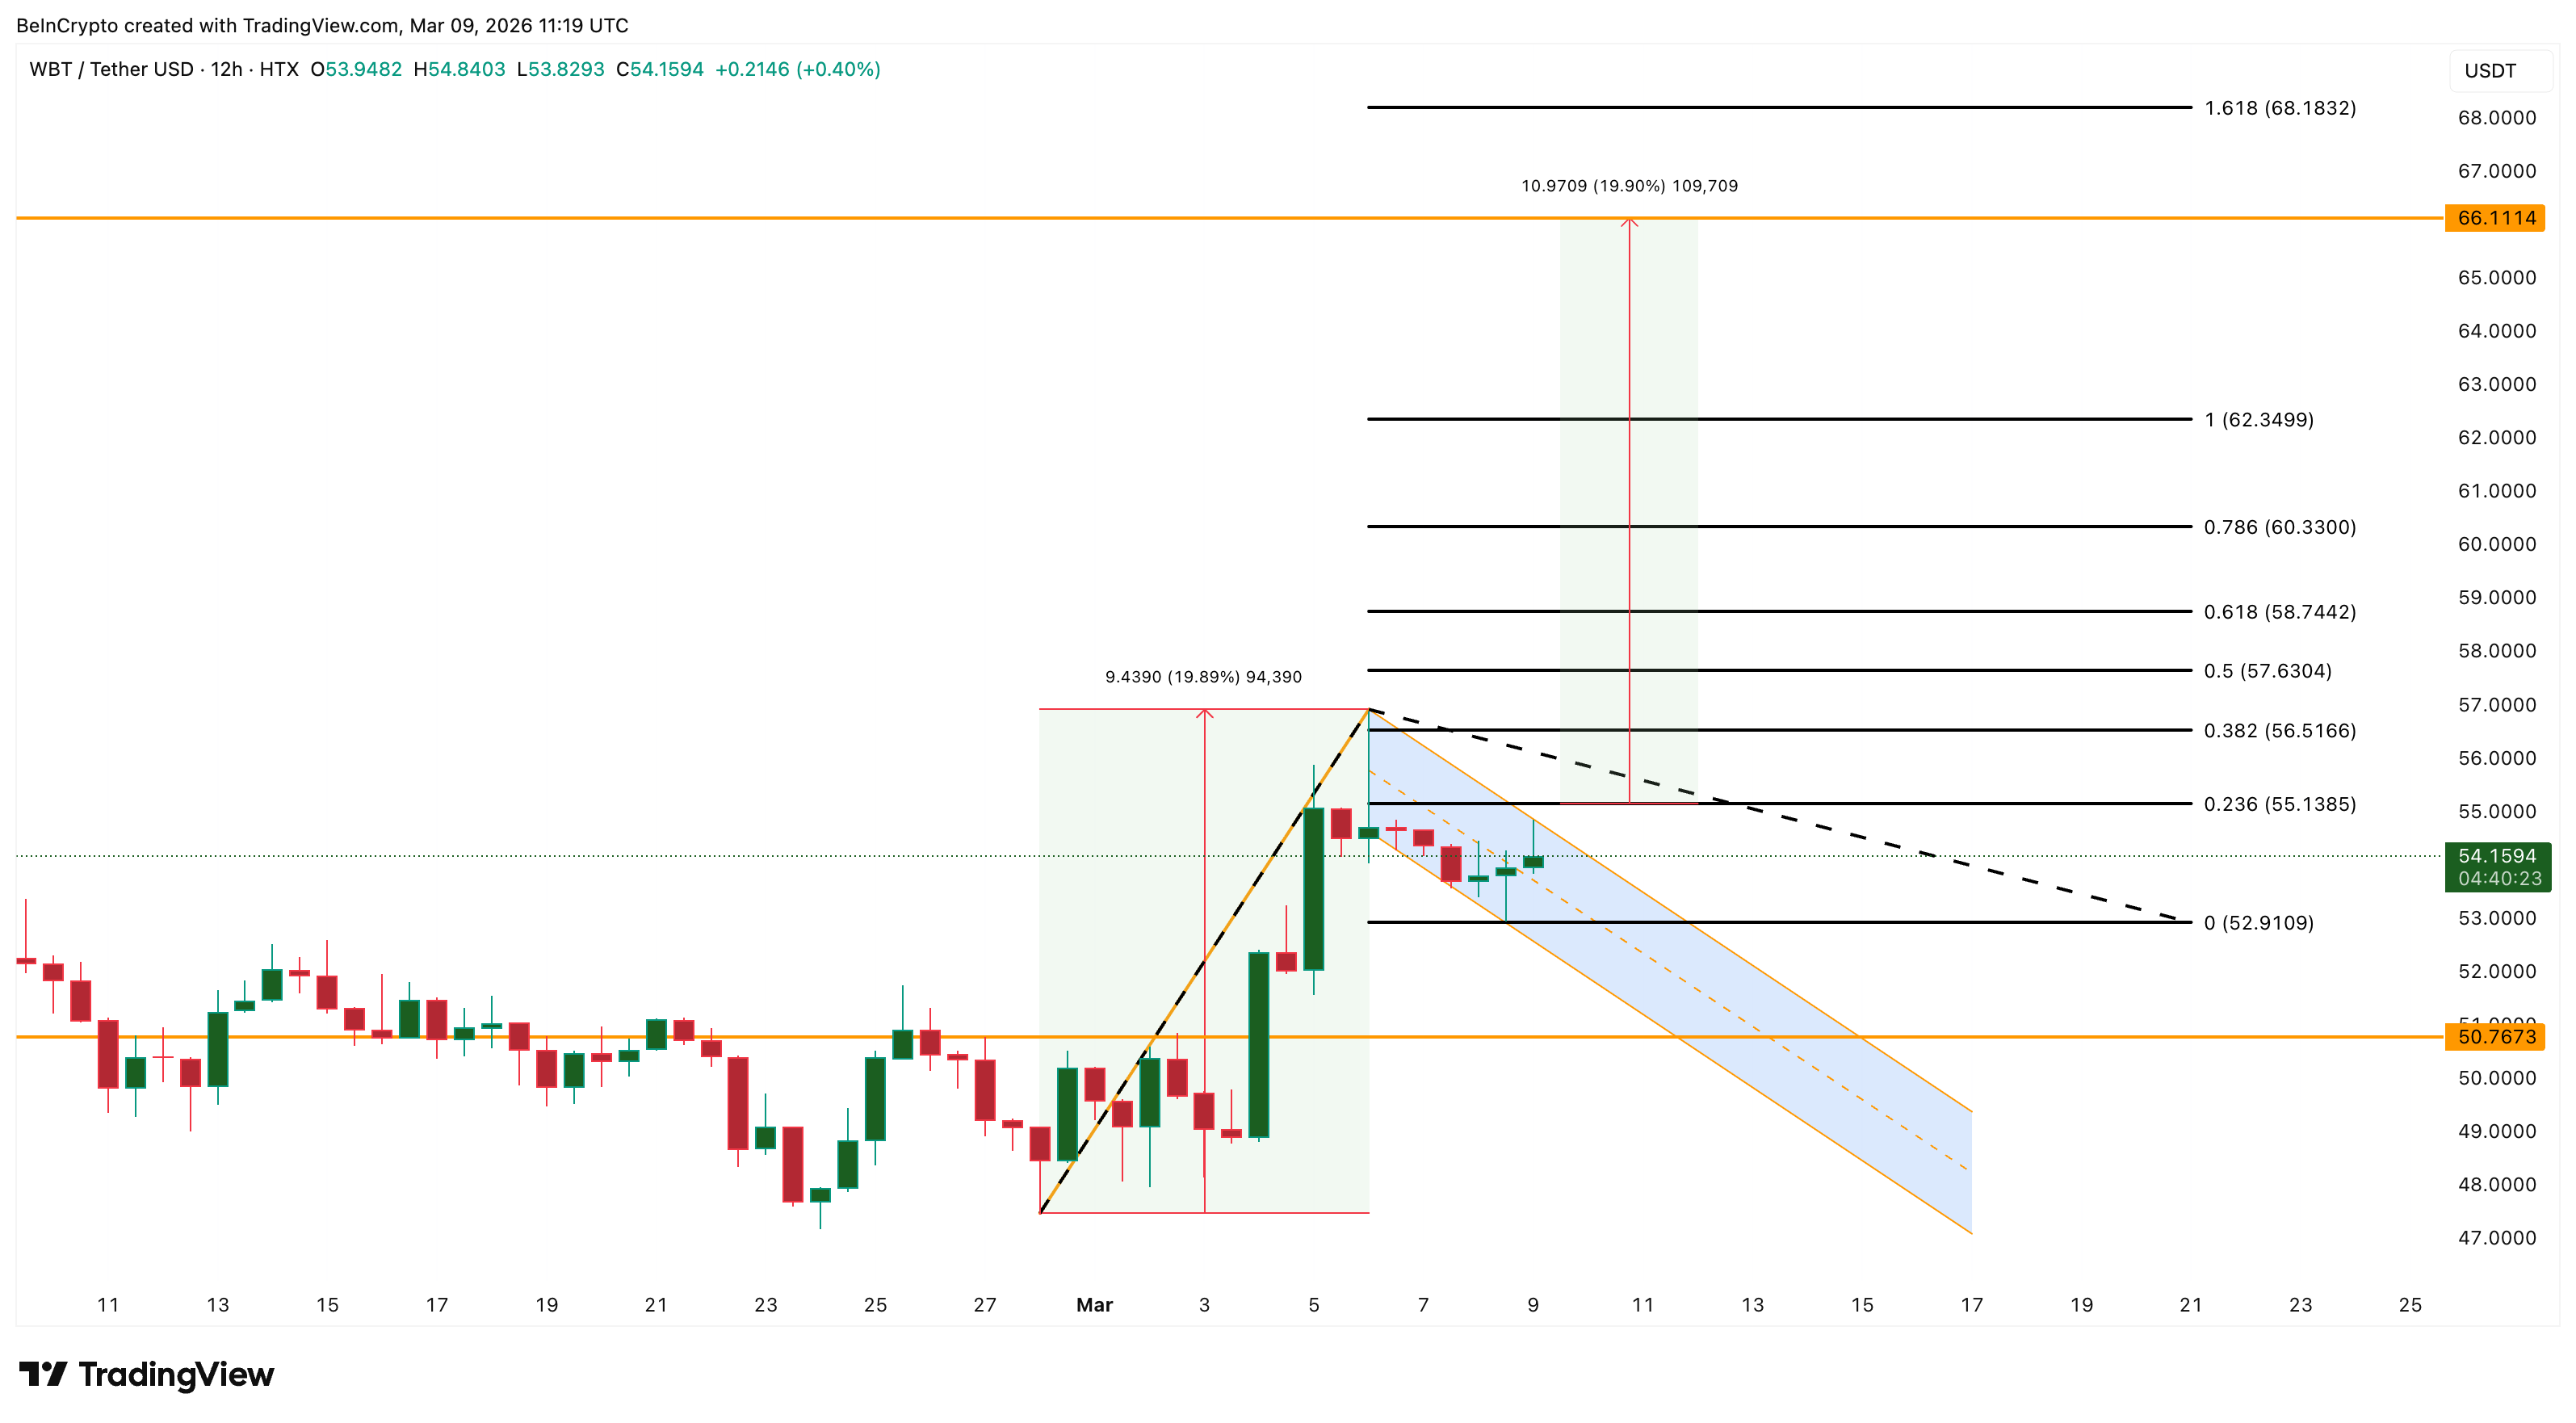
However, the token unlock introduces uncertainty. If selling pressure intensifies after the release, the structure could weaken. A drop below $52 would damage the bullish setup, while a deeper move under $50 would invalidate the pattern and signal a stronger corrective phase.
Pi Coin (PI)
Pi Network’s Pi Coin is another altcoin to watch this week as several ecosystem milestones converge around the middle of March. The project is currently undergoing a multi-step mainnet protocol upgrade, with node operators required to complete migrations before a March 12 deadline to remain connected to the network. The timing is significant because it arrives just ahead of Pi Day on March 14, an annual community milestone that has historically triggered increased activity and speculation around the project.
These developments come at a time when Pi’s market structure has started to improve. The token is up roughly 27% over the past seven days. It is also up about 49% over the past month, suggesting renewed interest after months of weak performance. Despite the recent rebound, Pi still trades more than 90% below its historical all-time high. This highlights the large recovery gap that remains.
Technically, PI recently staged a strong rally. Between February 23 and March 7, the price climbed about 54%, peaking near $0.239 before entering a consolidation phase. The current structure resembles a bull flag pattern, a continuation setup that forms when price pauses inside a downward channel after a sharp rally.
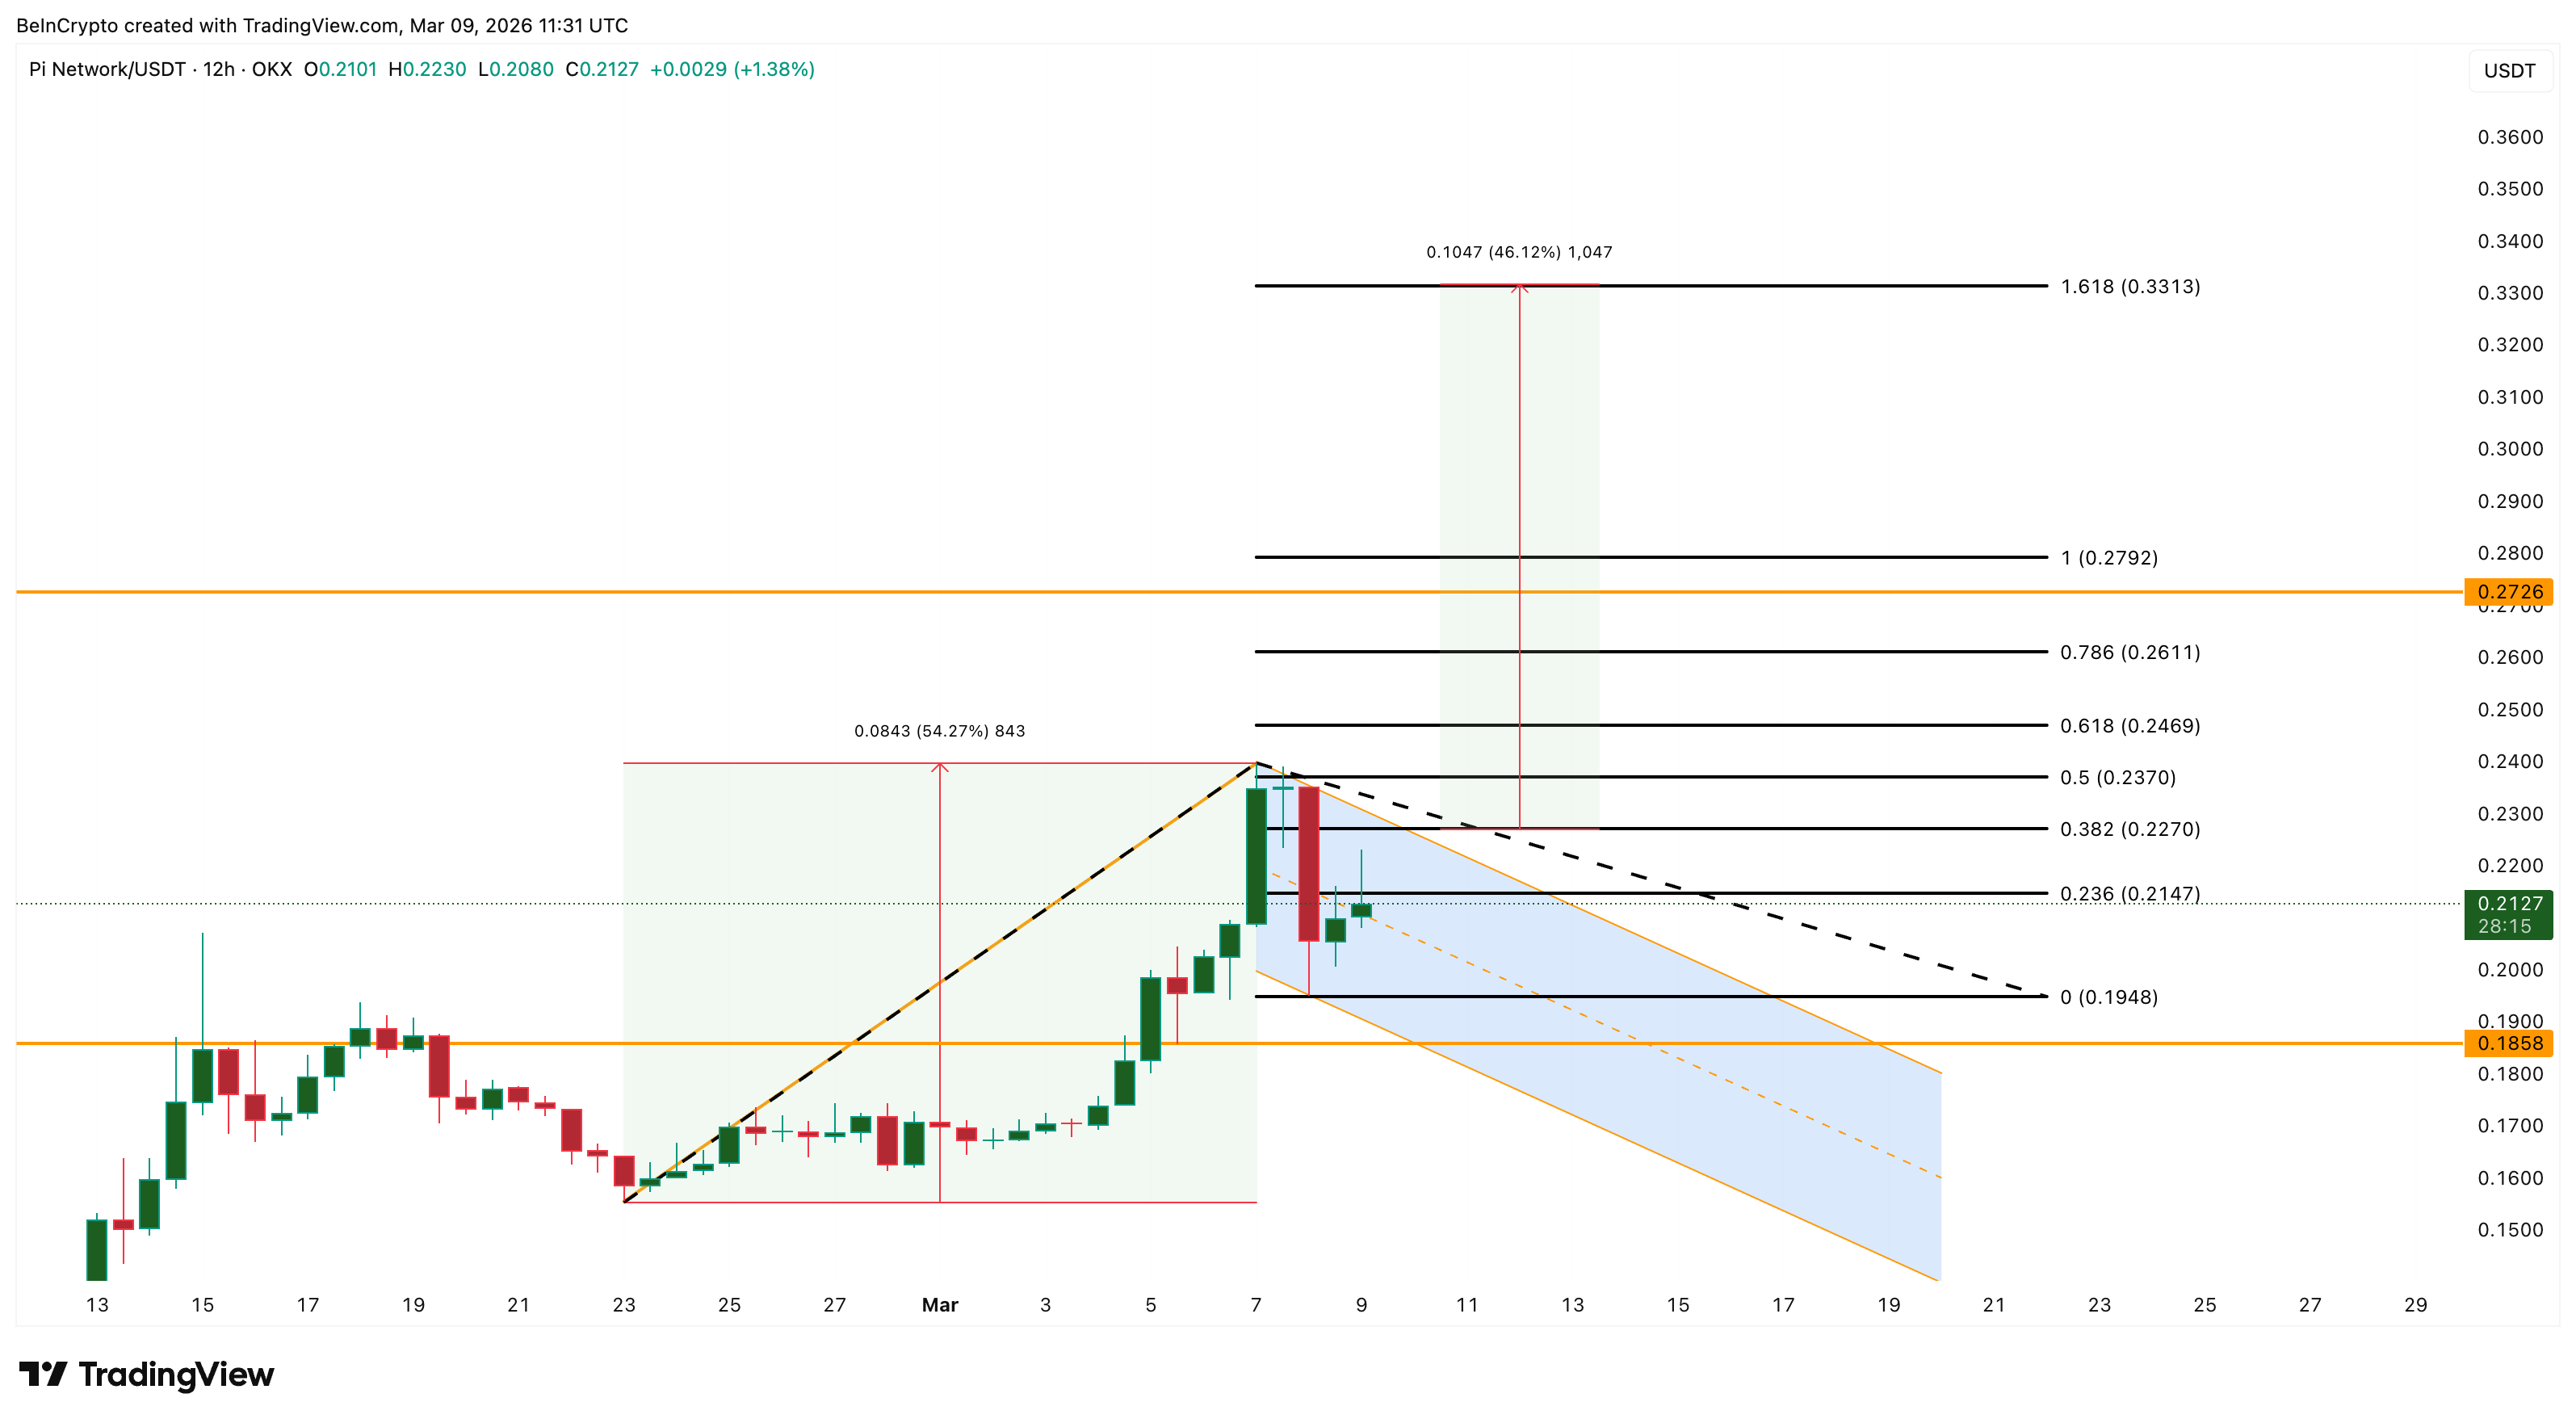
If bullish momentum continues, Pi would first need to reclaim the $0.227 level on a 12-hour close. This level acts as the neckline of the pattern. A successful breakout could trigger another strong move, potentially pushing the price toward $0.331 or higher. That would represent roughly 45% upside from the critical $0.227 breakout confirmation level.
However, the setup would weaken if PI falls below $0.194, signaling fading momentum. A deeper decline under $0.185 could invalidate the bullish structure entirely and suggest that the recent rally was only a rebound.
