

EOS, TRON (TRX) and Ethereum (ETH) have broken out above significant resistance levels or are very close to doing so.
A considerable number of altcoins have posted significant increases in the month of December. In lieu of this, we are going to take a look at three coins that we believe can post similar gains in the coming weeks. These are:
- EOS (EOS)
- Tron (TRX)
- Ethereum (ETH)
EOS (EOS)
EOS bounced at the 3000 satoshi support area in September and has been increasing since. It has already broken out above the first resistance area and is in the process of moving upward. The previous breakdown level is found at 5100 satoshis and presents the closest target for the upcoming increase. The resistance area at 7500 satoshis presents an optimistic, but not unreachable, target.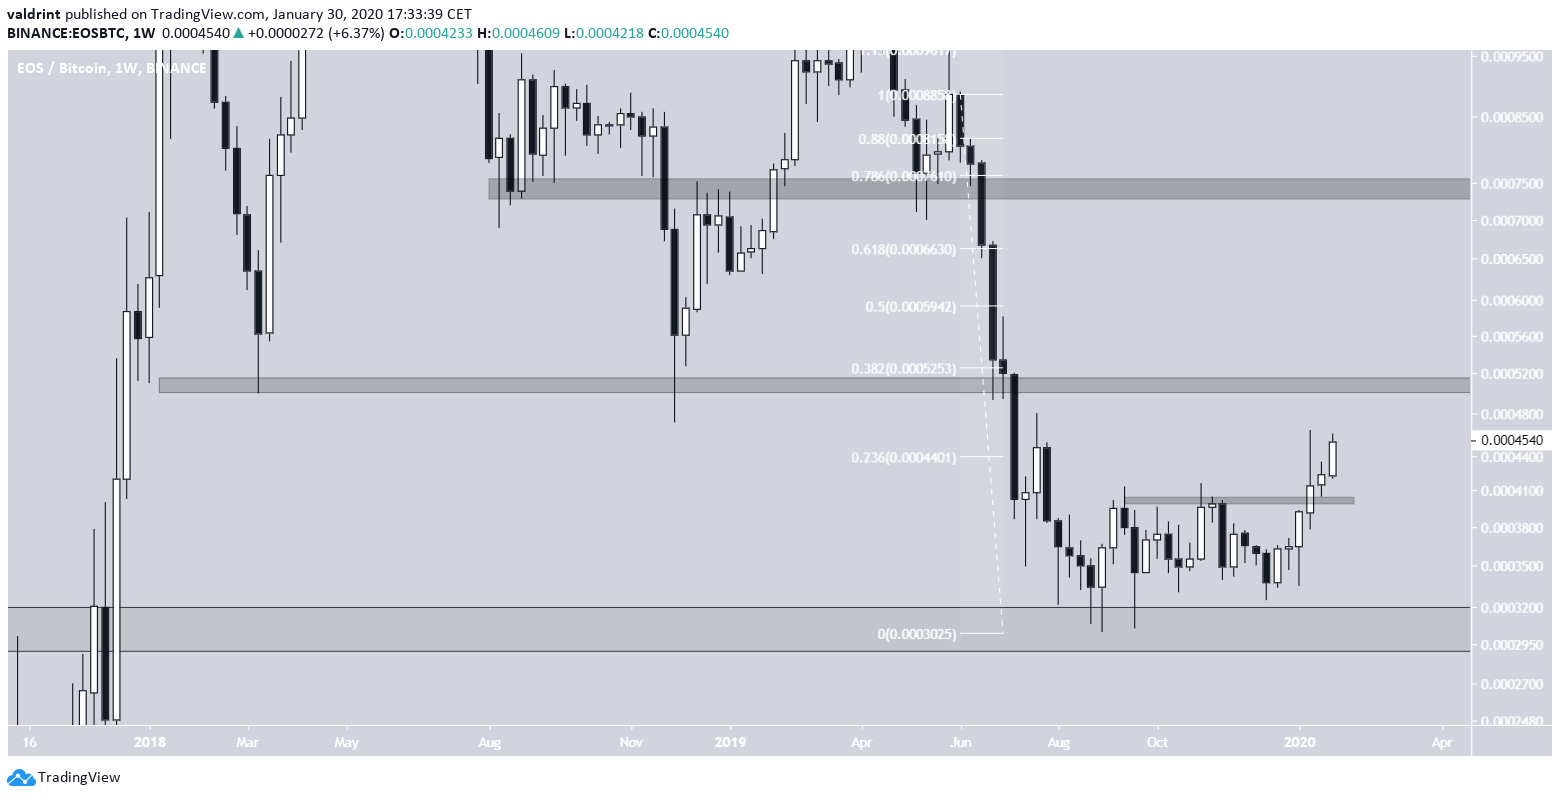 Since the breakout on January 14, the EOS price has validated the resistance area of 4000 satoshis as support and began to move upward. It is currently in the process of creating a bullish engulfing candlestick that could break out above the previous high, which took the form of a wick.
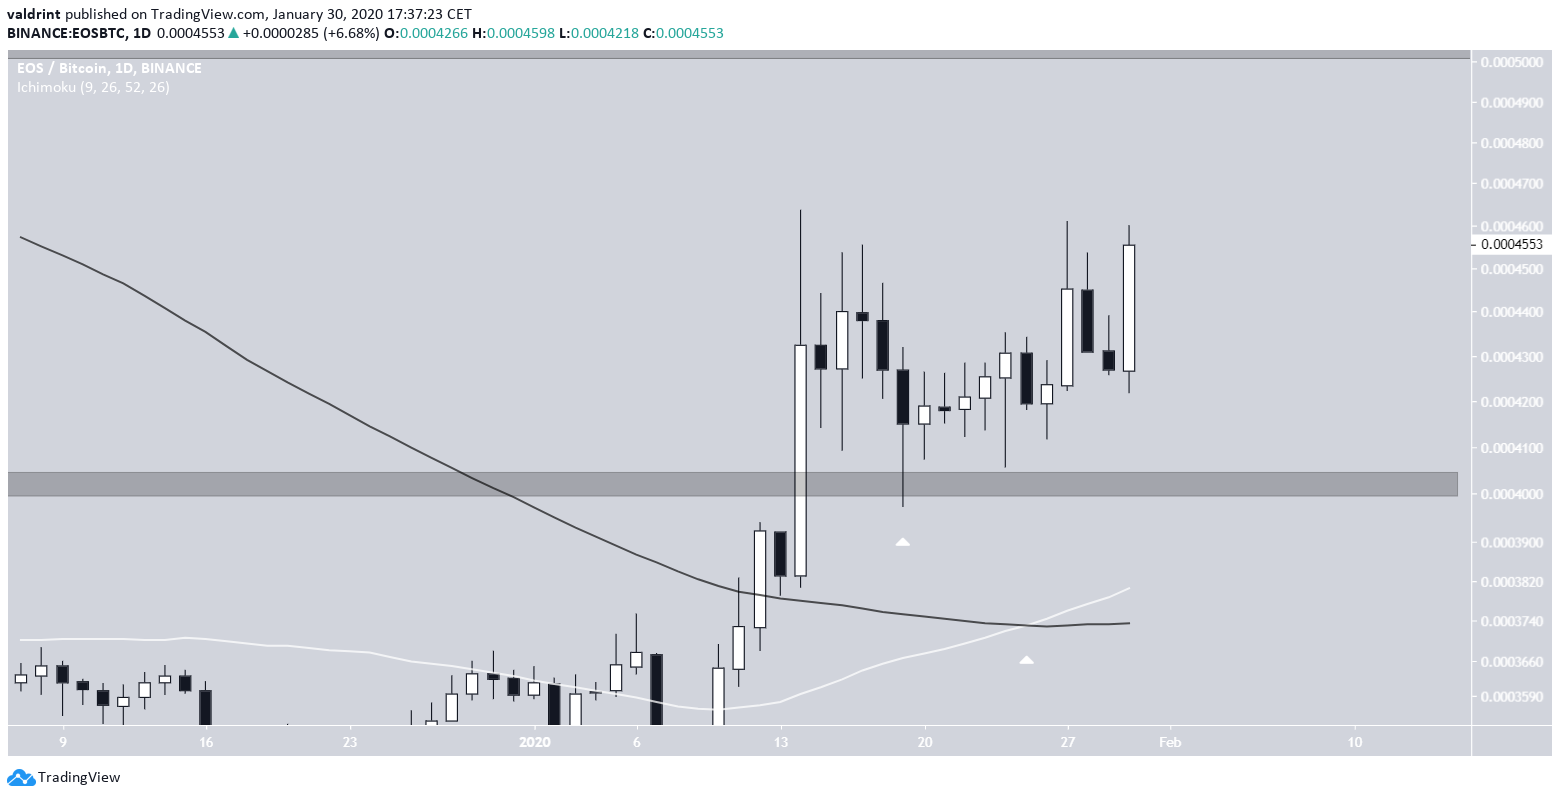
There is a bullish cross between the 50- and 200-day moving averages (MAs) that just transpired, which supports the possibility of the price moving upward towards the next resistance area.
Since the breakout on January 14, the EOS price has validated the resistance area of 4000 satoshis as support and began to move upward. It is currently in the process of creating a bullish engulfing candlestick that could break out above the previous high, which took the form of a wick.
There is a bullish cross between the 50- and 200-day moving averages (MAs) that just transpired, which supports the possibility of the price moving upward towards the next resistance area.
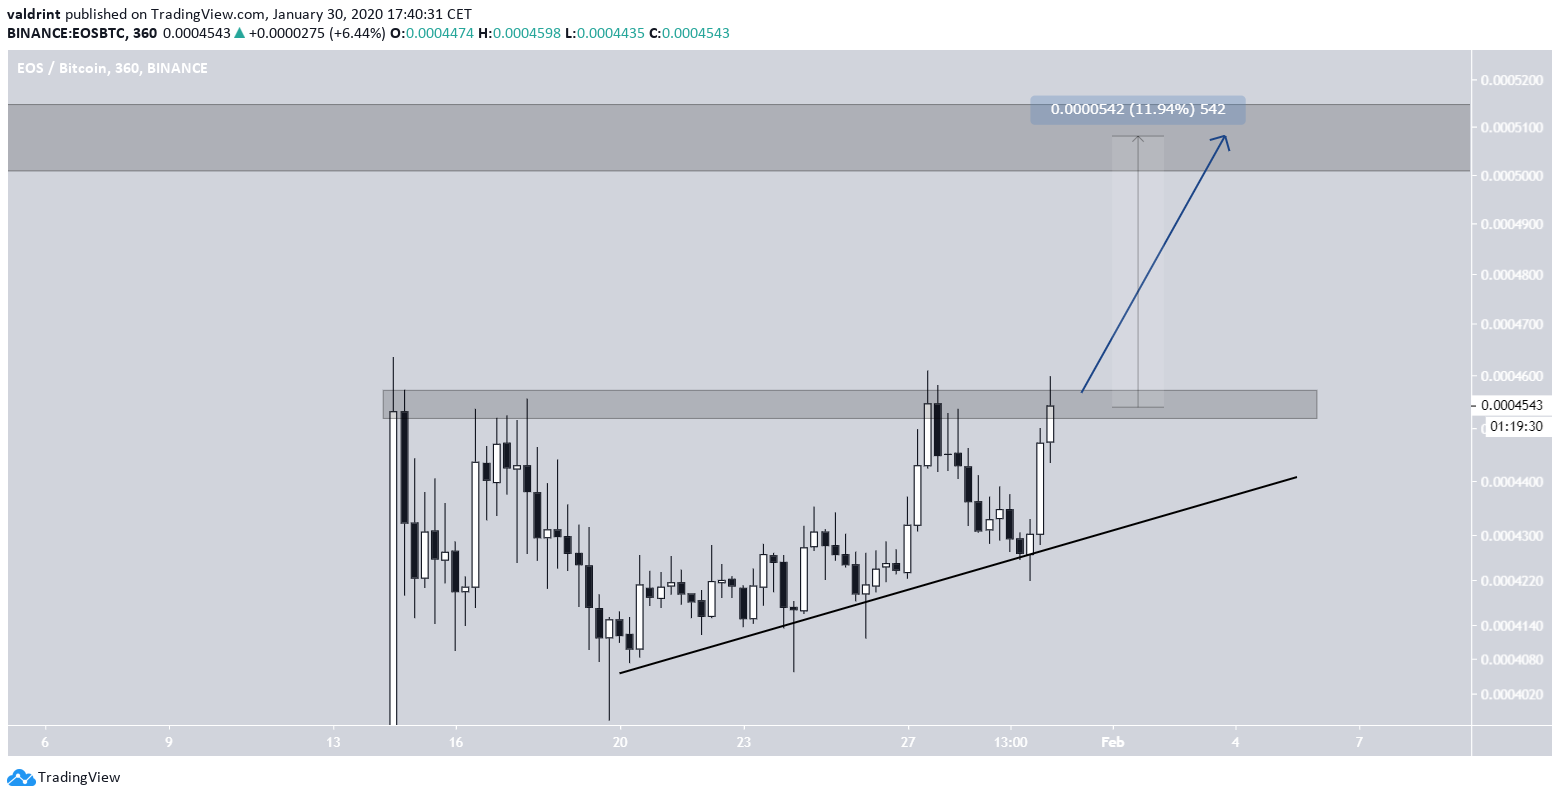
 The six-hour chart reveals a possible ascending triangle in development, which would likely cause the EOS price to break out upwards.
The closest target would be at 5200 satoshis, a 12 percent increase from the current price level.
The six-hour chart reveals a possible ascending triangle in development, which would likely cause the EOS price to break out upwards.
The closest target would be at 5200 satoshis, a 12 percent increase from the current price level.
EOS Price Conclusions
- Long-term upward move has begun.
- Short-term breakout is in the making.
- The closest target found at 5200 satoshis.
- Next target at 7500 satoshis.
TRON (TRX)
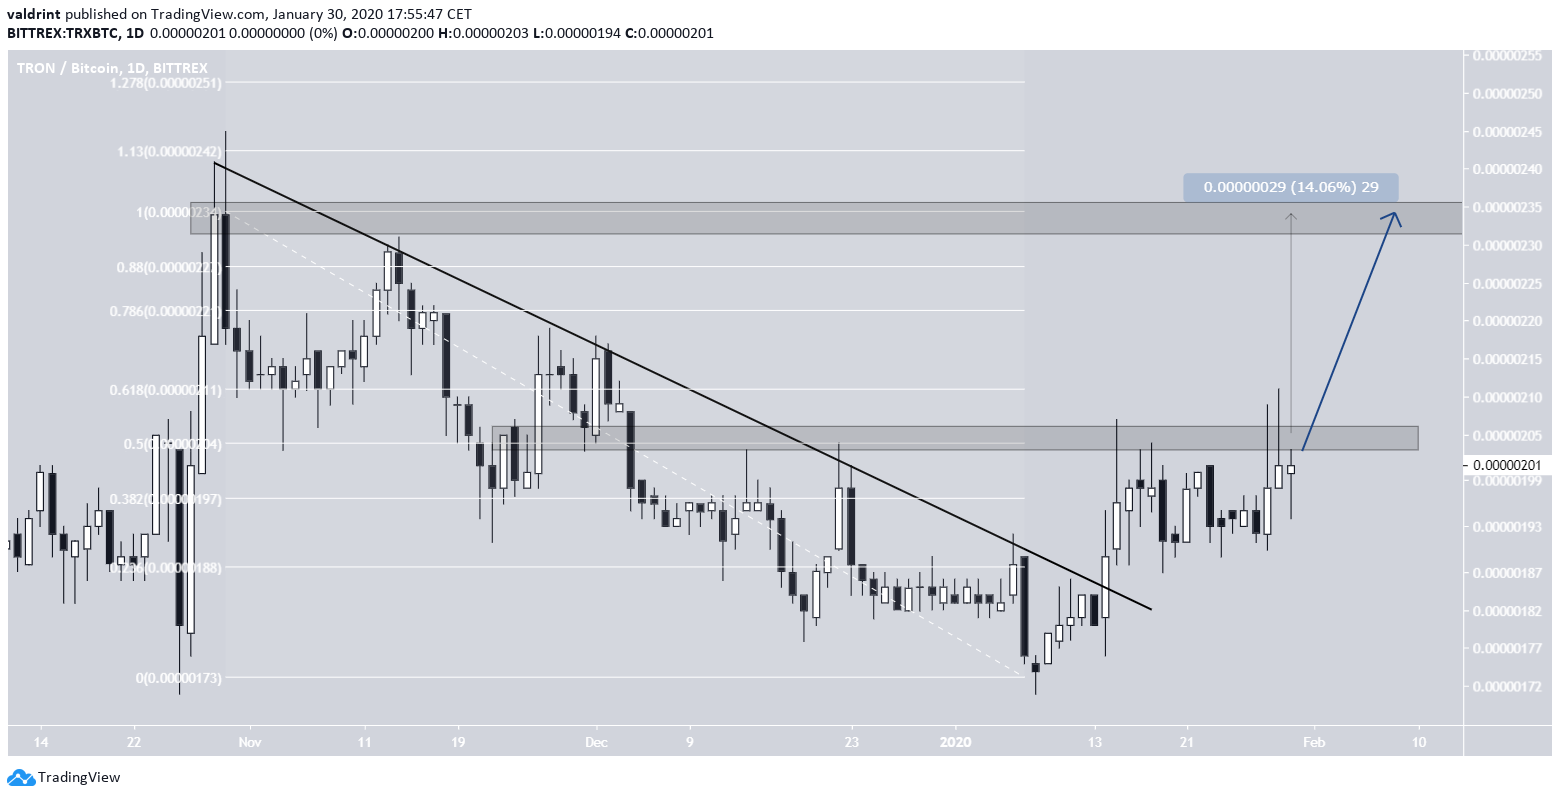
The TRX price movement also shows a price breakout — this time, from a descending resistance line. The price has been moving upwards since the breakout. The 50- and 200-day moving averages are very close to making a bullish cross — a very positive sign. Going just by this cross alone, the EOS price movement is slightly ahead relative to that of TRX. Finally, the daily RSI is comfortably above the 50 line and seemingly using it as support.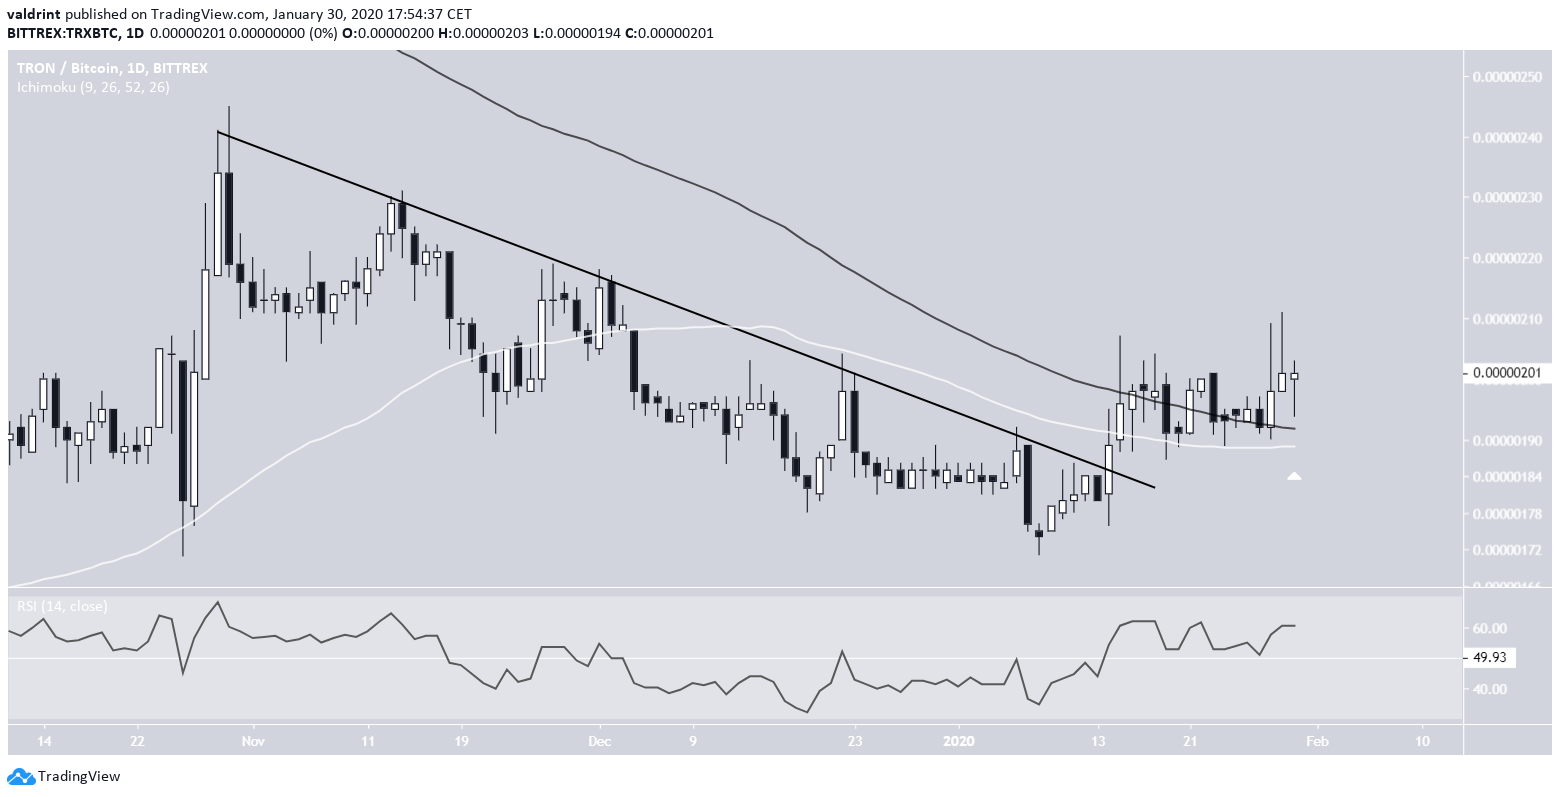 In the short-term, the TRON price is attempting to move above the 205-satoshis minor resistance area. Afterward, the next resistance area is found at 235 satoshis — the top of the descending resistance line that is 14 percent above the current price level.
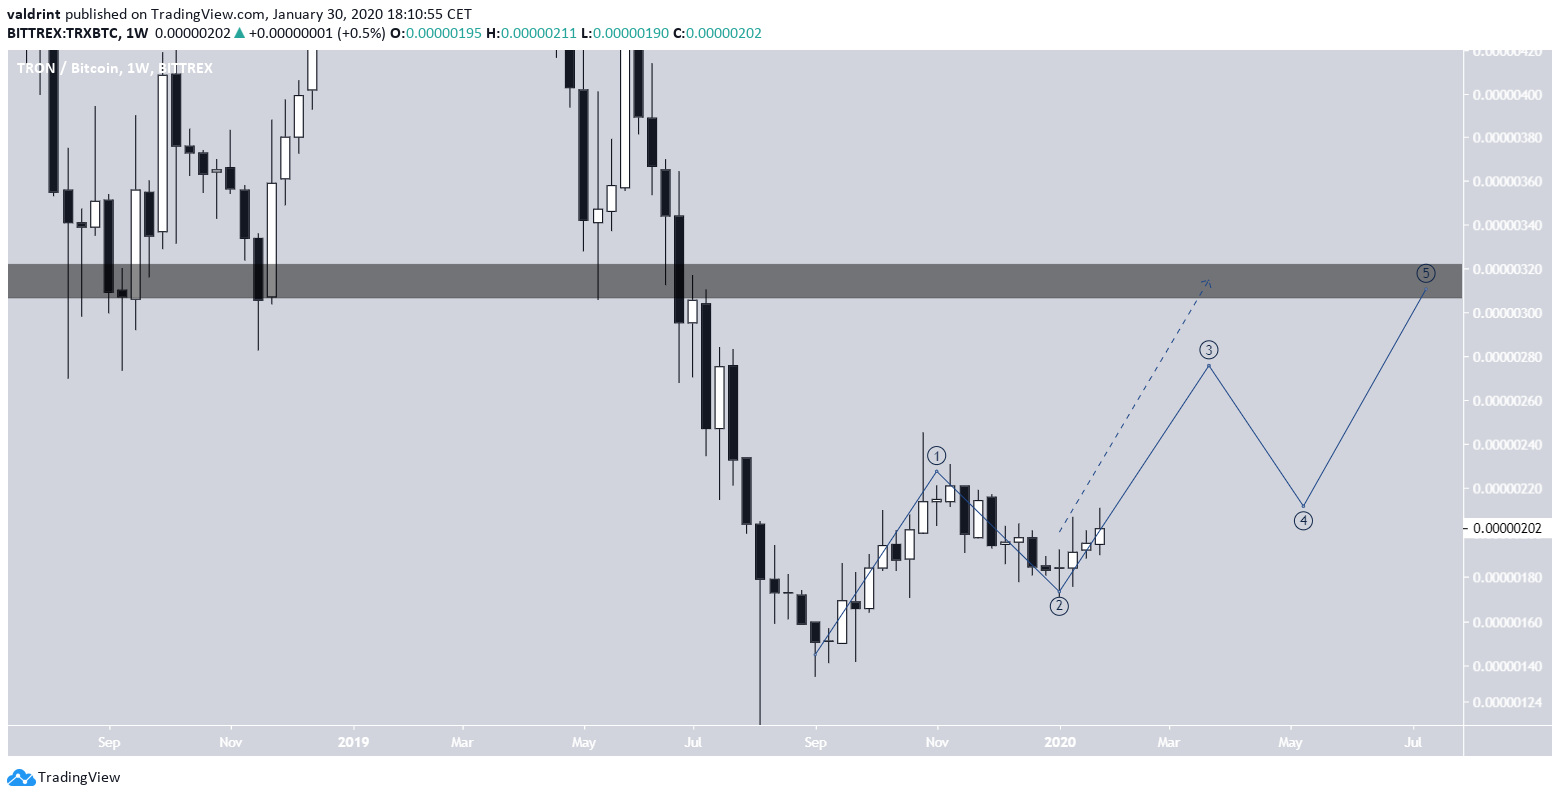
 For the longer-term, we think that the TRX price is in the process of completing a five-wave Elliot formation towards the breakdown level at 320 satoshis.
While it is expected that the price will take its time in reaching this target, an extended third wave that goes all the way to this resistance area is not ruled out completely.
For the longer-term, we think that the TRX price is in the process of completing a five-wave Elliot formation towards the breakdown level at 320 satoshis.
While it is expected that the price will take its time in reaching this target, an extended third wave that goes all the way to this resistance area is not ruled out completely.
TRON Price Conclusions
- Long-term upward move has begun.
- Price has likely finished short-term correction.
- Closest target found at 235 satoshis.
- Long-term target of 320 satoshis.
Ethereum (ETH)
The Ethereum price reached the ₿0.0165 support area in September 2019, an area that historically had significance for the Ethereum price movement. After initiating an upward move, ETH began to decrease inside the shape of a descending channel. We think the price will soon break out from this pattern and head towards the ₿0.026 resistance, which was also the previous breakdown level.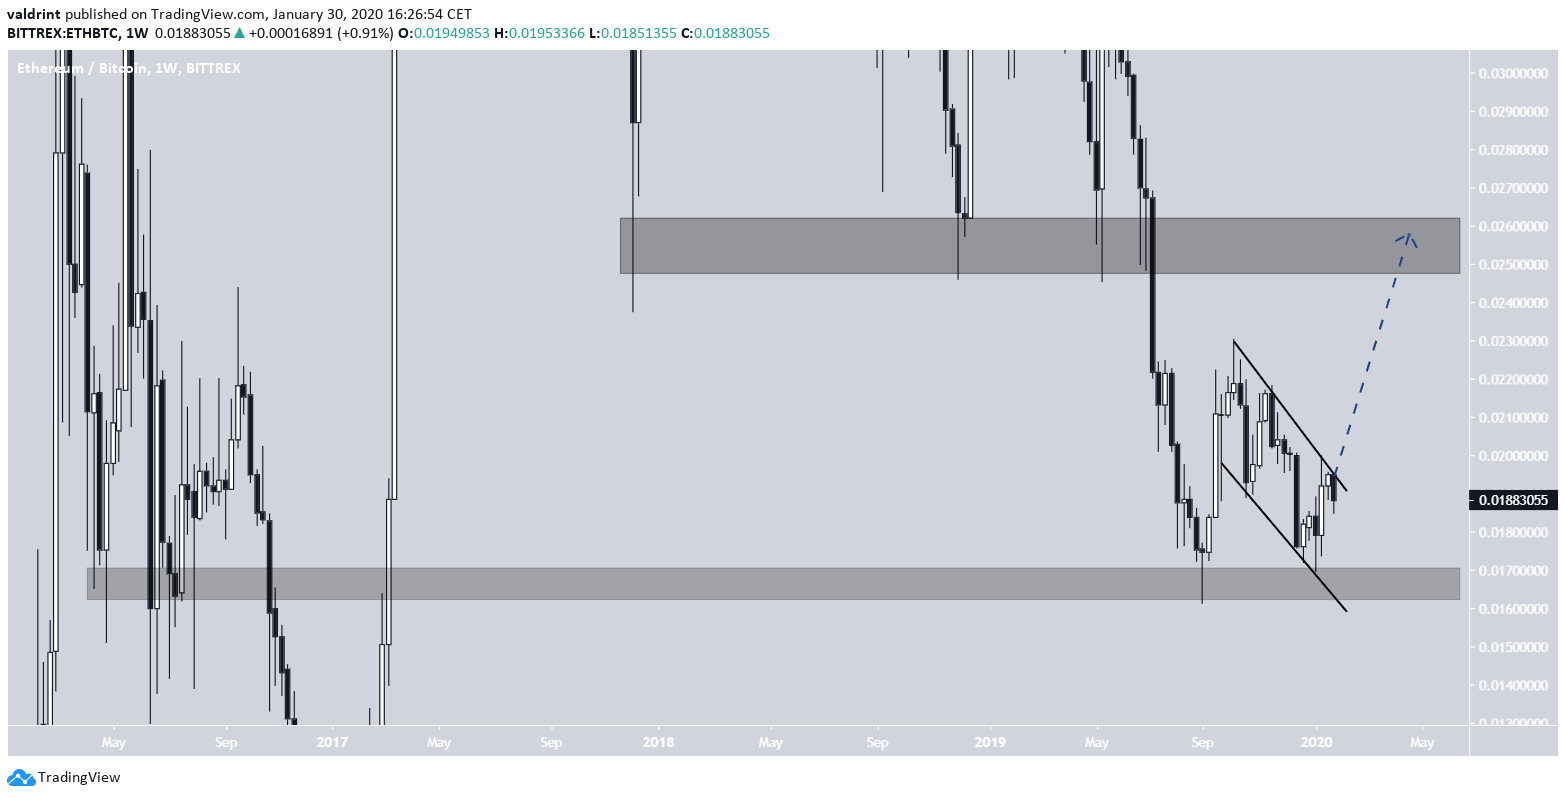 A strong reason for the breakout is given by the weekly RSI:
- First, it has been trading below the 50 line for 567 days, suggesting that it is in a downward trend. This is the longest time it has done so.
- Also, it has created an inverse head and shoulders (H&S) pattern, a breakout from which would take it above the 50 line and confirm that it is in an uptrend.
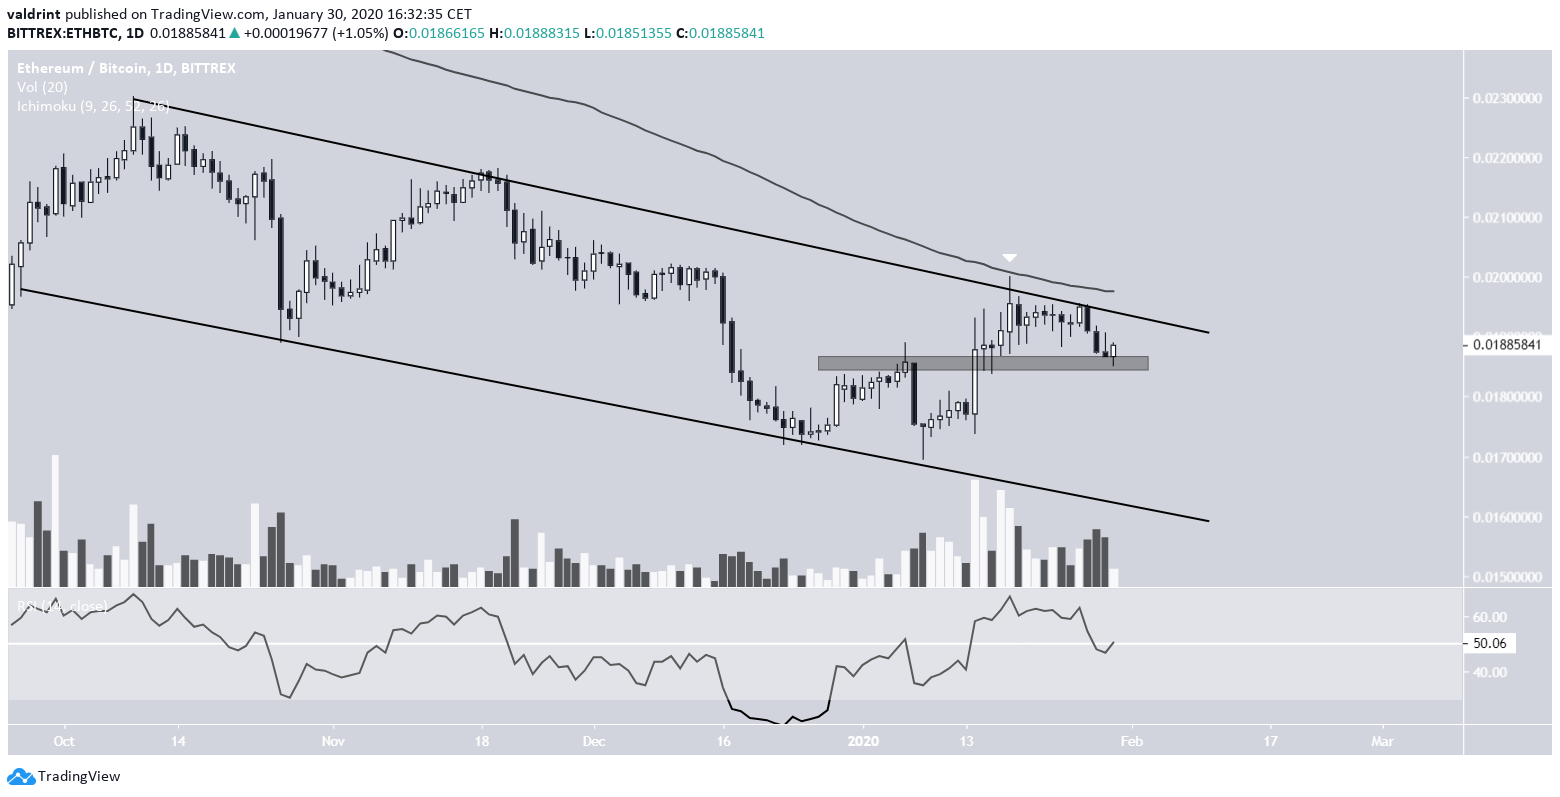
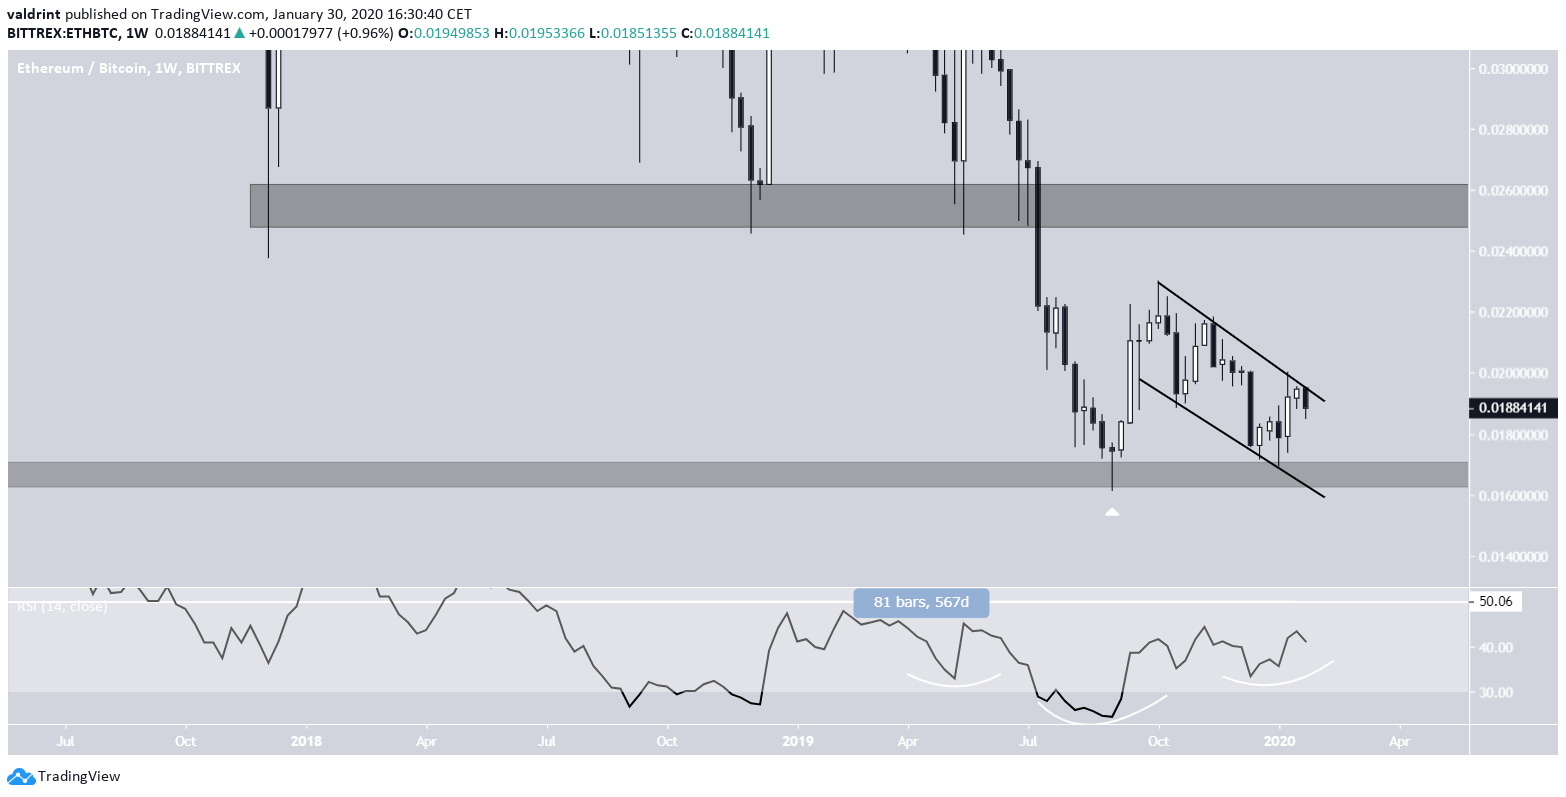 A closer look shows that the price is trading inside a descending channel and is facing close resistance from the 200-day MA, having already made an unsuccessful attempt at moving above it.
The January 13 breakout was combined with very strong volume and the pattern of increased volume in bullish candlesticks relative to their bearish counterparts has been present throughout the channel.
The most important area is found at ₿0.0185, a breakdown below which could take the price to the support line of the channel.
A closer look shows that the price is trading inside a descending channel and is facing close resistance from the 200-day MA, having already made an unsuccessful attempt at moving above it.
The January 13 breakout was combined with very strong volume and the pattern of increased volume in bullish candlesticks relative to their bearish counterparts has been present throughout the channel.
The most important area is found at ₿0.0185, a breakdown below which could take the price to the support line of the channel.
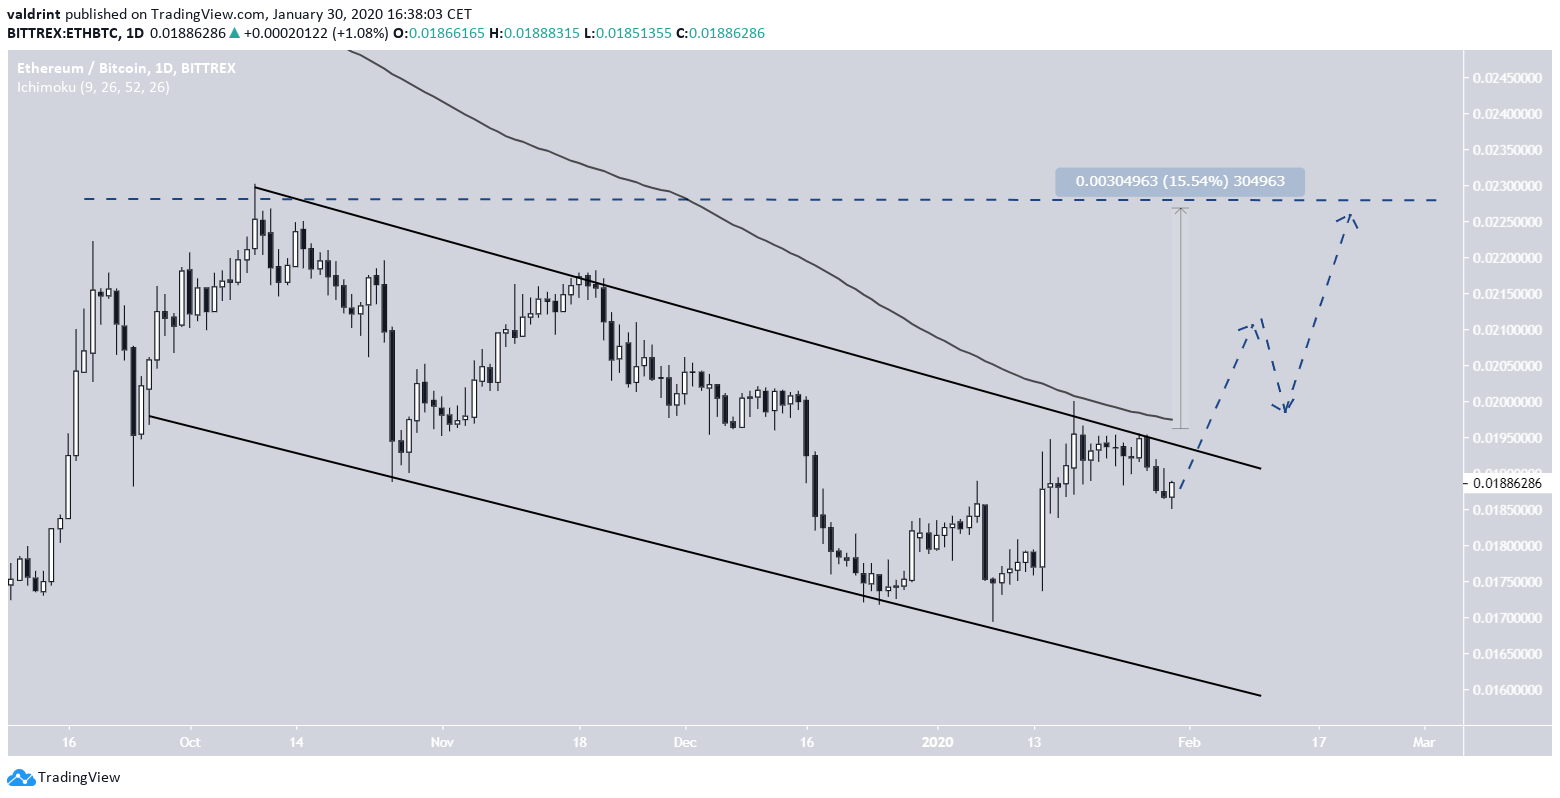
 In the future, we could see a three-wave breakout towards ₿0.02. As for its speed, the rate of increase would probably accelerate after breaking out from the 200-day MA.
Ethereum Price Conclusions
- Long-term indicators are bullish.
- Ethereum is trading inside a descending channel.
- Immediate target at ₿0.023.
- Longer-term target at ₿0.026.
Top crypto platforms in the US
Disclaimer
In line with the Trust Project guidelines, this price analysis article is for informational purposes only and should not be considered financial or investment advice. BeInCrypto is committed to accurate, unbiased reporting, but market conditions are subject to change without notice. Always conduct your own research and consult with a professional before making any financial decisions. Please note that our Terms and Conditions, Privacy Policy, and Disclaimers have been updated.

Valdrin Tahiri
Valdrin discovered cryptocurrencies while he was getting his MSc in Financial Markets from the Barcelona School of Economics. Shortly after graduating, he began writing for several different cryptocurrency related websites as a freelancer before eventually taking on the role of BeInCrypto's Senior Analyst.
(I do not have a discord and will not contact you first there. Beware of scammers)
READ FULL BIO
Sponsored
Sponsored