


![2018 Bitcoin Fractal Suggests Another Price Decrease on the Horizon [Premium Analysis]](/_mfes/post/_next/image/?url=https%3A%2F%2Fassets.beincrypto.com%2Fimg%2FQM422STbCAZc4m254mDeFzmF9fA%3D%2Fsmart%2F2bd569827c75424596aacf866bf46459&w=1920&q=75)
The Bitcoin price has been trading in a bearish pattern but has shown curious signals of bullish momentum. The direction of the ensuing movement could possibly determine the direction of BTC’s next long-term trend.
The Bitcoin price has been decreasing relatively steadily since November. However, on Dec 18, it initiated a very rapid upward move that caused the price to increase by 15%. On the same day, Bakkt posted impressive volume numbers, breaking its previous all-time high. These developments seem to be a sign of increasing optimism in the market.
Nevertheless, not everyone is convinced of Bitcoin’s bullish potential. Cryptocurrency trader @coinzada stated that while his prediction is a stretch, he could see the Bitcoin price form a similar descending triangle to the one created in 2018, which preceded the price crash to the December bottom of $3,400.
https://twitter.com/coinzada/status/1207951970813775879
2018 Bitcoin Fractal
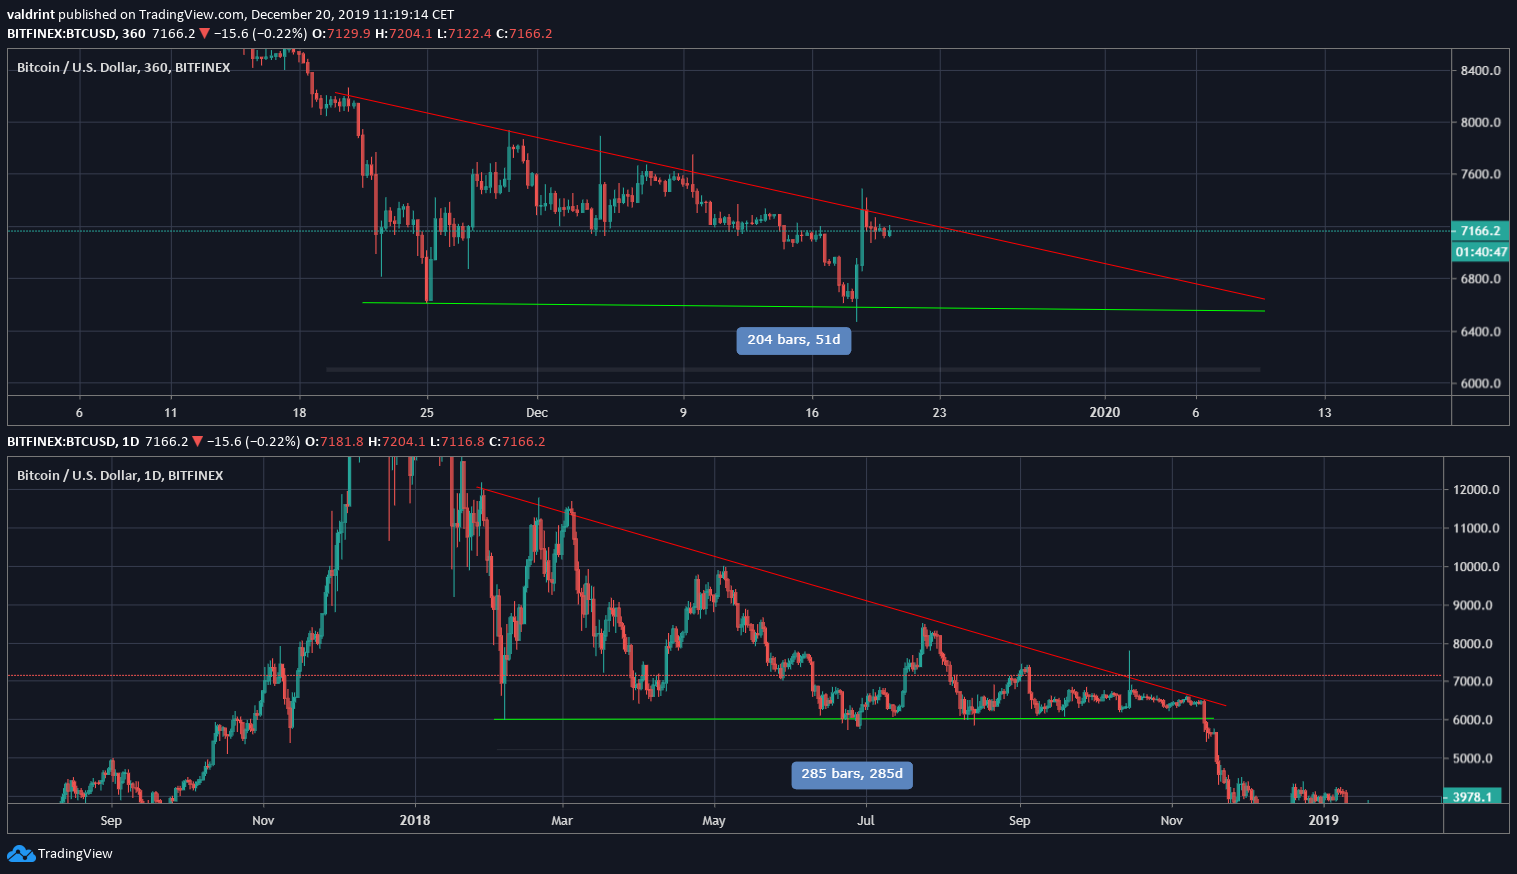
The previous move (lower chart) transpired between January and November of 2018. The price created a very large descending triangle (bearish pattern) after which a breakdown from $6,000 to $3,400 transpired. The entire pattern took 285 days to materialize.
In the current movement, the drop from $8,000 to $6,500 could be compared to that on the aforementioned breakdown. While the support line has only been validated twice and the long lower wick of the second bottom could alter the pattern, it is possible that the price is once again trading inside a descending triangle.
However, this triangle is much shorter, with the projected end of the pattern being just 51 days, making it more than 5 times shorter than that in 2018.
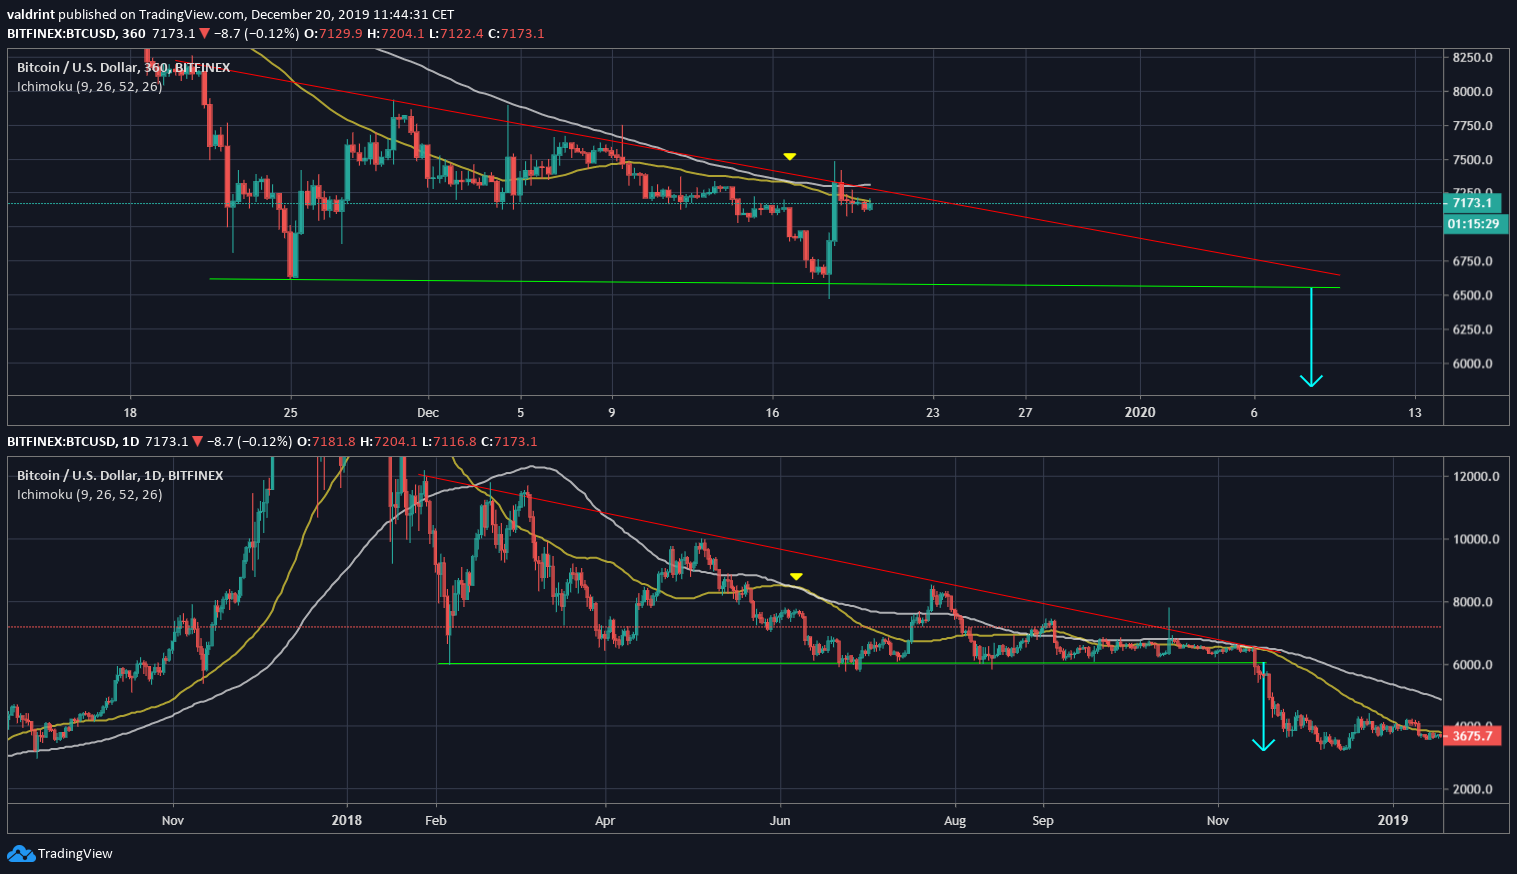
Moving averages (MA) show some similarities since the price was, and now is, trading below the 50 and 100-day MAs in both cases. The similarities are especially evident after both bullish cross rejections.
During 2018, the price broke down by around 45% of the height of the pattern. If it were to do the same this time around, Bitcoin could be headed to a $,5800 bottom.
Previous Breakout
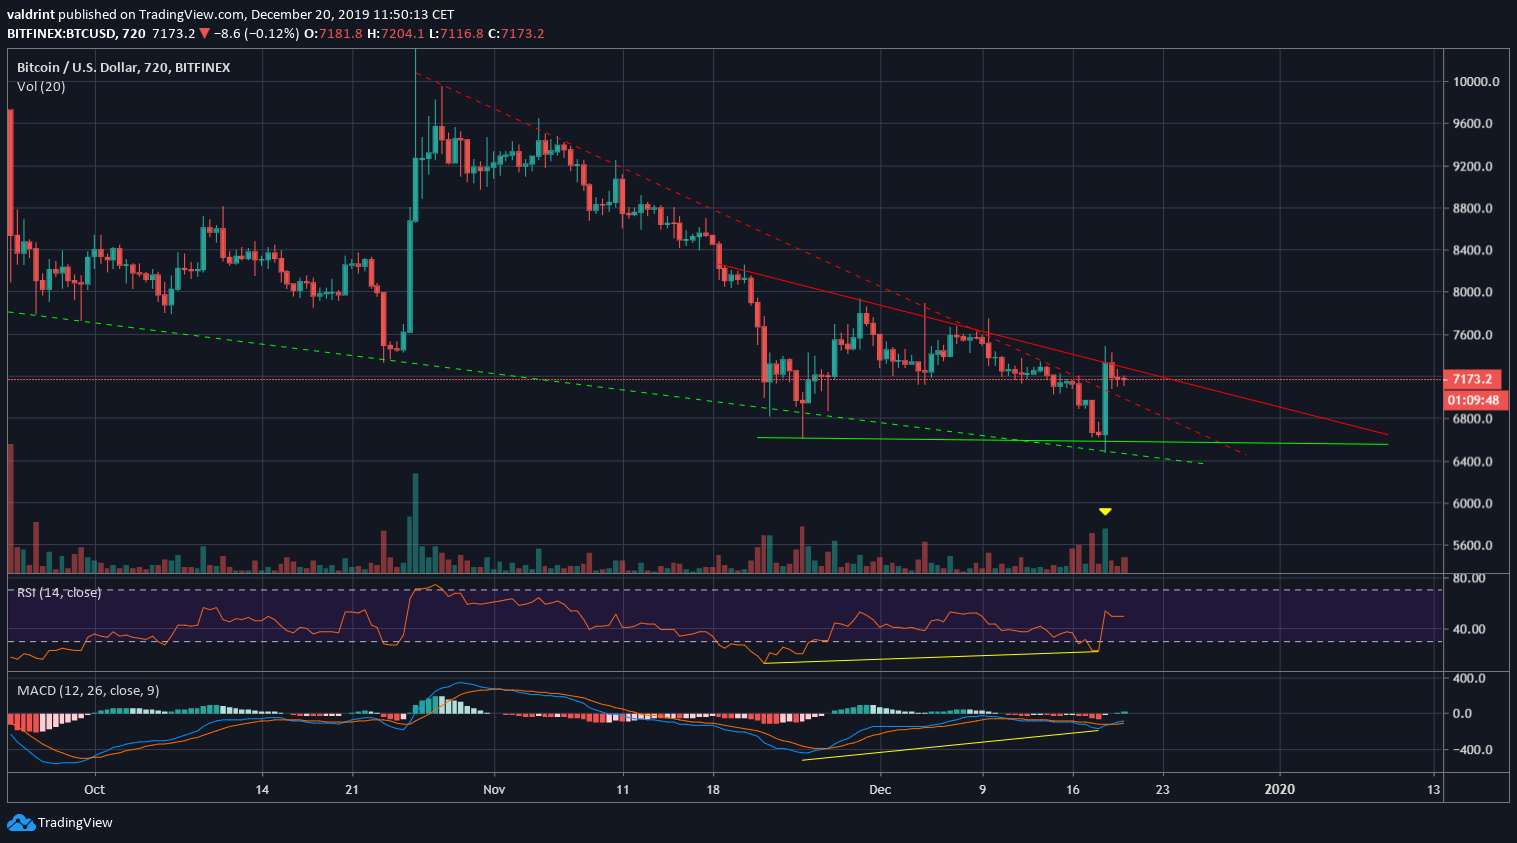
The price broke out from a three-month-long descending wedge and validated the resistance line afterward, a common movement after breakouts.
The breakout transpired with significant volume and was preceded by bullish divergence in both the RSI and the MACD. This indicates that the movement is valid and the price will likely continue its upward movement.
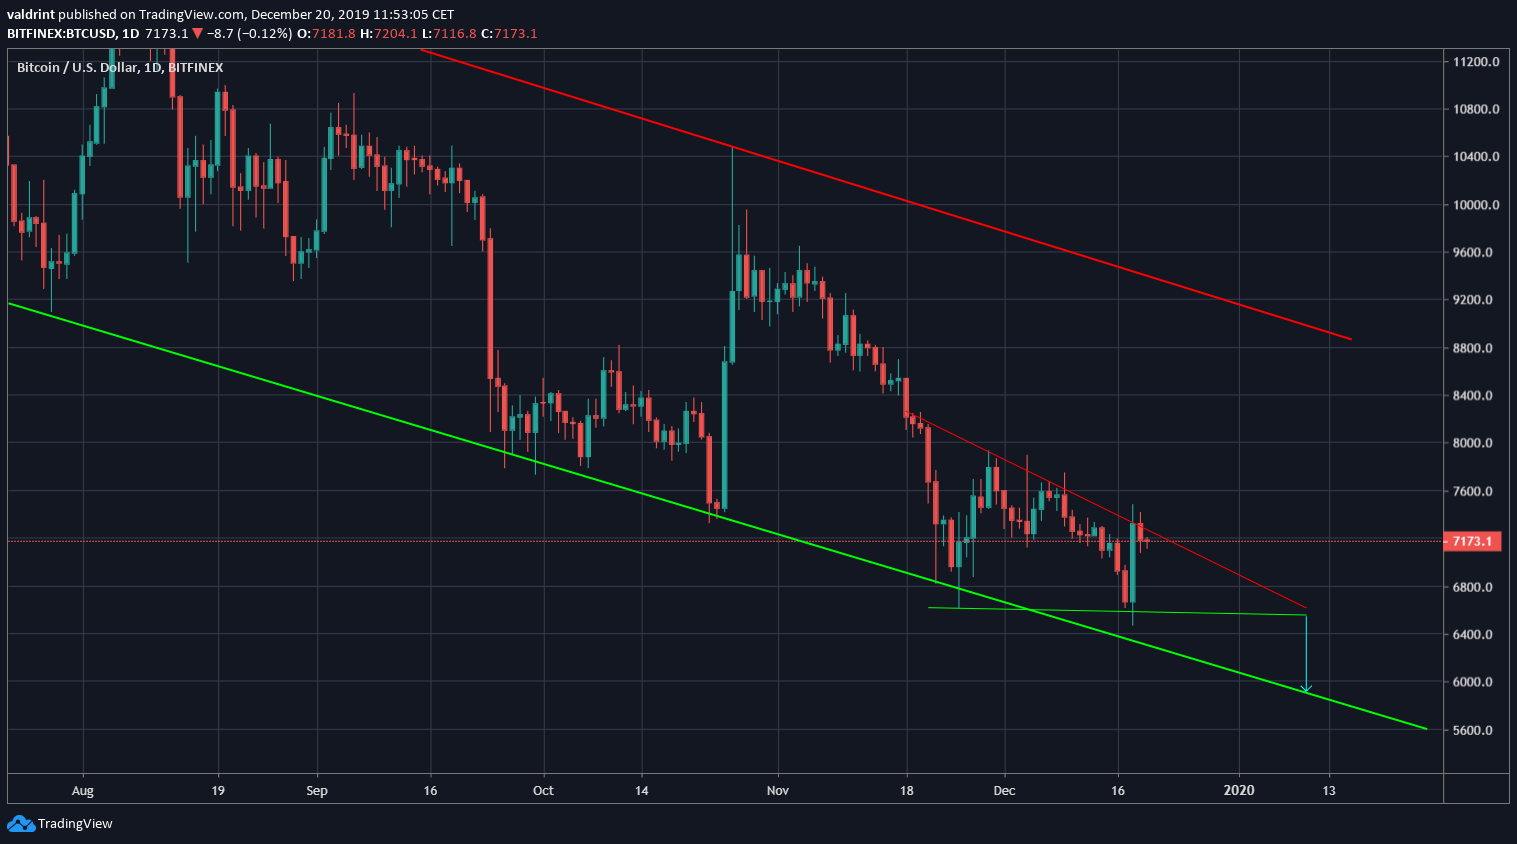
Nevertheless, the price is trading inside a longer-term descending channel, since it reached a 2019 high on June 24. If it breaks down from the triangle near the end of the pattern and drops to the target of $5,800, it would bounce directly off the support line of the channel.
So, both outlooks are possible, even though technical indicators and the price movement more closely resembles a bullish structure. A daily price close above $7,800 could easily act as confirmation of another leg to the upside. On the other hand, if the price continues trading inside the descending triangle, validating it once again, a breakdown becomes more likely. In either scenario, a decrease below $5,800 is not expected.
To conclude, the current descending triangle that Bitcoin is trading in has significant sway in determining future movement. A breakdown below would likely take us to $5,800, while a move above the descending resistance line would suggest that the price could begin to make higher-highs.


