
On Tuesday, Celsius (CEL) initially fell by 12% but then started a rally and increased by 17%. It is possible that breaking news was the catalyst for both these movements.
The price movement for Celsius (CEL) over the past two days has been extremely volatile. Initially, the price fell by 12% after news that CEO Alex Mashinsky had stepped down from the company.
The several hours later, the price pumped by nearly 17% on rumors that Sam Bankman-Fried, the billionaire CEO of FTX, is considering bidding for the assets of the Celsius network.
Previously, he made a successful bid for the assets of bankrupt crypto brokerage Voyager Digital, at a valuation of $1.4 billion.
Is CEL breakdown incoming?
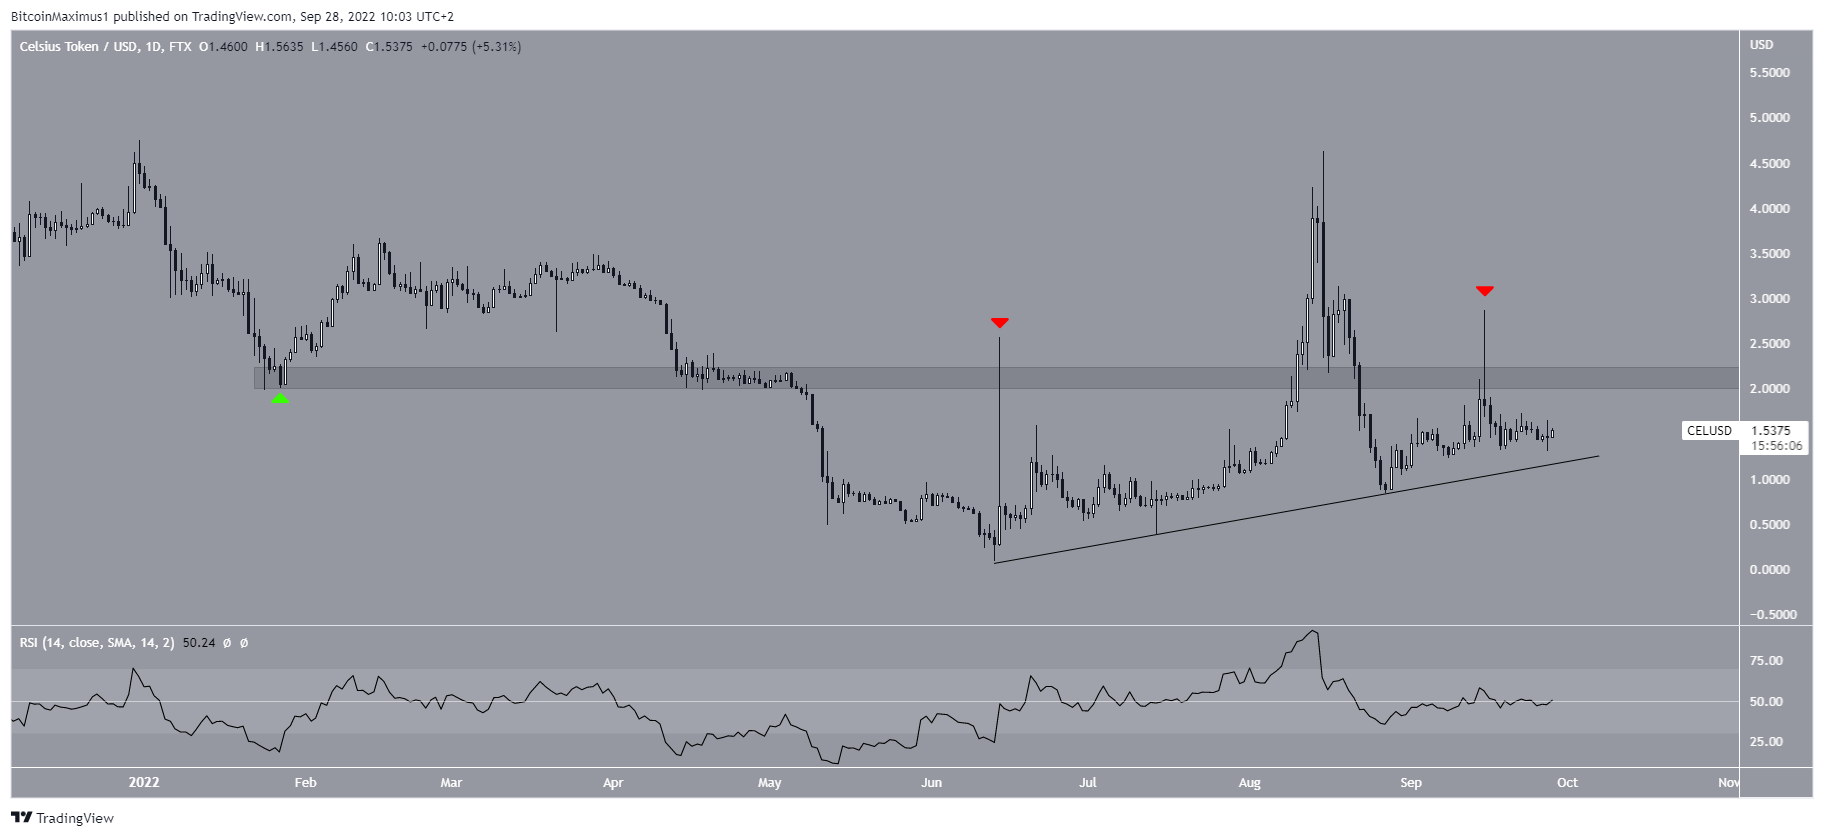
CEL has been increasing alongside an ascending support line since June 13. On Aug. 7, the rate of accelerated, leading to a high of $4.63 on Aug. 13.
At the time, it looked like this had caused a breakout above the $2.10 resistance area.
However, the breakout could not be sustained, and the price decreased shortly afterward, validating the $2.10 area as resistance once more (red icon). This created a very long upper wick, which is considered a sign of selling pressure.
CEL is now trading very close to the ascending support line. A breakdown below it would likely lead to new yearly lows.
Due to the rejection from the aforementioned resistance and the RSI decrease below 50, a breakdown from the ascending support line would be the most likely scenario.
What will happen in short term?
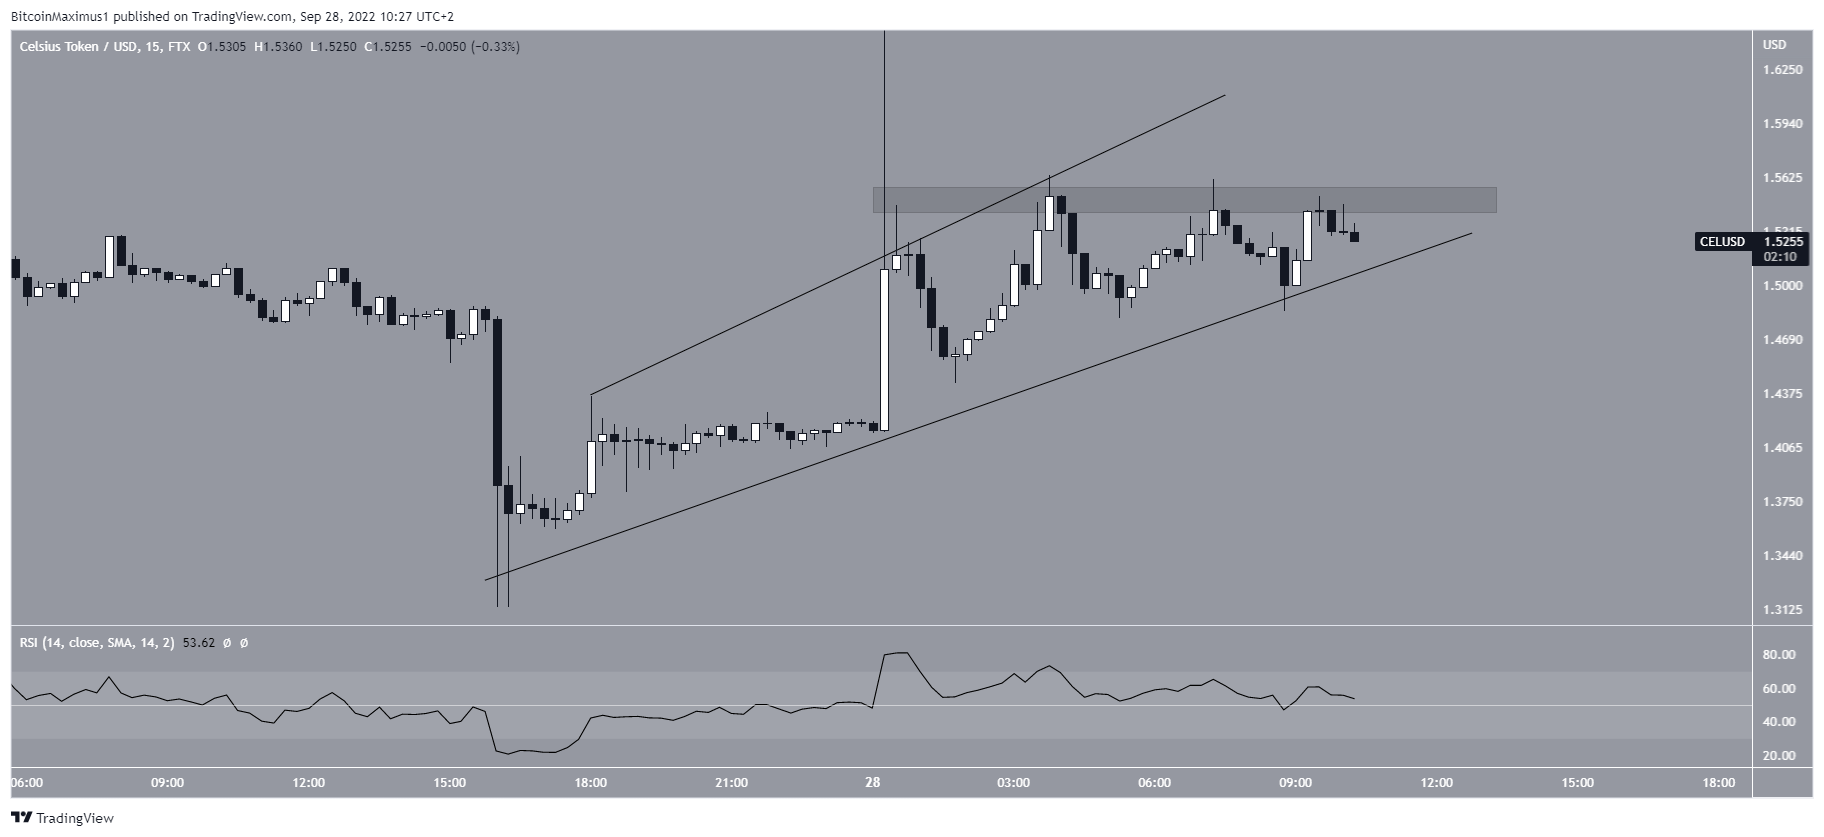
The shorter-term 15-minute chart is more unclear. Due to the fact that the sharp movements in both directions left long wicks in place, there is no definite pattern in place. However, it is possible that the price is trading inside an expanding wedge formation, which could be considered bearish.
Nevertheless, the 15-minute RSI is right at the 50 line, a sign of a neutral trend. Additionally, the price is nearing the point of convergence between the support line from the wedge and the $1.55 resistance area.
So, whether CEL breaks down from the support line or moves above the $1.55 area instead will likely determine the direction of the future trend.
For Be[In]Crypto’s latest Bitcoin (BTC) analysis, click here
