


1inch (1INCH) has increased by 48% since its June lows and is attempting to break out from a long-term descending wedge.
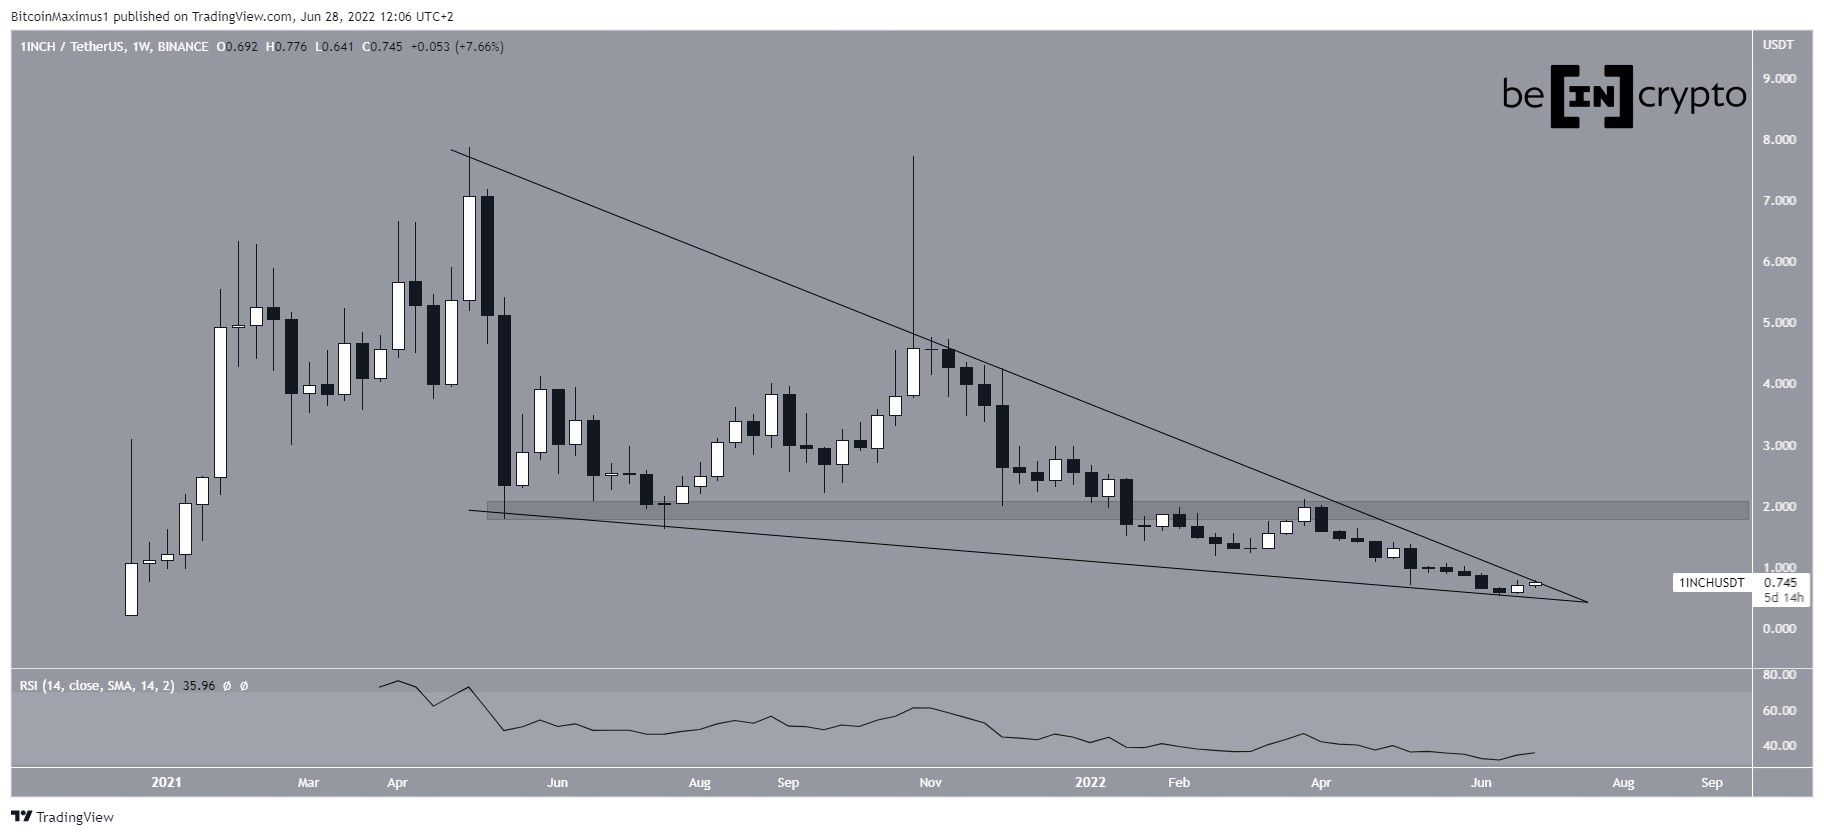
1INCH has been falling since reaching an all-time high price of $7.87 in May 2021. The downward movement has so far led to a low of $0.51 in June 2022. This amounted to a decrease of 93% since the all-time high.
The entire decrease seems to have been contained inside a descending wedge. The descending wedge is considered a bullish pattern, meaning that a breakout from it would be the most likely scenario. Currently, the price is at the point of convergence between resistance and support, meaning that a decisive move is likely to occur soon.
If a breakout transpires, the closest resistance area would be at $2.
Despite the presence of a bullish pattern, the weekly RSI is decreasing, currently being in bearish territory below 50. In June, it reached a new all-time low of 32.
Potential 1INCH breakout
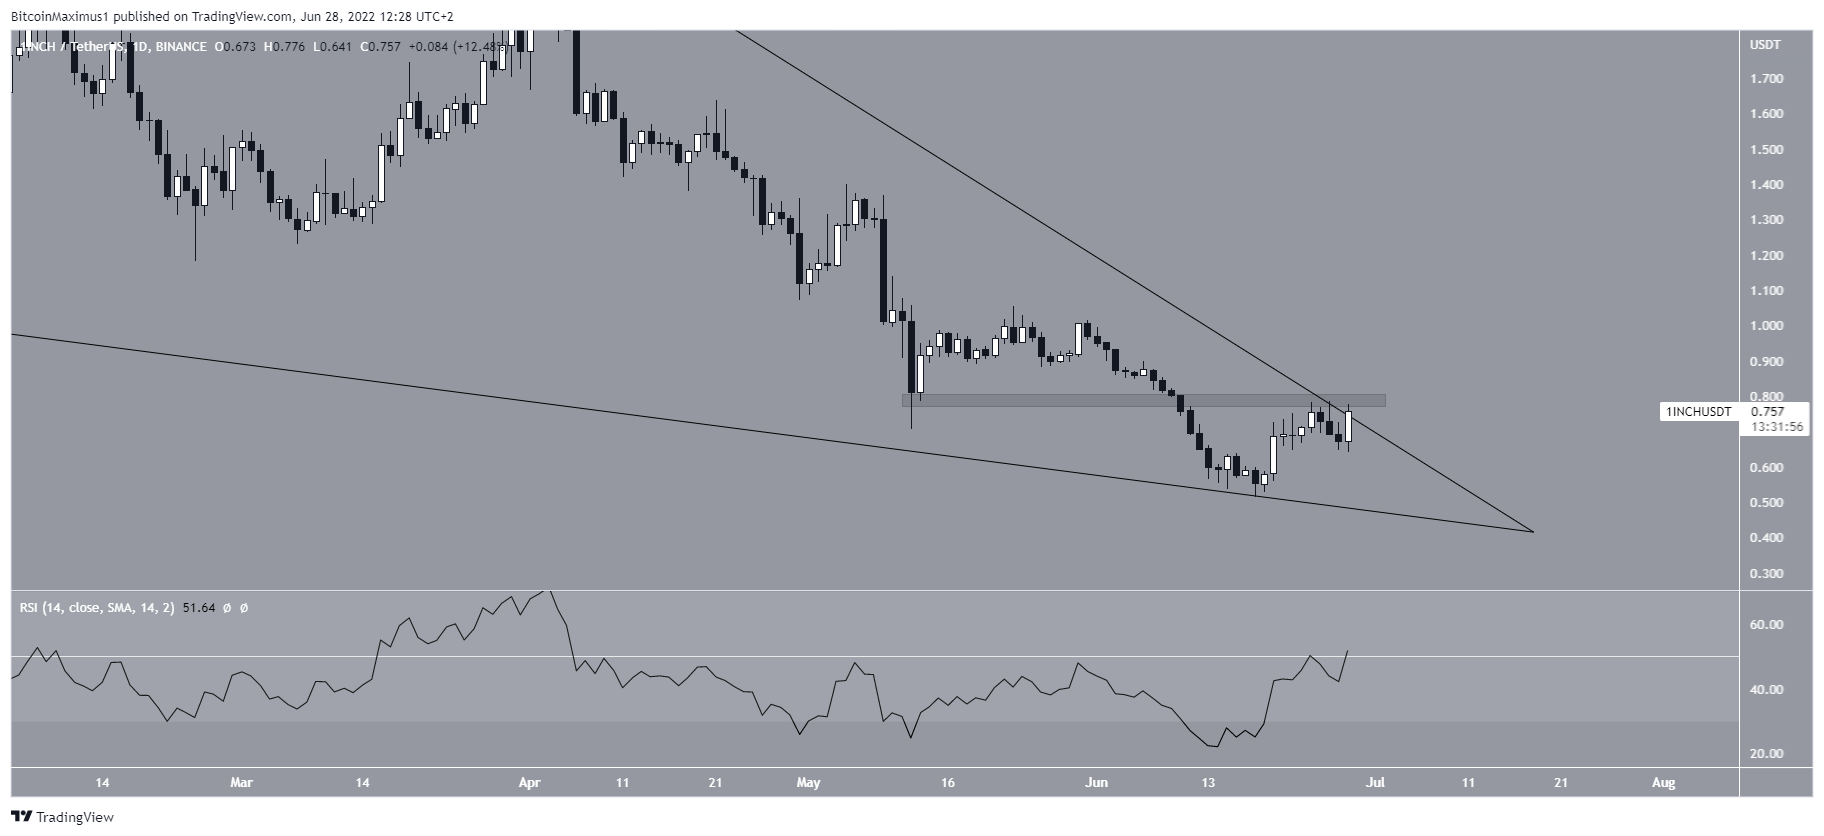
The daily chart does not provide any clear signs as to whether the price will break out or down. The two main reasons for this are that the RSI is still below 50 while the price is trading below the minor $0.80 horizontal resistance area.
The resistance area also coincides with the descending resistance line from the wedge, further increasing its significance.
So, a breakout from both the resistance area and an RSI movement above 50 is required in order for the trend to be considered bullish.
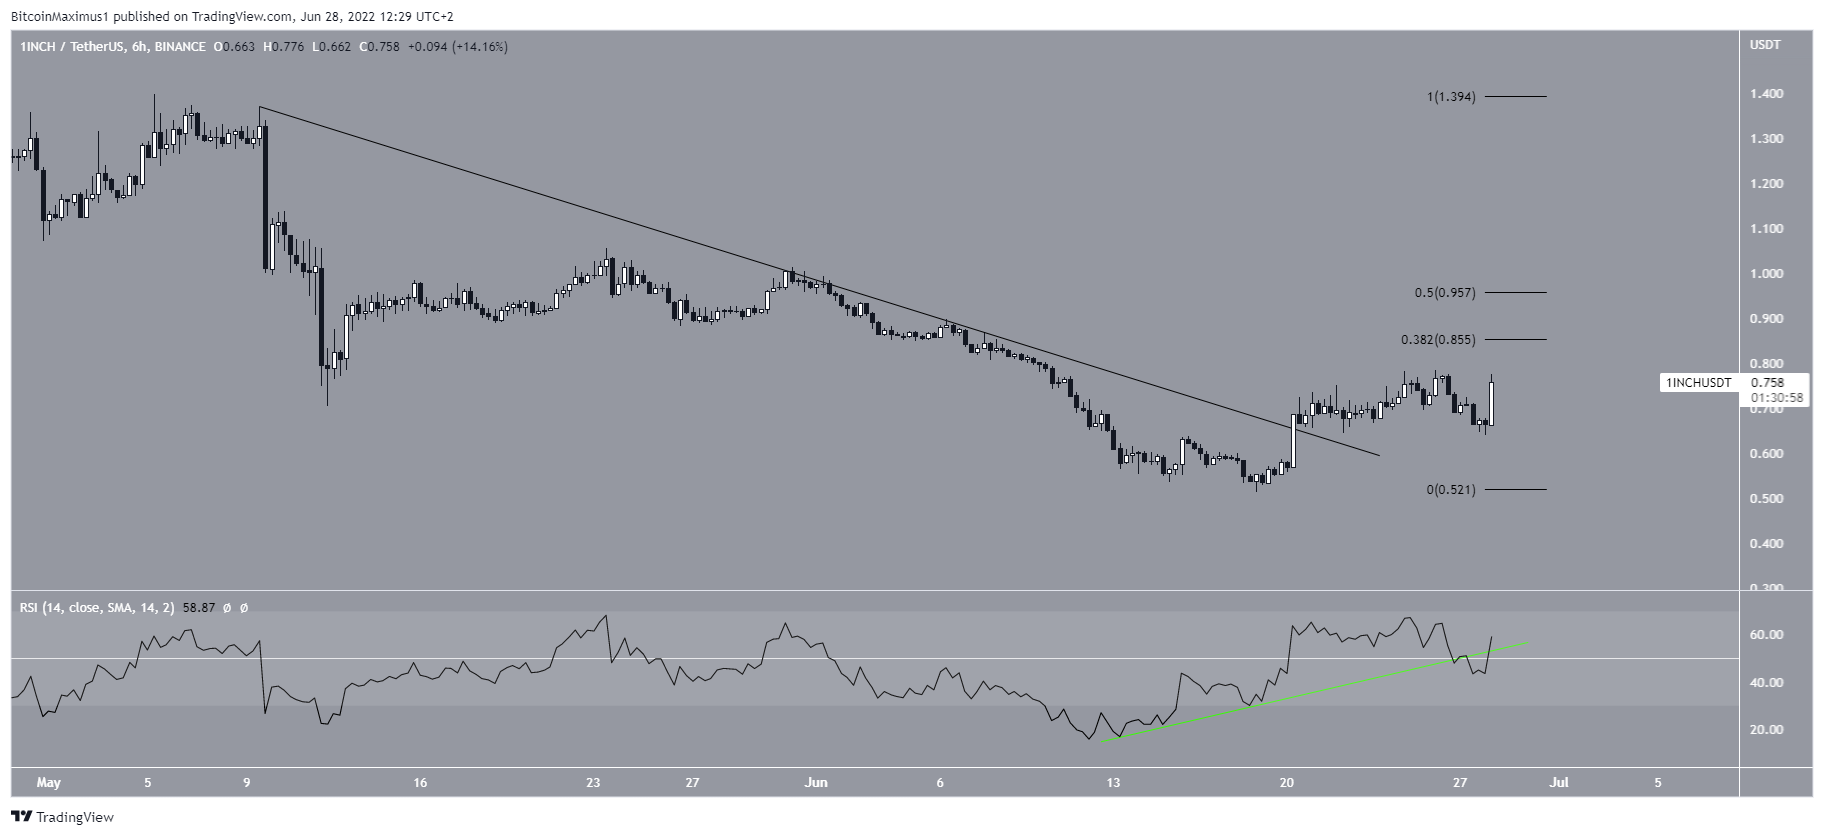
However, the six-hour chart is more bullish, since the price has already broken out from a descending resistance line.
Also, the RSI has moved above 50, and its bullish divergence trendline is still intact (green line).
So, a look at lower time frames indicates that a breakout from the long-term wedge is expected.
Wave count analysis
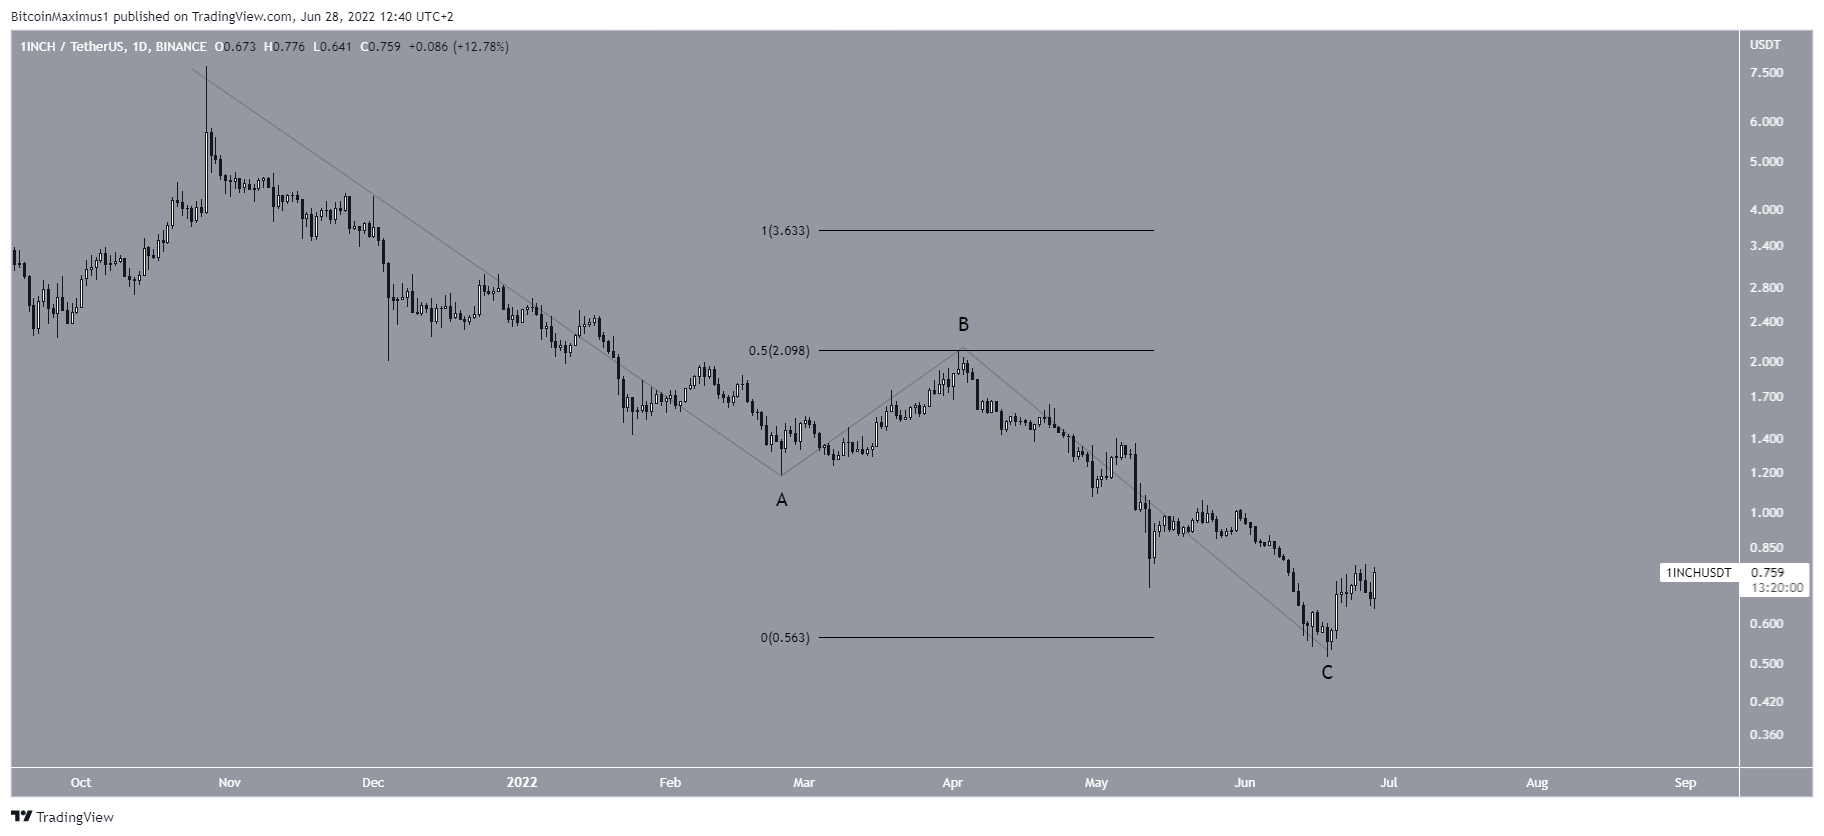
Since Oct. 2021, it seems that the price is mired in an A-B-C corrective structure. If so, waves A:C have had a 1:0.5 ratio, which is relatively common in such structures.
A breakout from the wedge would go a long way in confirming that this is the correct count.
Cryptocurrency trader @TheTradingHubb tweeted a chart of 1INCH which suggest that the price will increase towards
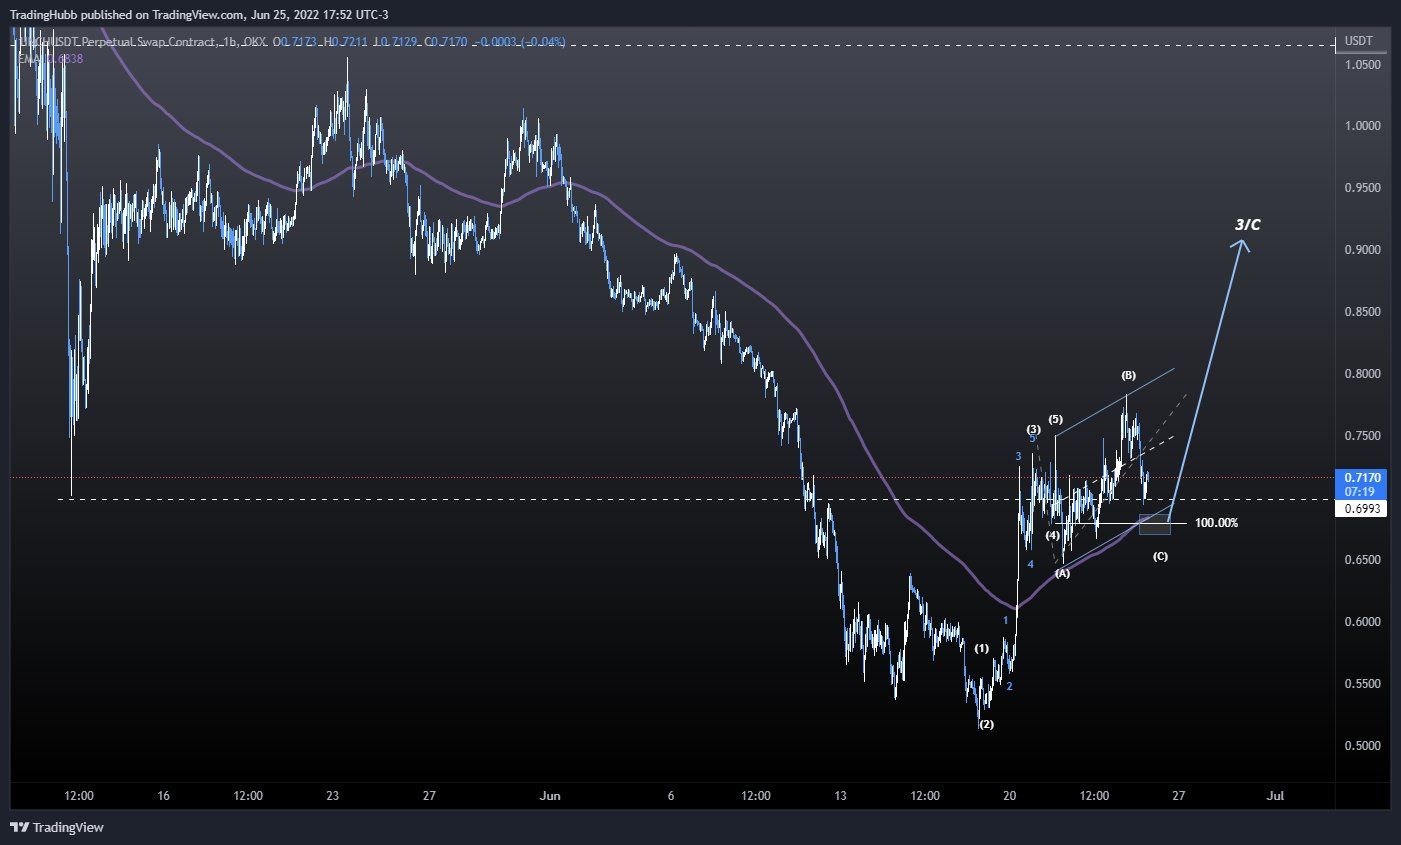
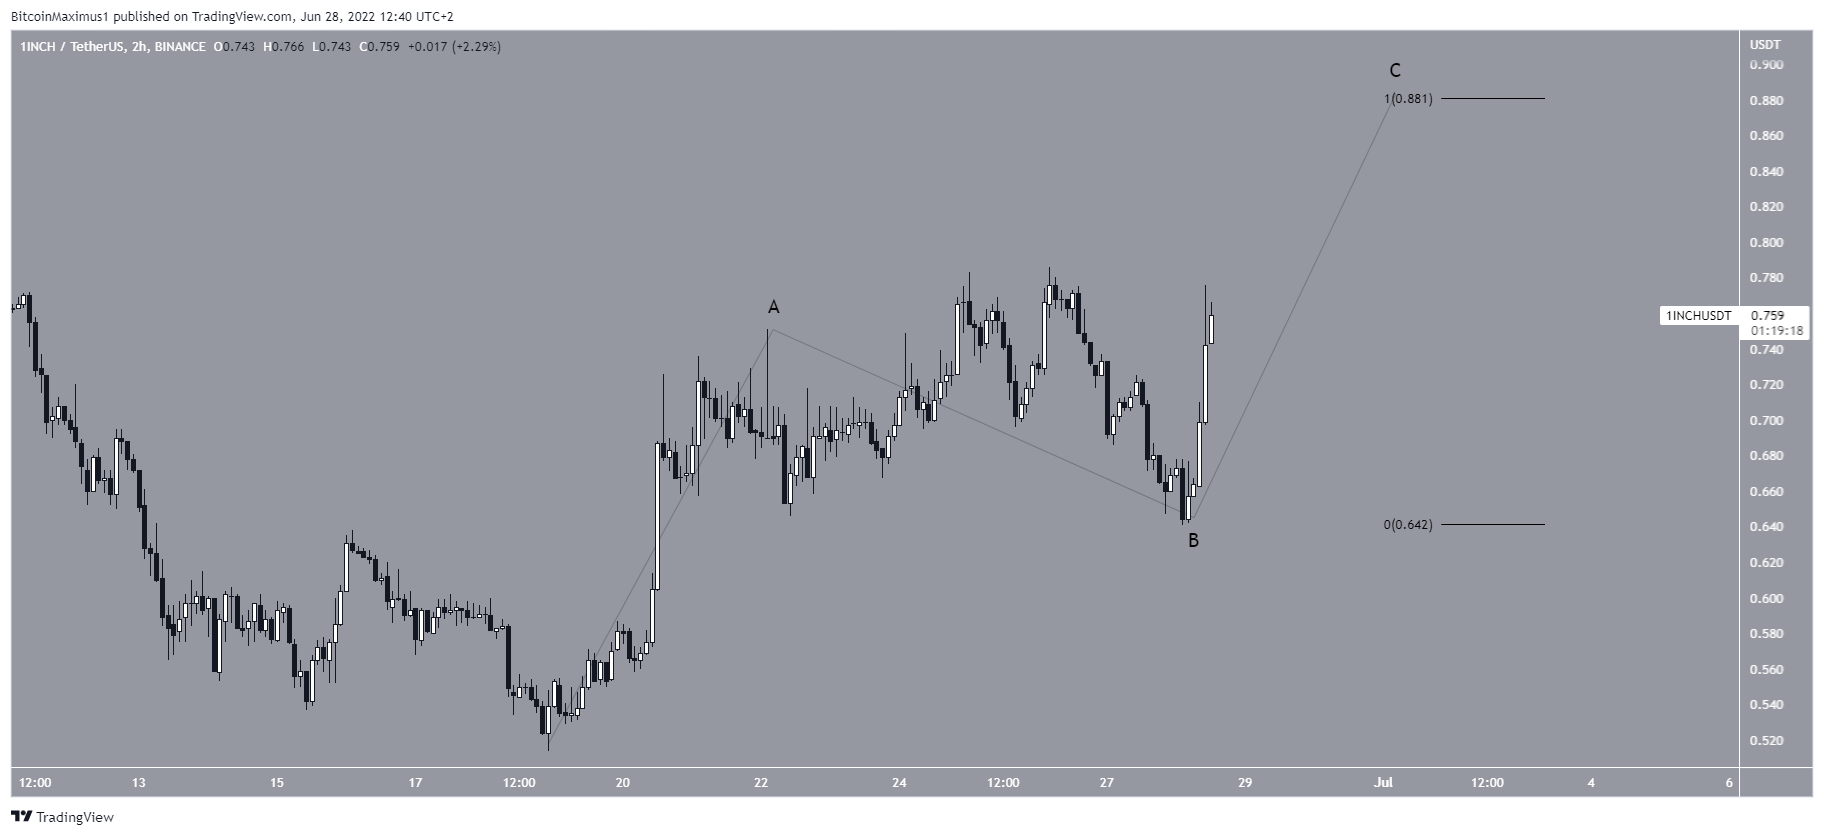
The short-term count is also bullish.
The first possibility suggests that the price is in wave C of an upward A-B-C corrective structure. Giving waves A:C a 1:1 ratio would lead to a high of $0.88.
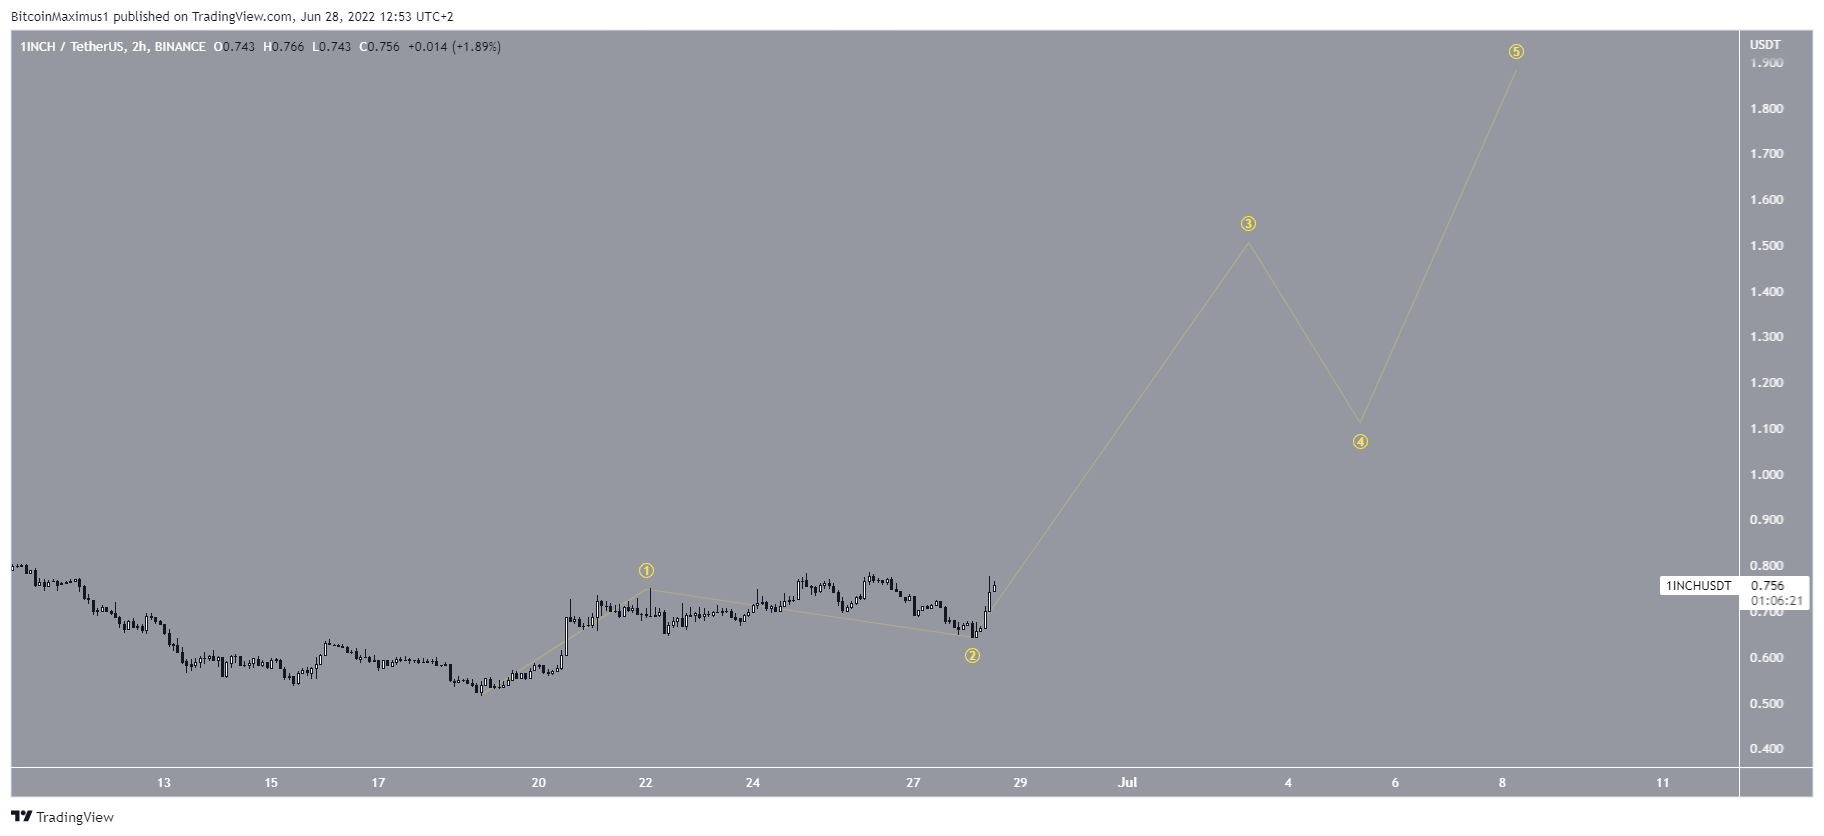
The second count suggests that the increase is a 1-2-3-4-5 bullish structure instead. If so, 1INCH would be expected to increase towards the previously outlined $2 resistance area.
The shape of the current upward movement will determine which is the correct count.
For Be[in]Crypto’s latest bitcoin (BTC) analysis, click here


