


1inch Network (1INCH) has shown strength by reclaiming a short-term support area and is likely to break out from its short-term pattern in the near future.
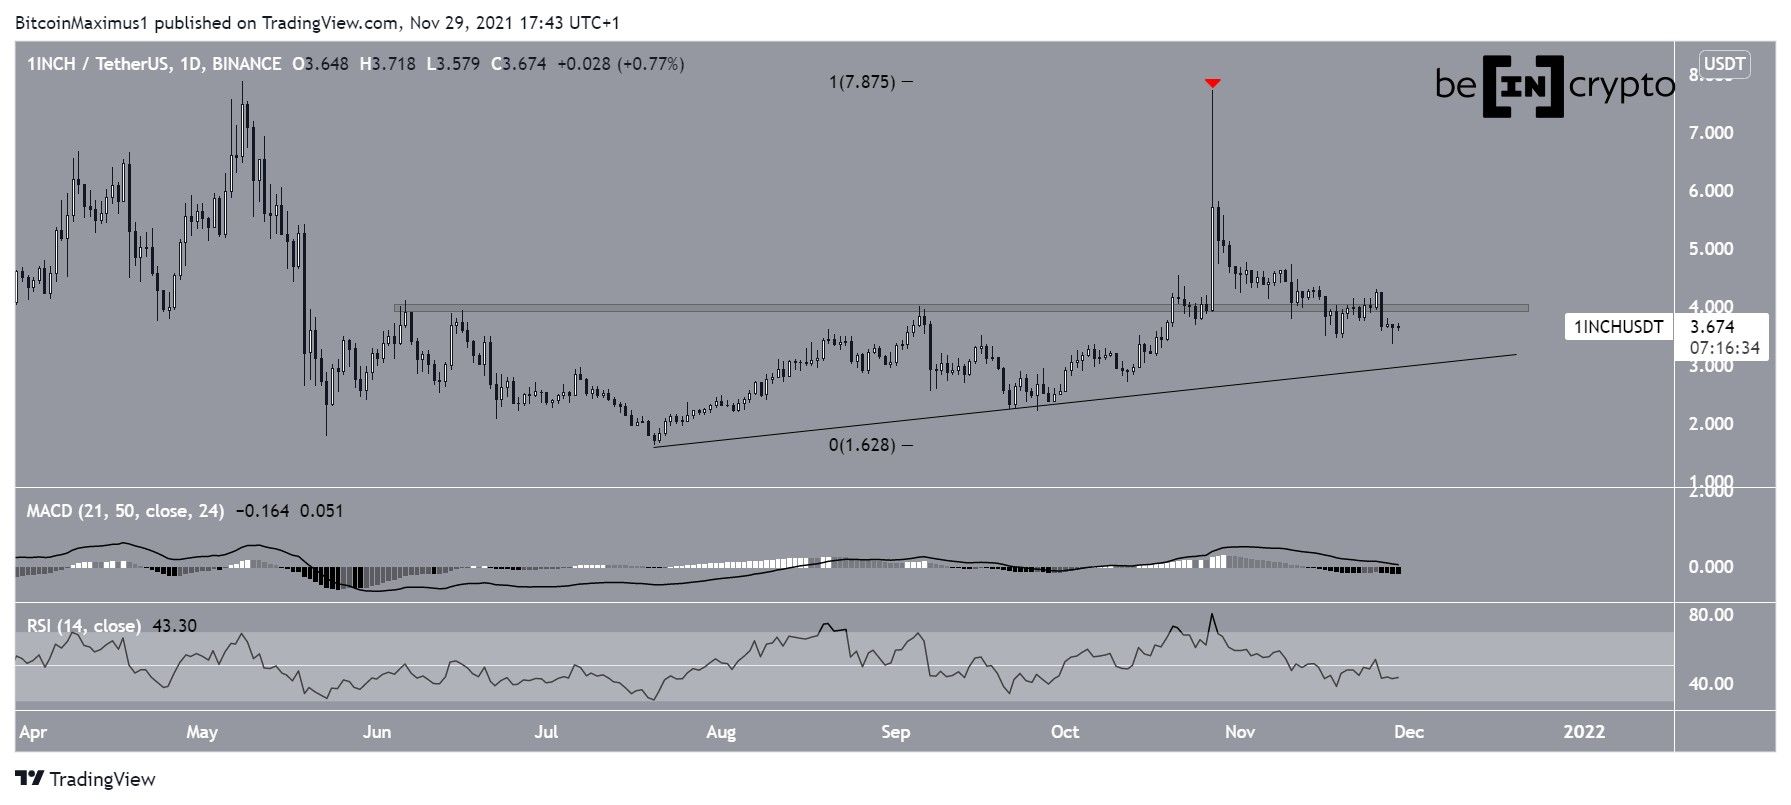
1INCH has been moving downwards since Oct 27 (red icon). At the time, it had just reached a high of $7.73, missing a new all-time high by less than $0.2.
The downward movement has so far led to a low of $3.36, which was reached on Nov 28.
Interestingly, 1INCH did not bounce at the $4 horizontal area. The area previously acted as resistance between June and Oct, and was expected to act as support. Since the token has fallen below it, the area is expected to act as resistance once more.
In addition to this, technical indicators are neutral/bearish. The MACD is decreasing and is nearly negative. The MACD is created by a short- and a long-term moving average (MA), and this means that the short-term MA is nearly slower than the long-term one. It is considered a bearish sign.
Furthermore, the RSI is just below the 50 line. Whether it reclaims it or gets rejected is important, since movements above or below this line can be considered as determinants of the direction of the trend.
If the downward movements persists, the closest support area is near $3, created by a potential ascending support line.
Short-term 1INCH movement
Cryptocurrency trader @thebull_crypto tweeted a 1INCH chart, stating that he bought some inside the $4 support area.
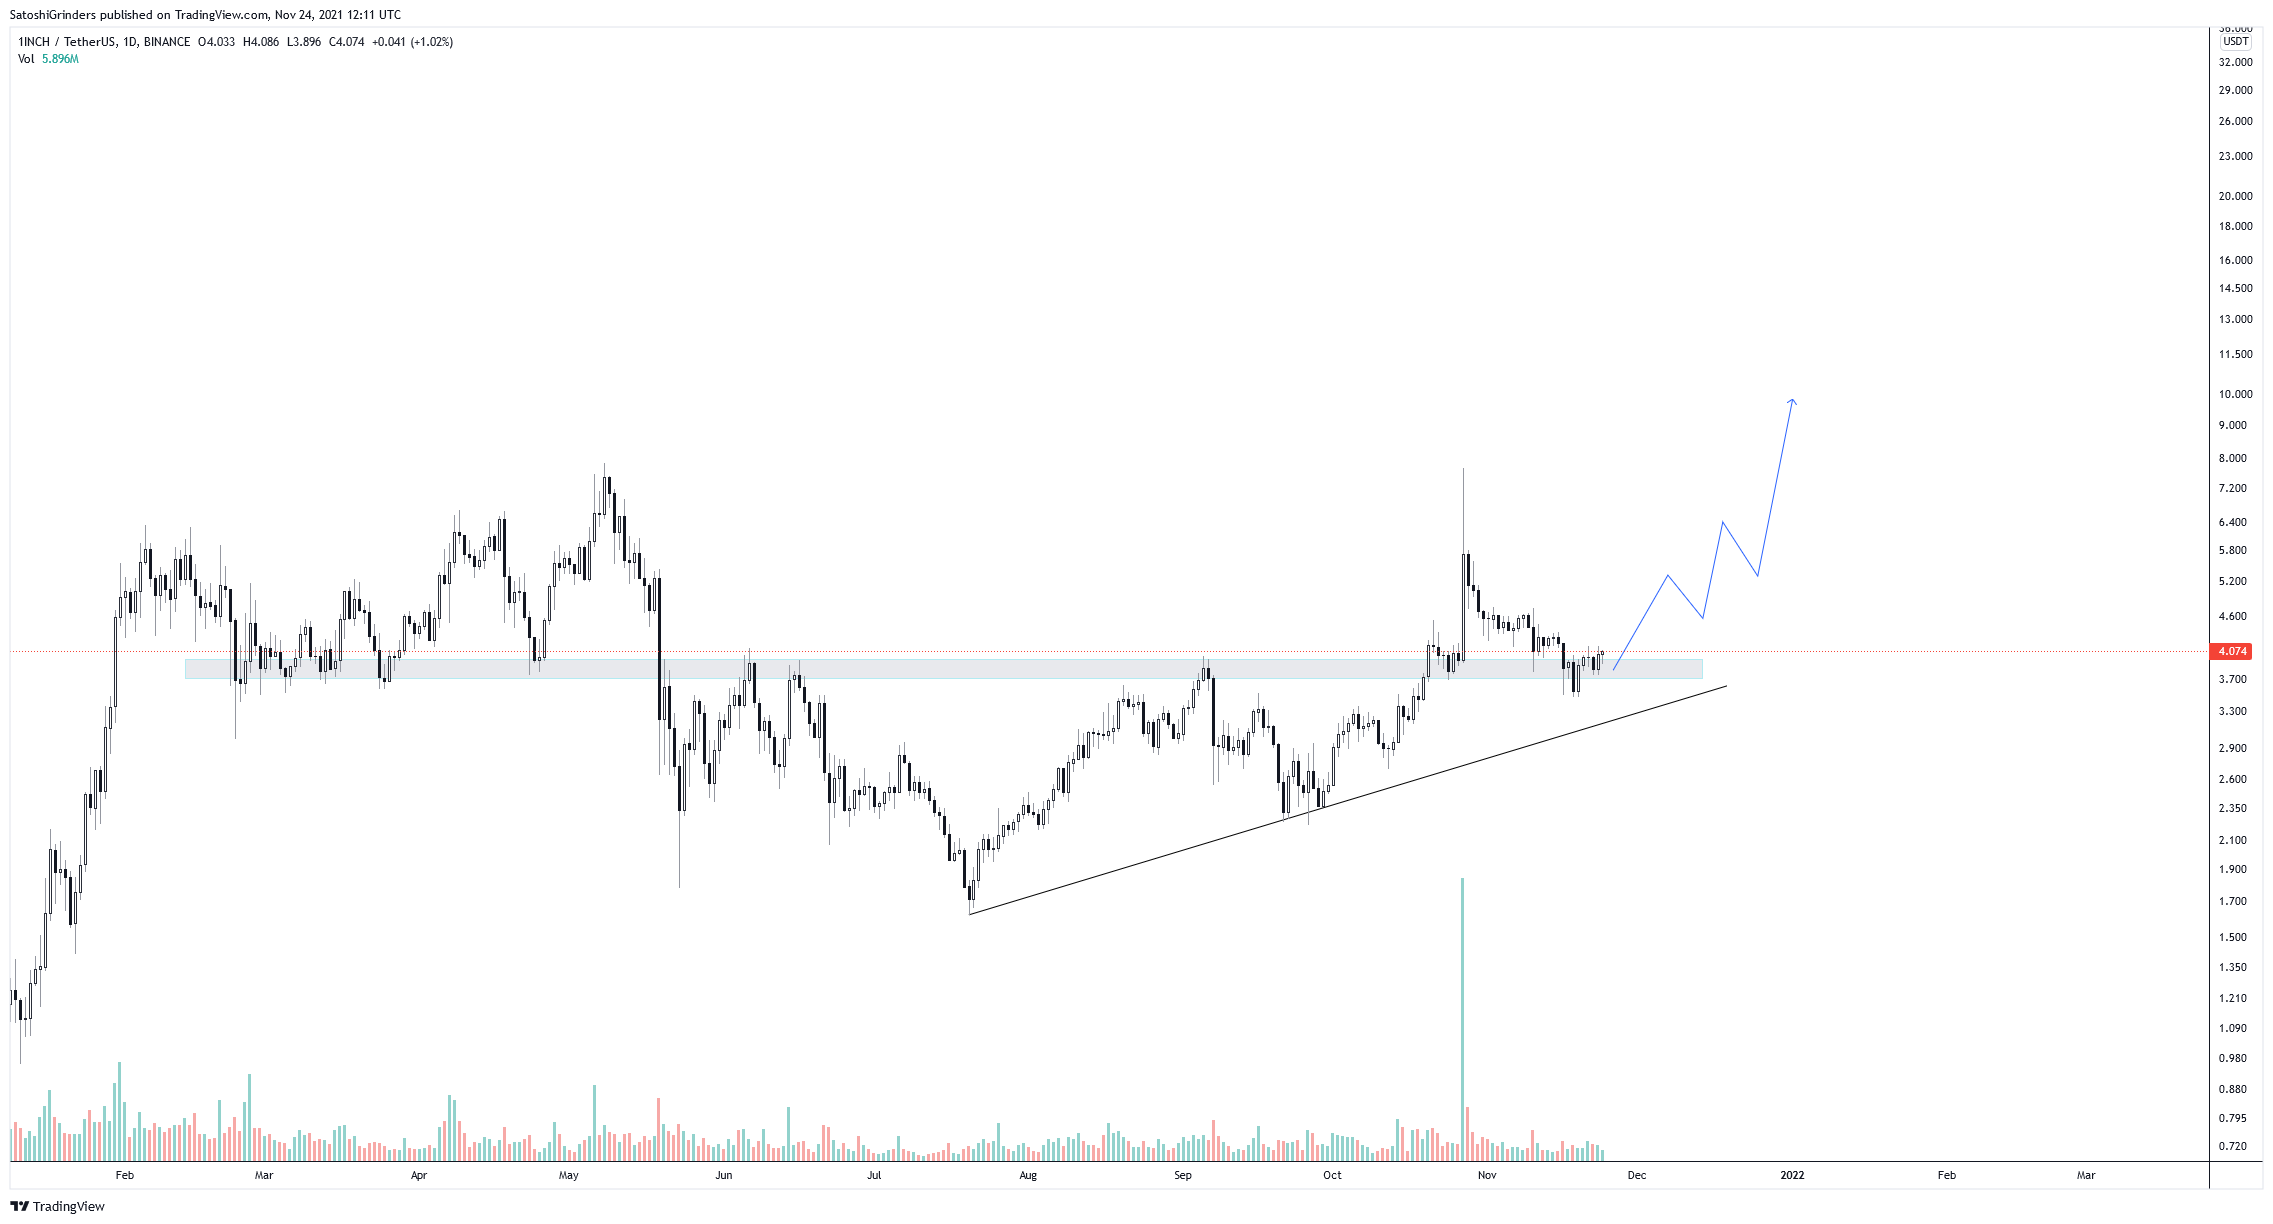
Even though 1INCH has fallen below the $4 area, the shorter-term chart still seems bullish.
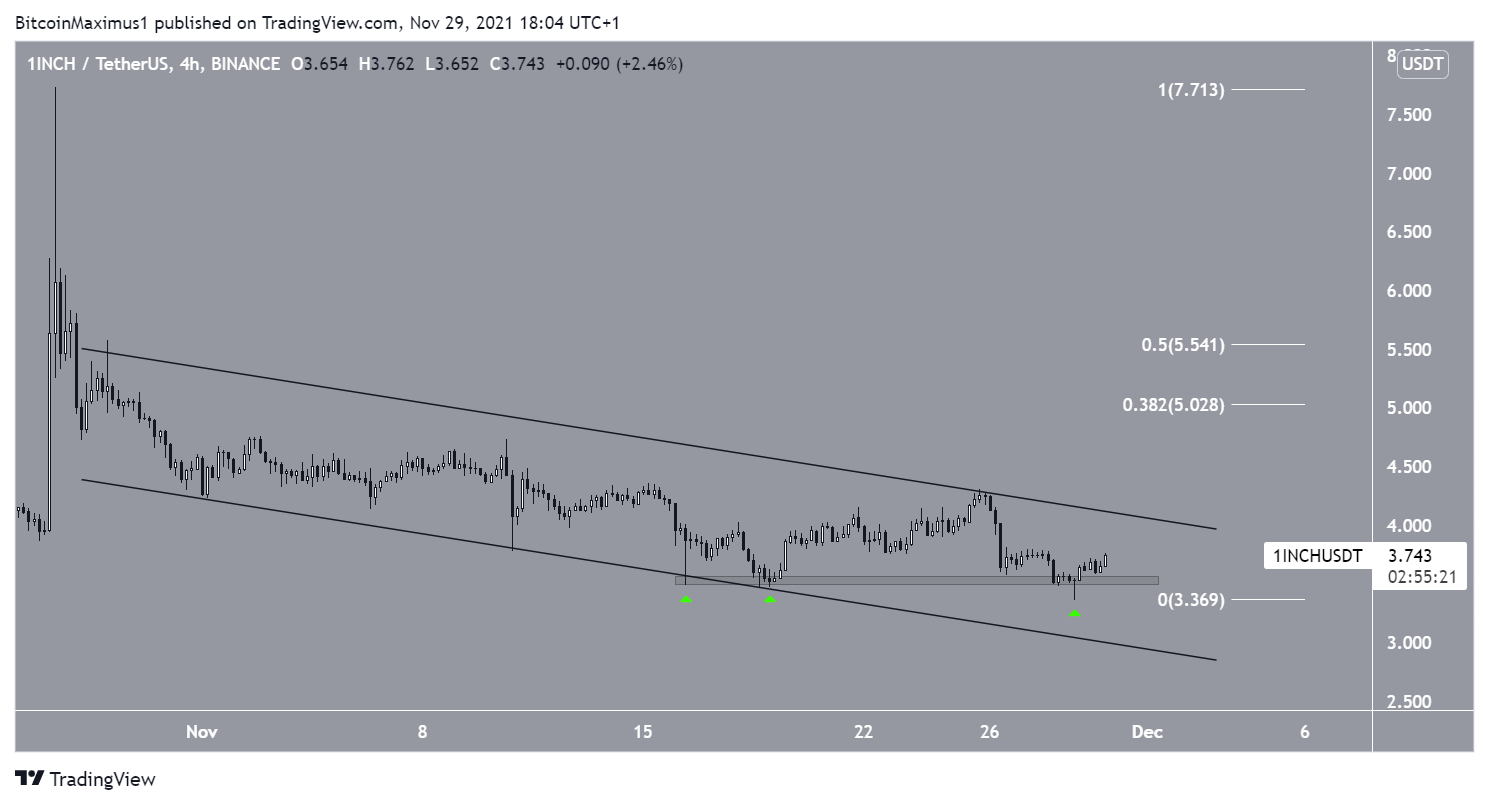
The token is trading inside a descending parallel channel, which usually contains corrective movements. This means that the direction of the trend is upwards, while the decrease is only a correction.
1INCH has shown strength by bouncing at the minor $3.40 area three times (green icon). Most recently, it initially deviated below this area before reclaiming it. This is a bullish development that is often followed by a breakout.
If one occurs, the closest resistance area would be between $5.03 and $5.55. This is created by the 0.382 – 0.5 Fib retracement resistance levels.
For BeInCrypto’s latest Bitcoin (BTC) analysis, click here.


