
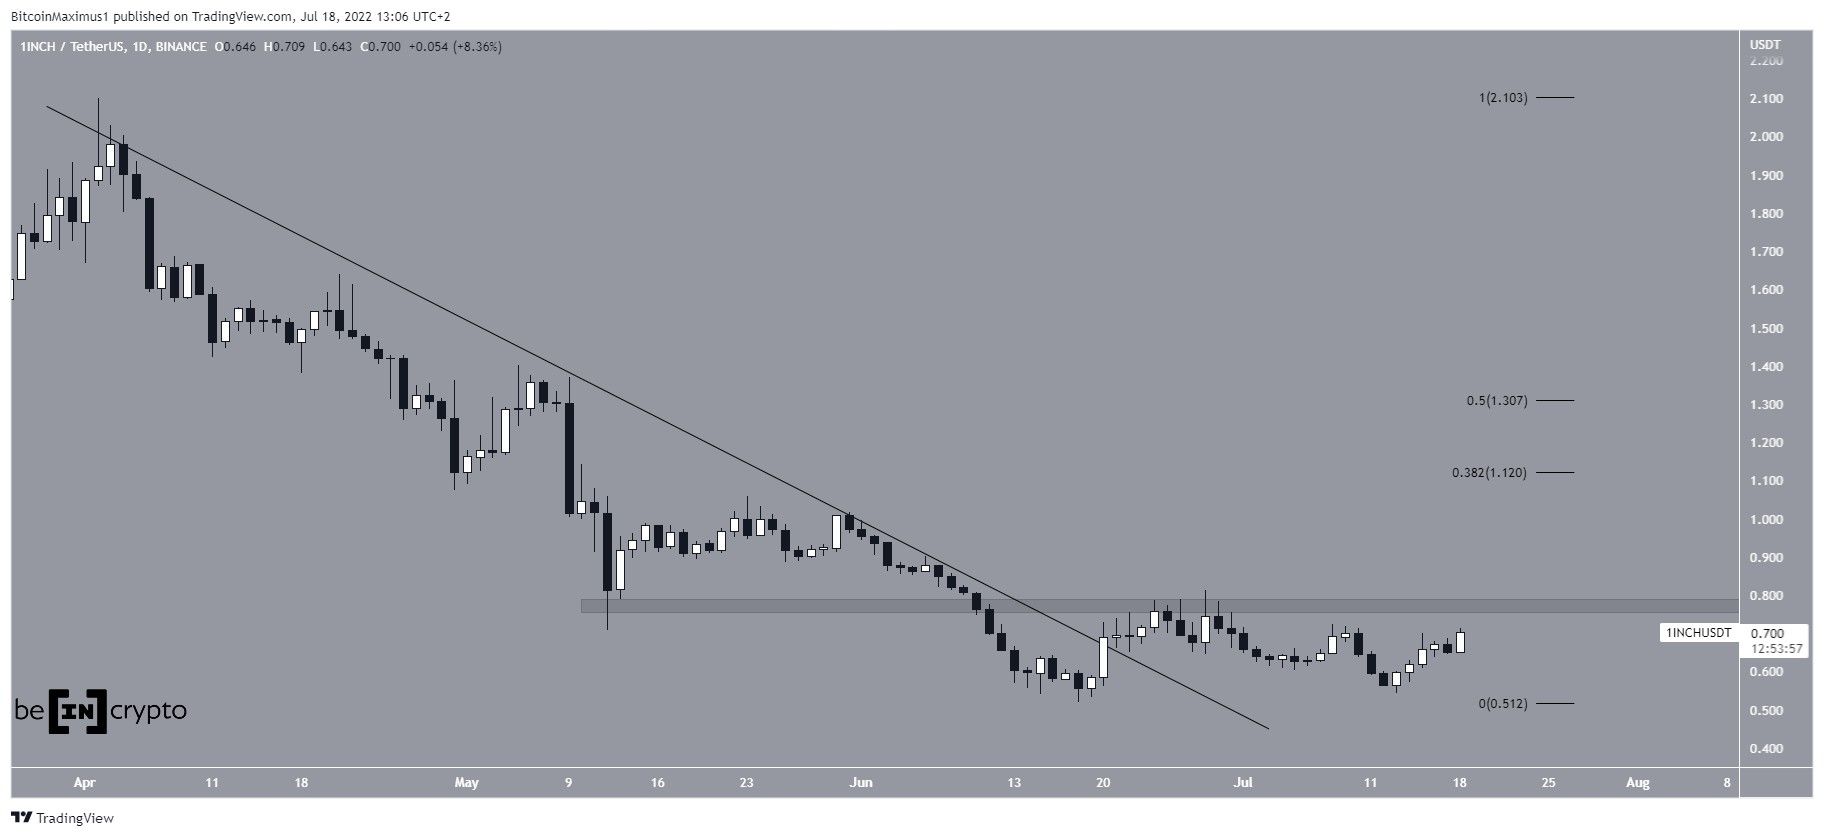
1Inch (1INCH) has been creating a bullish pattern over the past two months and has possibly initiated a bullish trend reversal.
1INCH has been falling underneath a descending resistance line since the beginning of April. This decrease led to a low of $0.51 on June 18. The price has been increasing since, and broke out from the line three days later, possibly indicating that the downward movement is complete.
The closest resistance area is at $0.77, a horizontal area that has intermittently acted as both support and resistance since May.
If the price is successful in moving above it, the next resistances would be at $1.12 and $1.30, respectively.
Bullish pattern
A closer look at the daily chart shows that the price has made a double bottom pattern that has also been combined with bullish divergence in the daily RSI. Since the double bottom is also considered a bullish pattern, it is possible that the pattern will initiate a reversal.
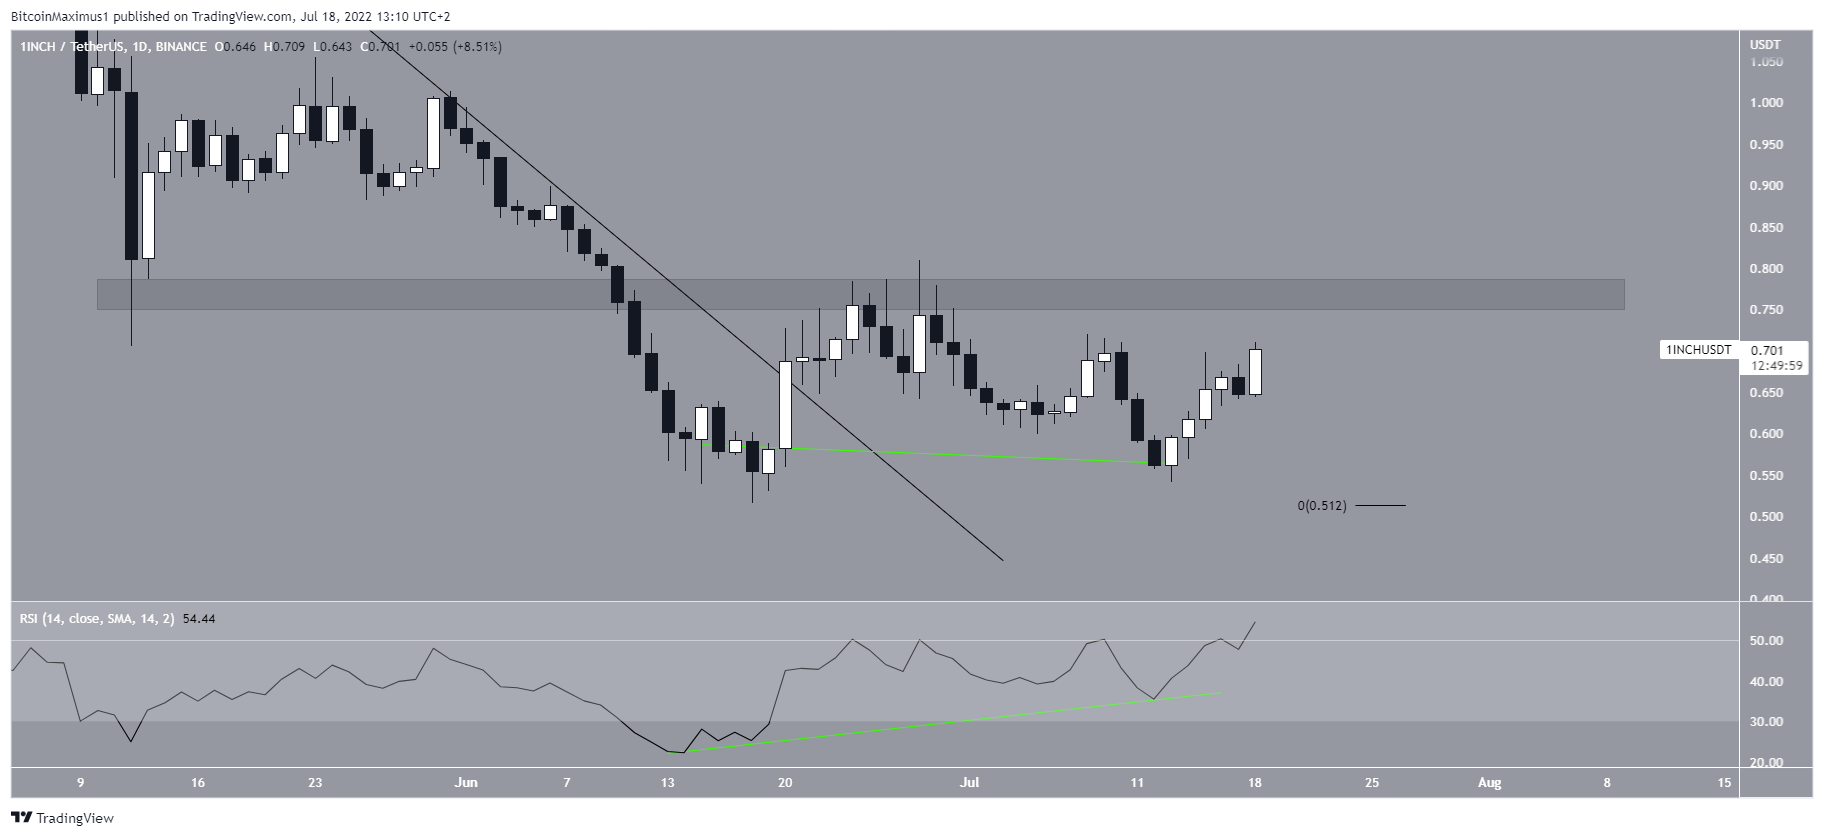
Cryptocurrency trader @ChefuChef tweeted a chart of 1INCH, stating that the price could increase considerably.
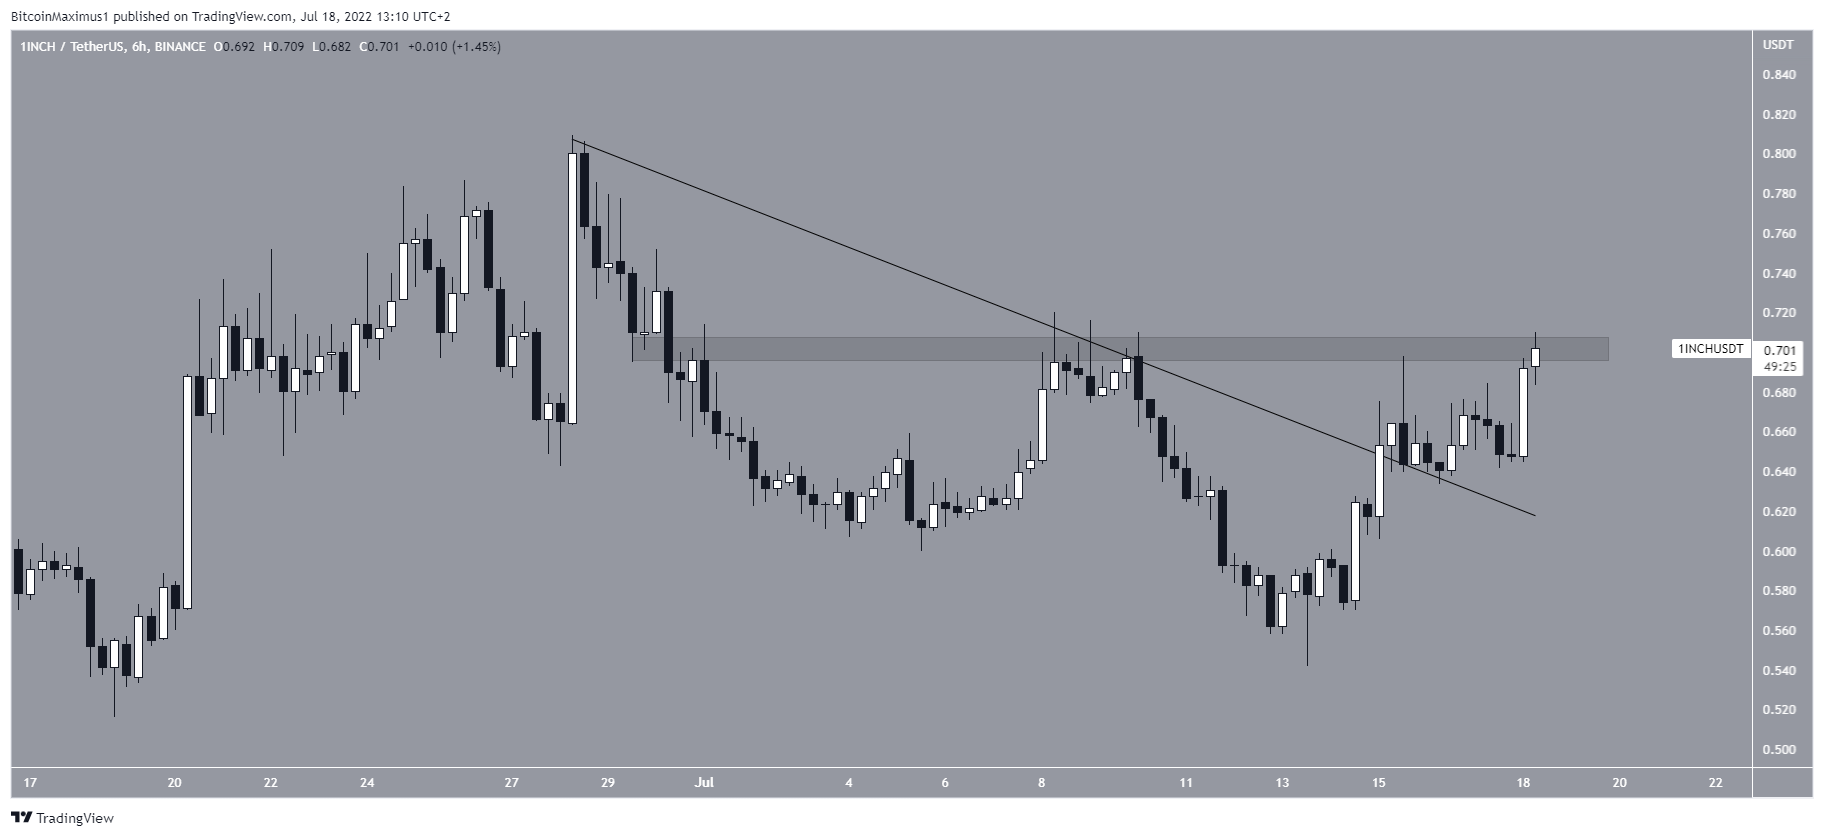
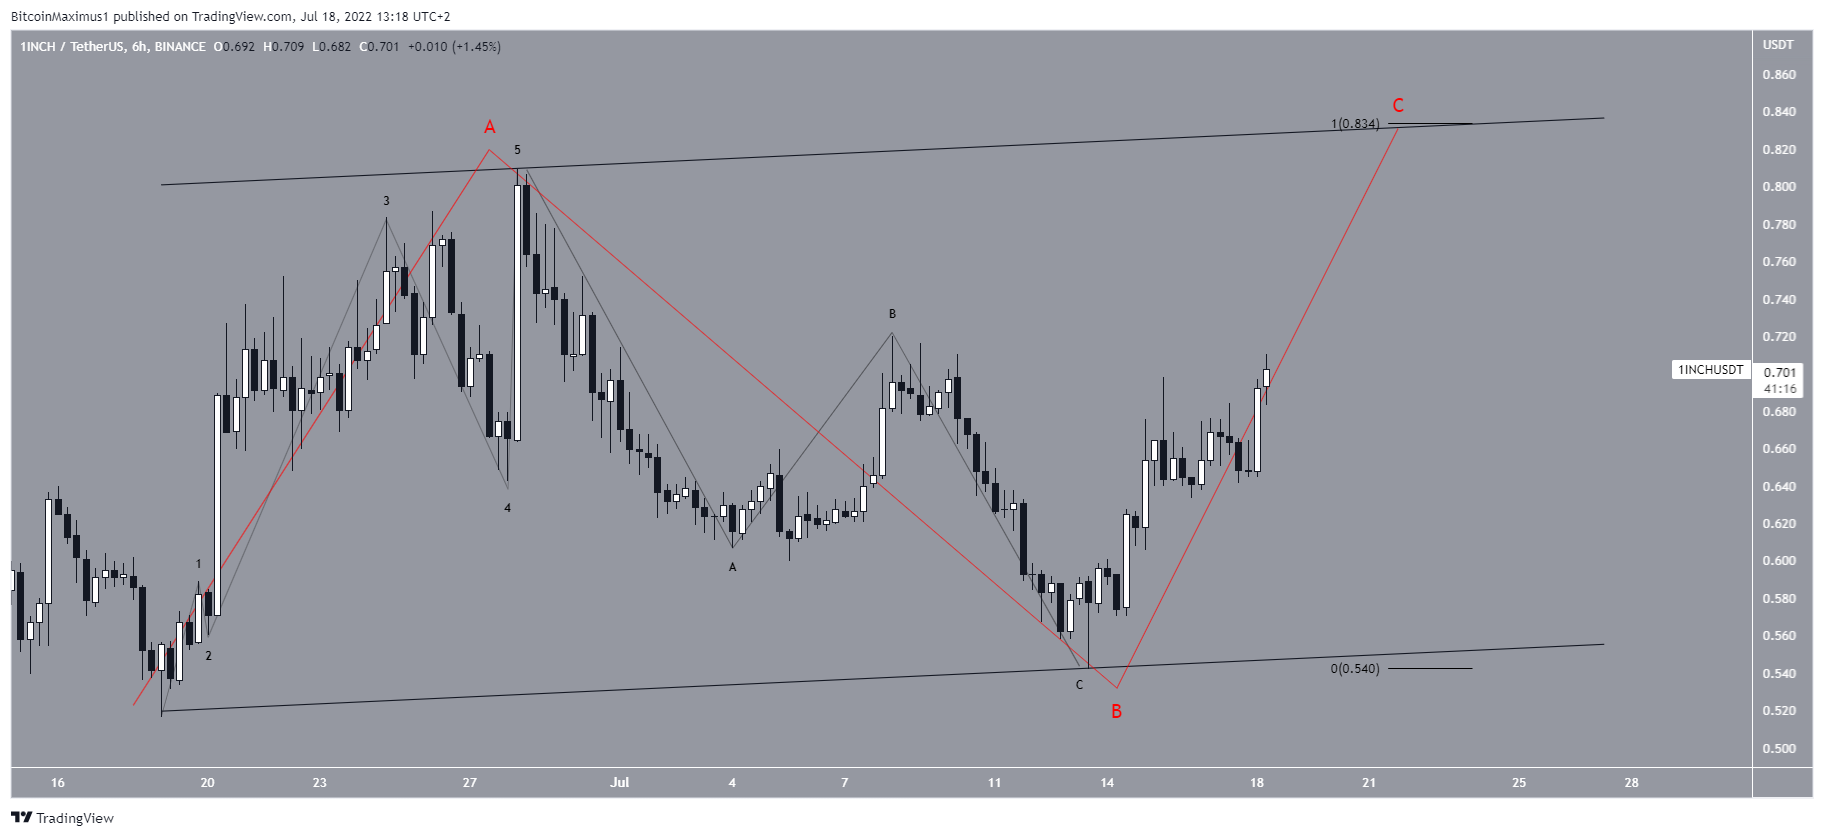
The six-hour chart aligns with this assessment, since it shows that the price has broken out from a descending resistance line and validated it as support afterwards.
Currently, it is making an attempt at breaking out above the $0.72 minor horizontal resistance area. If successful in doing so, and afterwards breaks out from the $0.77 area, the rate of increase could accelerate greatly.
1INCH wave count analysis
The wave count suggests that the price has completed a five-wave upward movement and ensuing A-B-C corrective structure (black). Afterward, on July 14, the price initiated yet another upward movement.
As of right now, it is not clear if the longer-term upward movement is an A-B-C corrective structure (red) or a full-blown bullish reversal.
Even if the entire upward movement is corrective, 1INCH would be expected to reach the $0.83 level. This would give waves A:C a 1:1 ratio.
If the price manages to move above this level, it would mean that the price has begun a new upward movement.
For Be[in]Crypto’s latest bitcoin (BTC) analysis, click here.
