


0x (ZRX) has been decreasing since April and has reached a support level not touched since Aug. 2020.
Indicators are showing some bullish signs, but the price action remains bearish until the $1.22 area is reclaimed.
Long-term ZRX levels
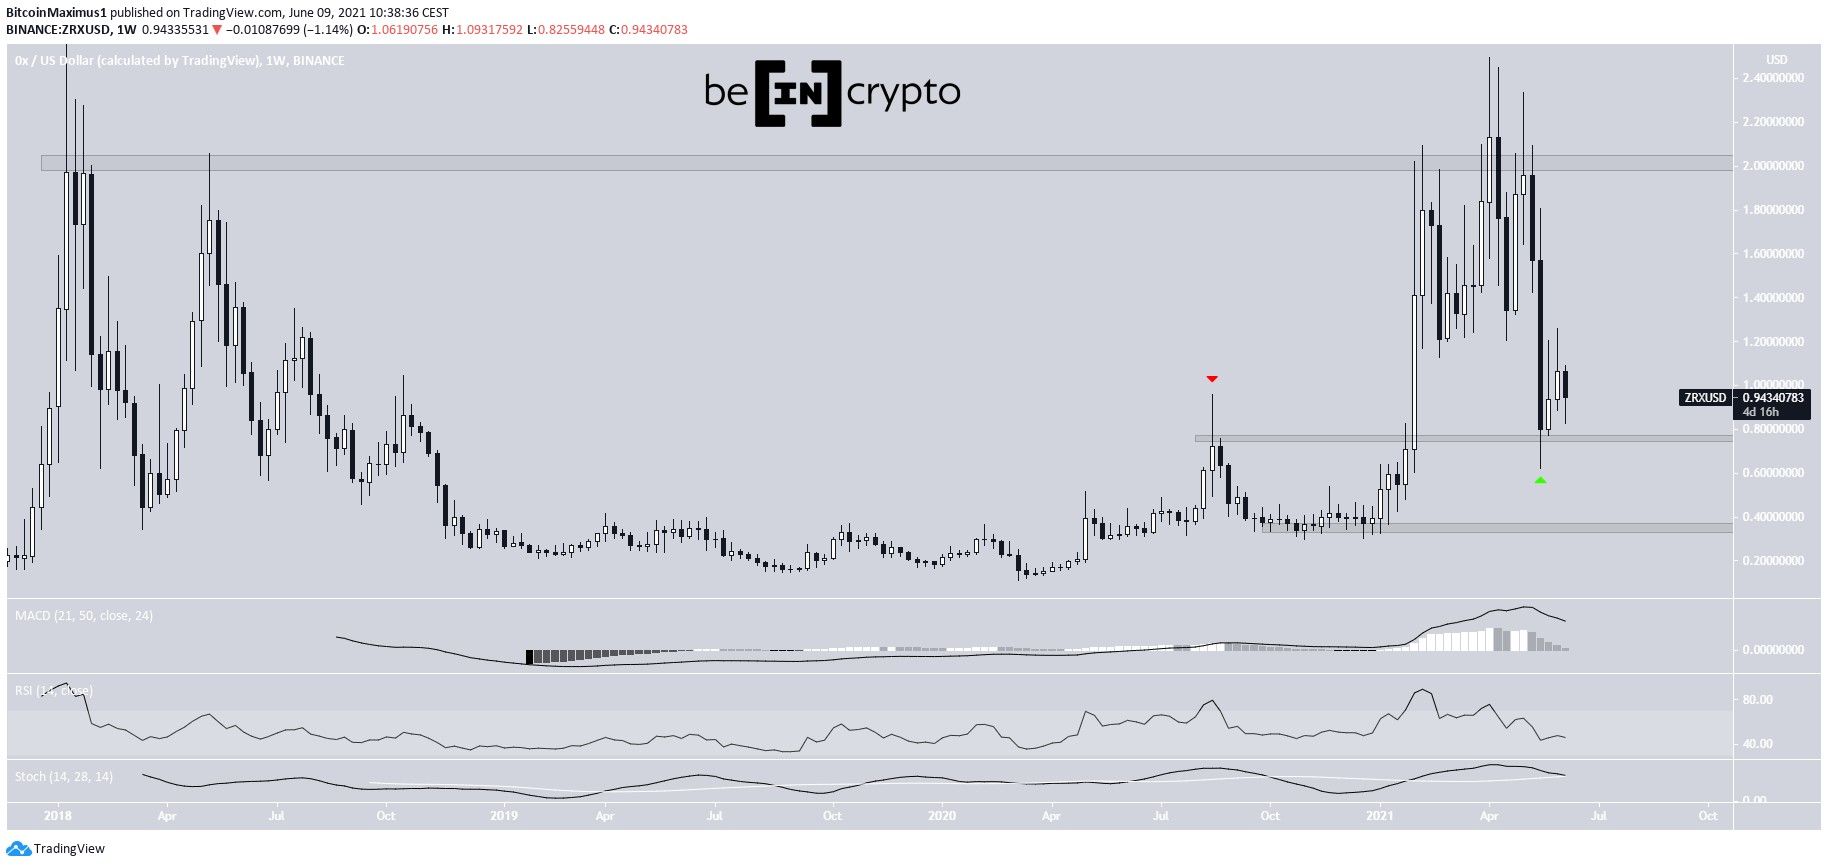
ZRX has been decreasing since reaching a high of $2.49 in April. At the time, it barely failed to reach a new all-time high price.
Afterwards, it validated the $2 area as resistance and moved downwards at an accelerated rate.
On May 23, it reached a low of $0.62 and bounced (green icon). This validated the $0.76 area as support, a level that previously had acted as resistance in Aug. 2020 (red icon).
Despite the re-test, technical indicators are bearish. The MACD & RSI are decreasing, the latter dropping below 50. The Stochastic oscillator has just made a bearish cross.
A breakdown below the $0.76 area could trigger a sharp fall towards $0.36.
Future movement
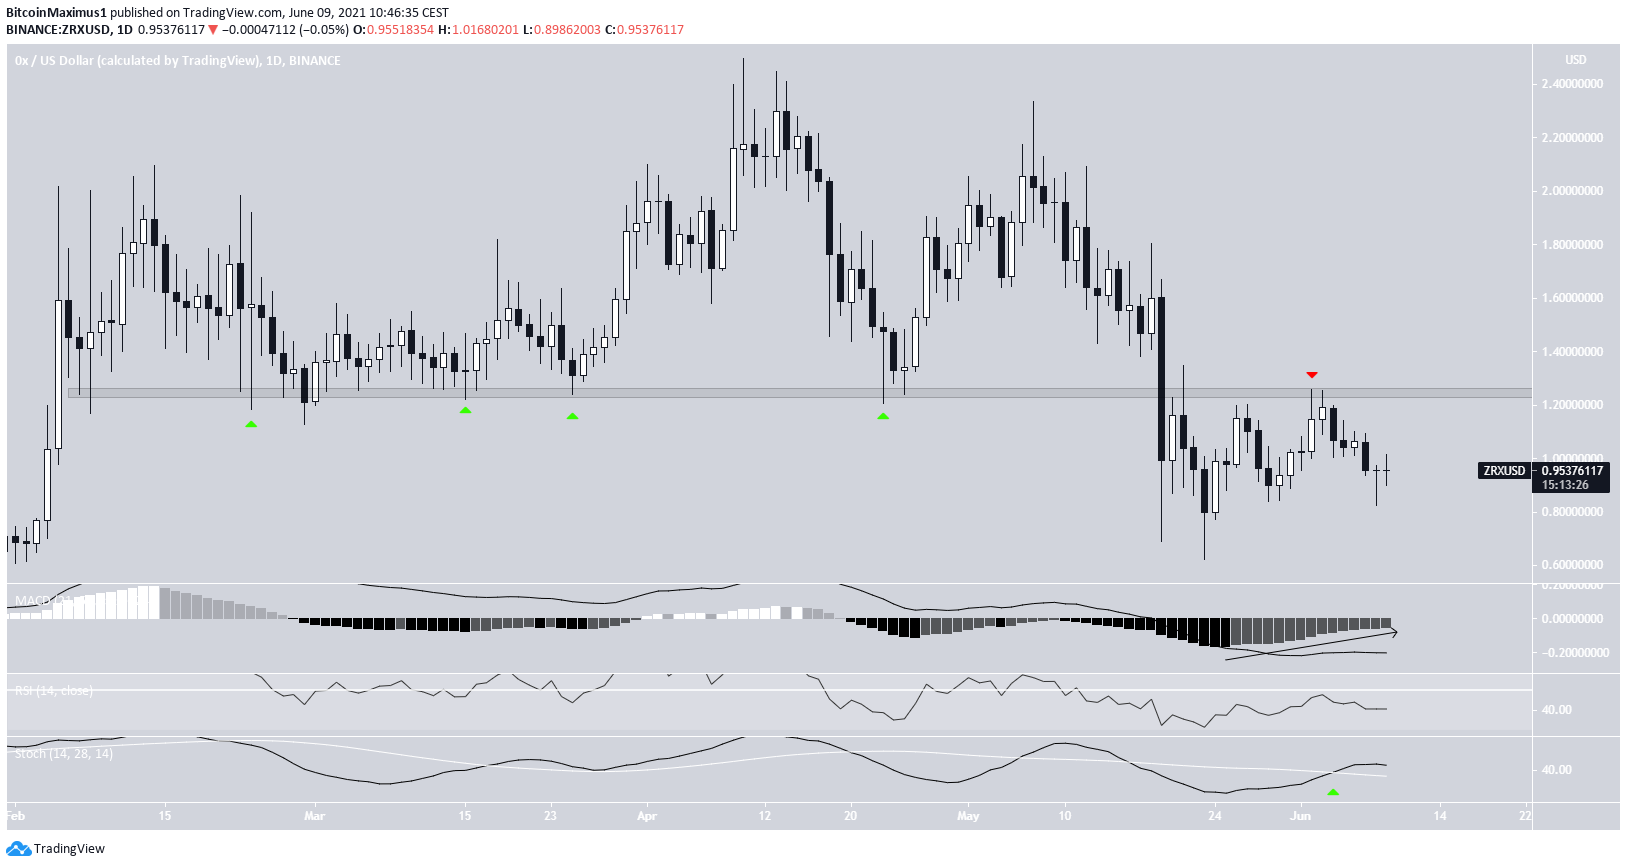
The daily chart does not provide a clear direction for the ensuing movement.
Technical indicators are showing some bullish signs, such as the bullish cross in the stochastic oscillator and the increasing MACD.
However, the MACD is still negative and the RSI is below 50.
In addition to this, the token has been rejected by the $1.22 resistance area (red icon). Prior to this, the area had been acting as support since Feb. 2021.
Therefore, despite the presence of some bullish signs, the trend cannot be considered bullish until the $1.22 area is reclaimed.
ZRX/BTC
Cryptocurrency trader @TheEuroSniper outlined a ZRX/BTC chart, stating that an increase towards 4700 satoshis would be likely.
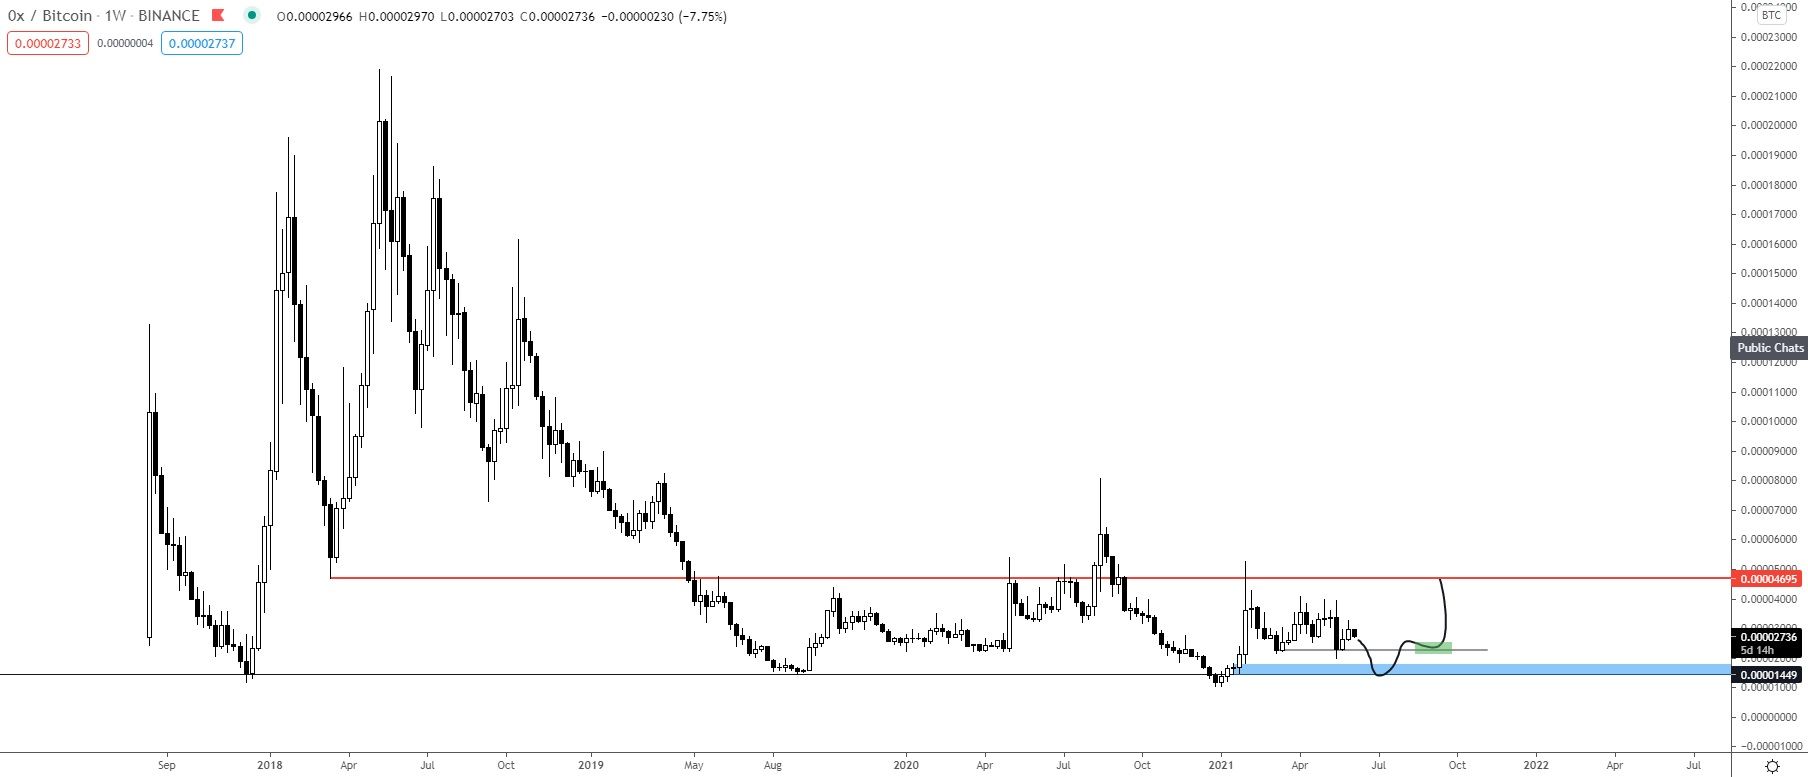
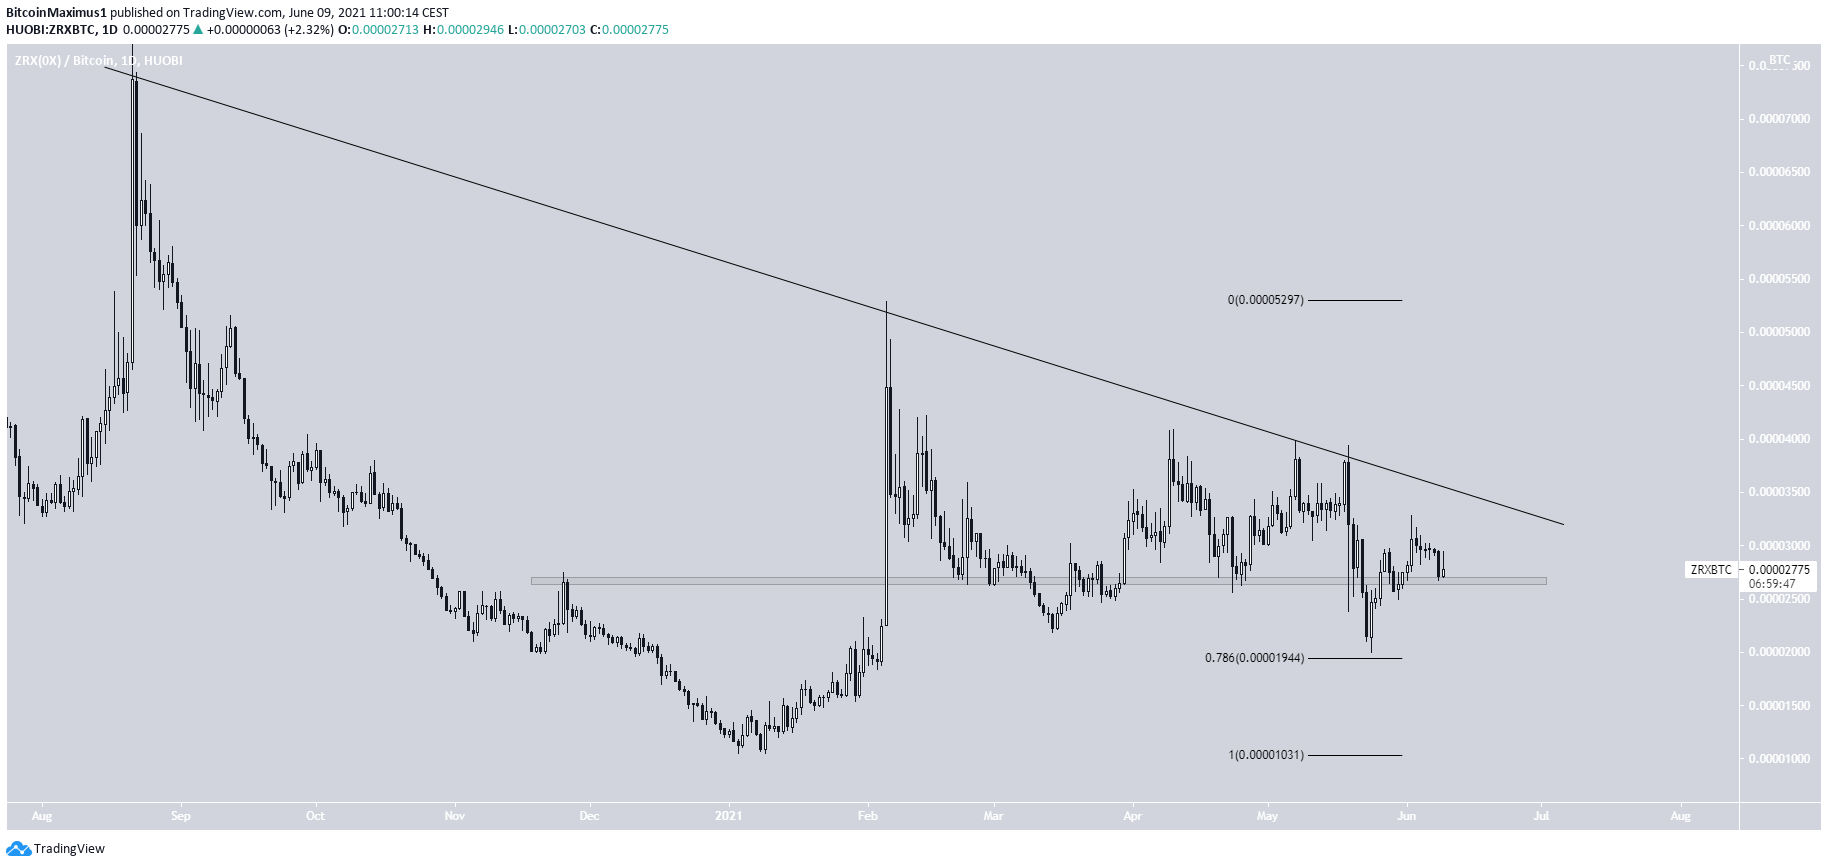
The chart for ZRX/BTC does look more bullish than its USD counterpart, mostly because of the bounce at the 0.786 Fib retracement support level and the reclaim of the 2680 satoshi area afterwards.
However, it is still following a descending resistance line that has been in place since Aug. 2020.
In order for ZRX to move towards the proposed target of 4700 satoshis, first it has to break out from this resistance line.
For BeInCrypto’s latest bitcoin (BTC) analysis, click here.


