


The Zilliqa (ZIL) price has reclaimed an important support level and should continue moving upwards as long as it’s trading above.
Trading Range
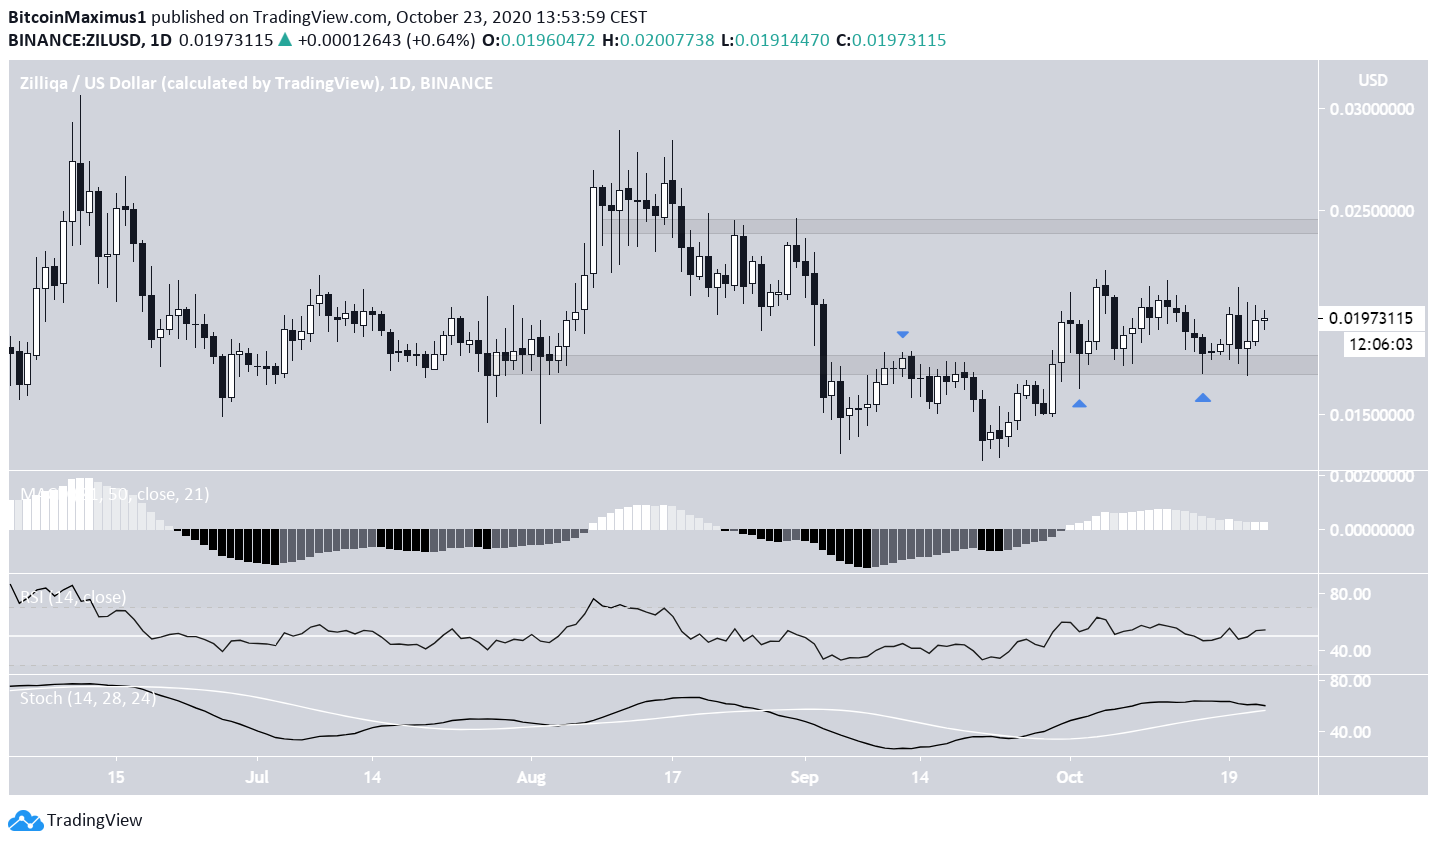
ZIL has been falling since Aug 11, when the price closed at a local high of $0.0306 on June 11. After reaching a lower high of $0.028 on Aug 11, the price resumed its downward trend, reaching a low of $0.012 on Sept 21.
The price is currently trading above the $0.0177 handle, which has intermittently acted as both support and resistance. Since the beginning of October, the price has validated the area three times as support.
Technical indicators are neutral, leaning on bullish. While all three of the MACD, RSI, and Stochastic Oscillator are positive, their slope has begun to straighten.
If the price moves upwards, the closest resistance level would be found $0.0243.
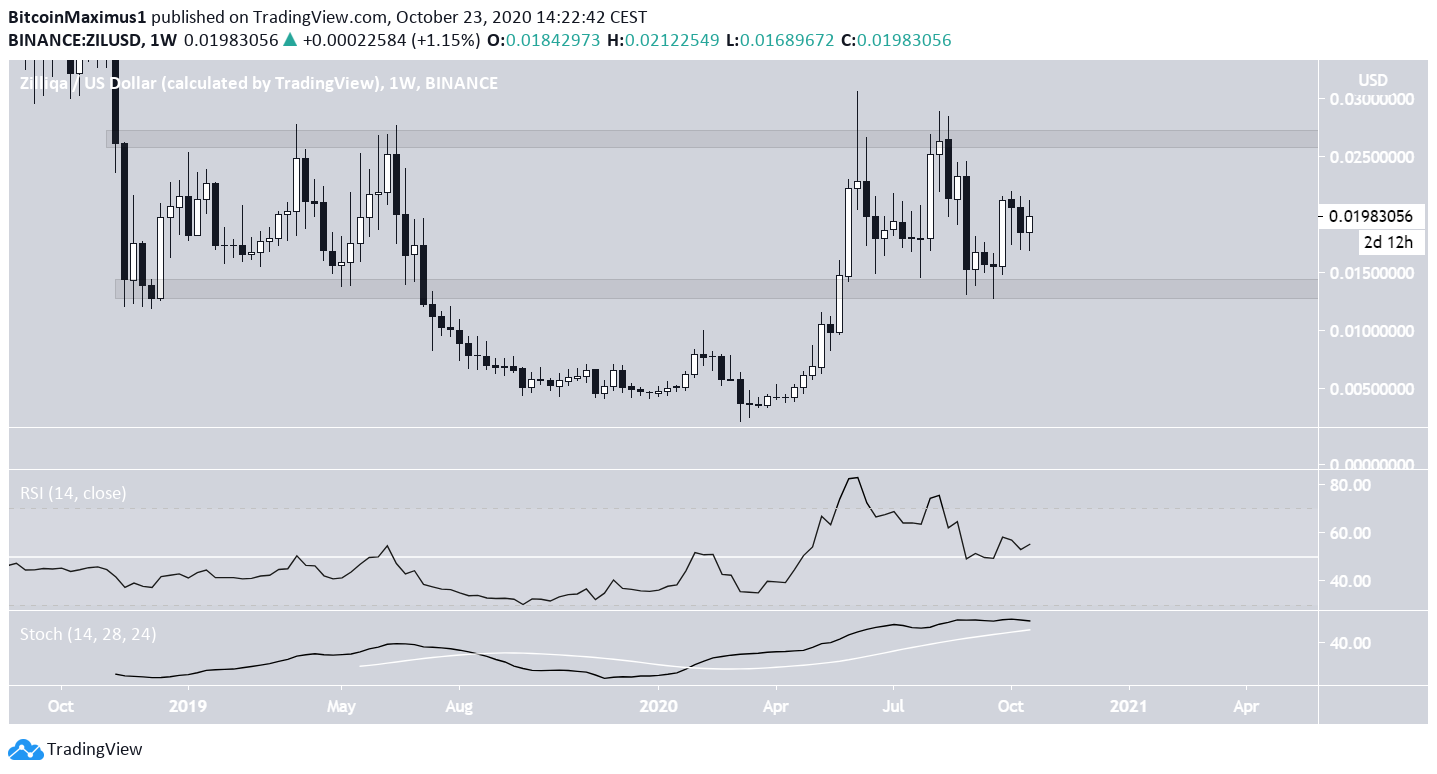
The longer-term weekly chart gives a similar outlook, albeit with a wider range between $0.0138 – $0.0267. At the time of writing, the price has bounced above the former and created a bullish engulfing candlestick.
Readings from technical indicators are also similar to those on the daily time-frame. While the RSI is above 50 and the Stochastic Oscillator has made a bullish cross, the latter’s slope has almost turned negative, and the RSI is not moving upwards with strength.
However, as long as the price is trading above the $0.0138 support, the most likely scenario is a rally towards the $0.0267 resistance area.
Wave Count
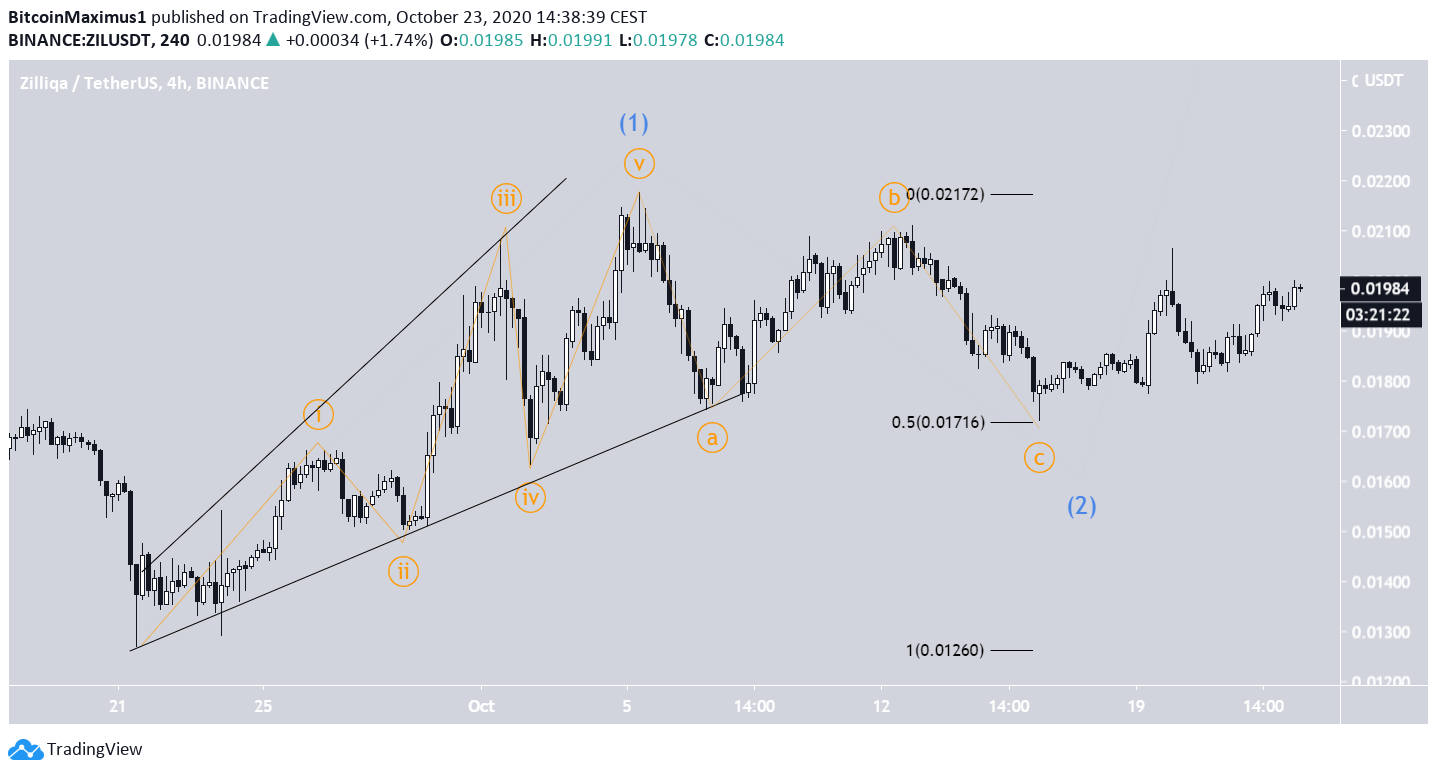
Cryptocurrency trader @TheEWguy outlined a ZIL chart and stated that he is seeing a possible bullish impulse developing.
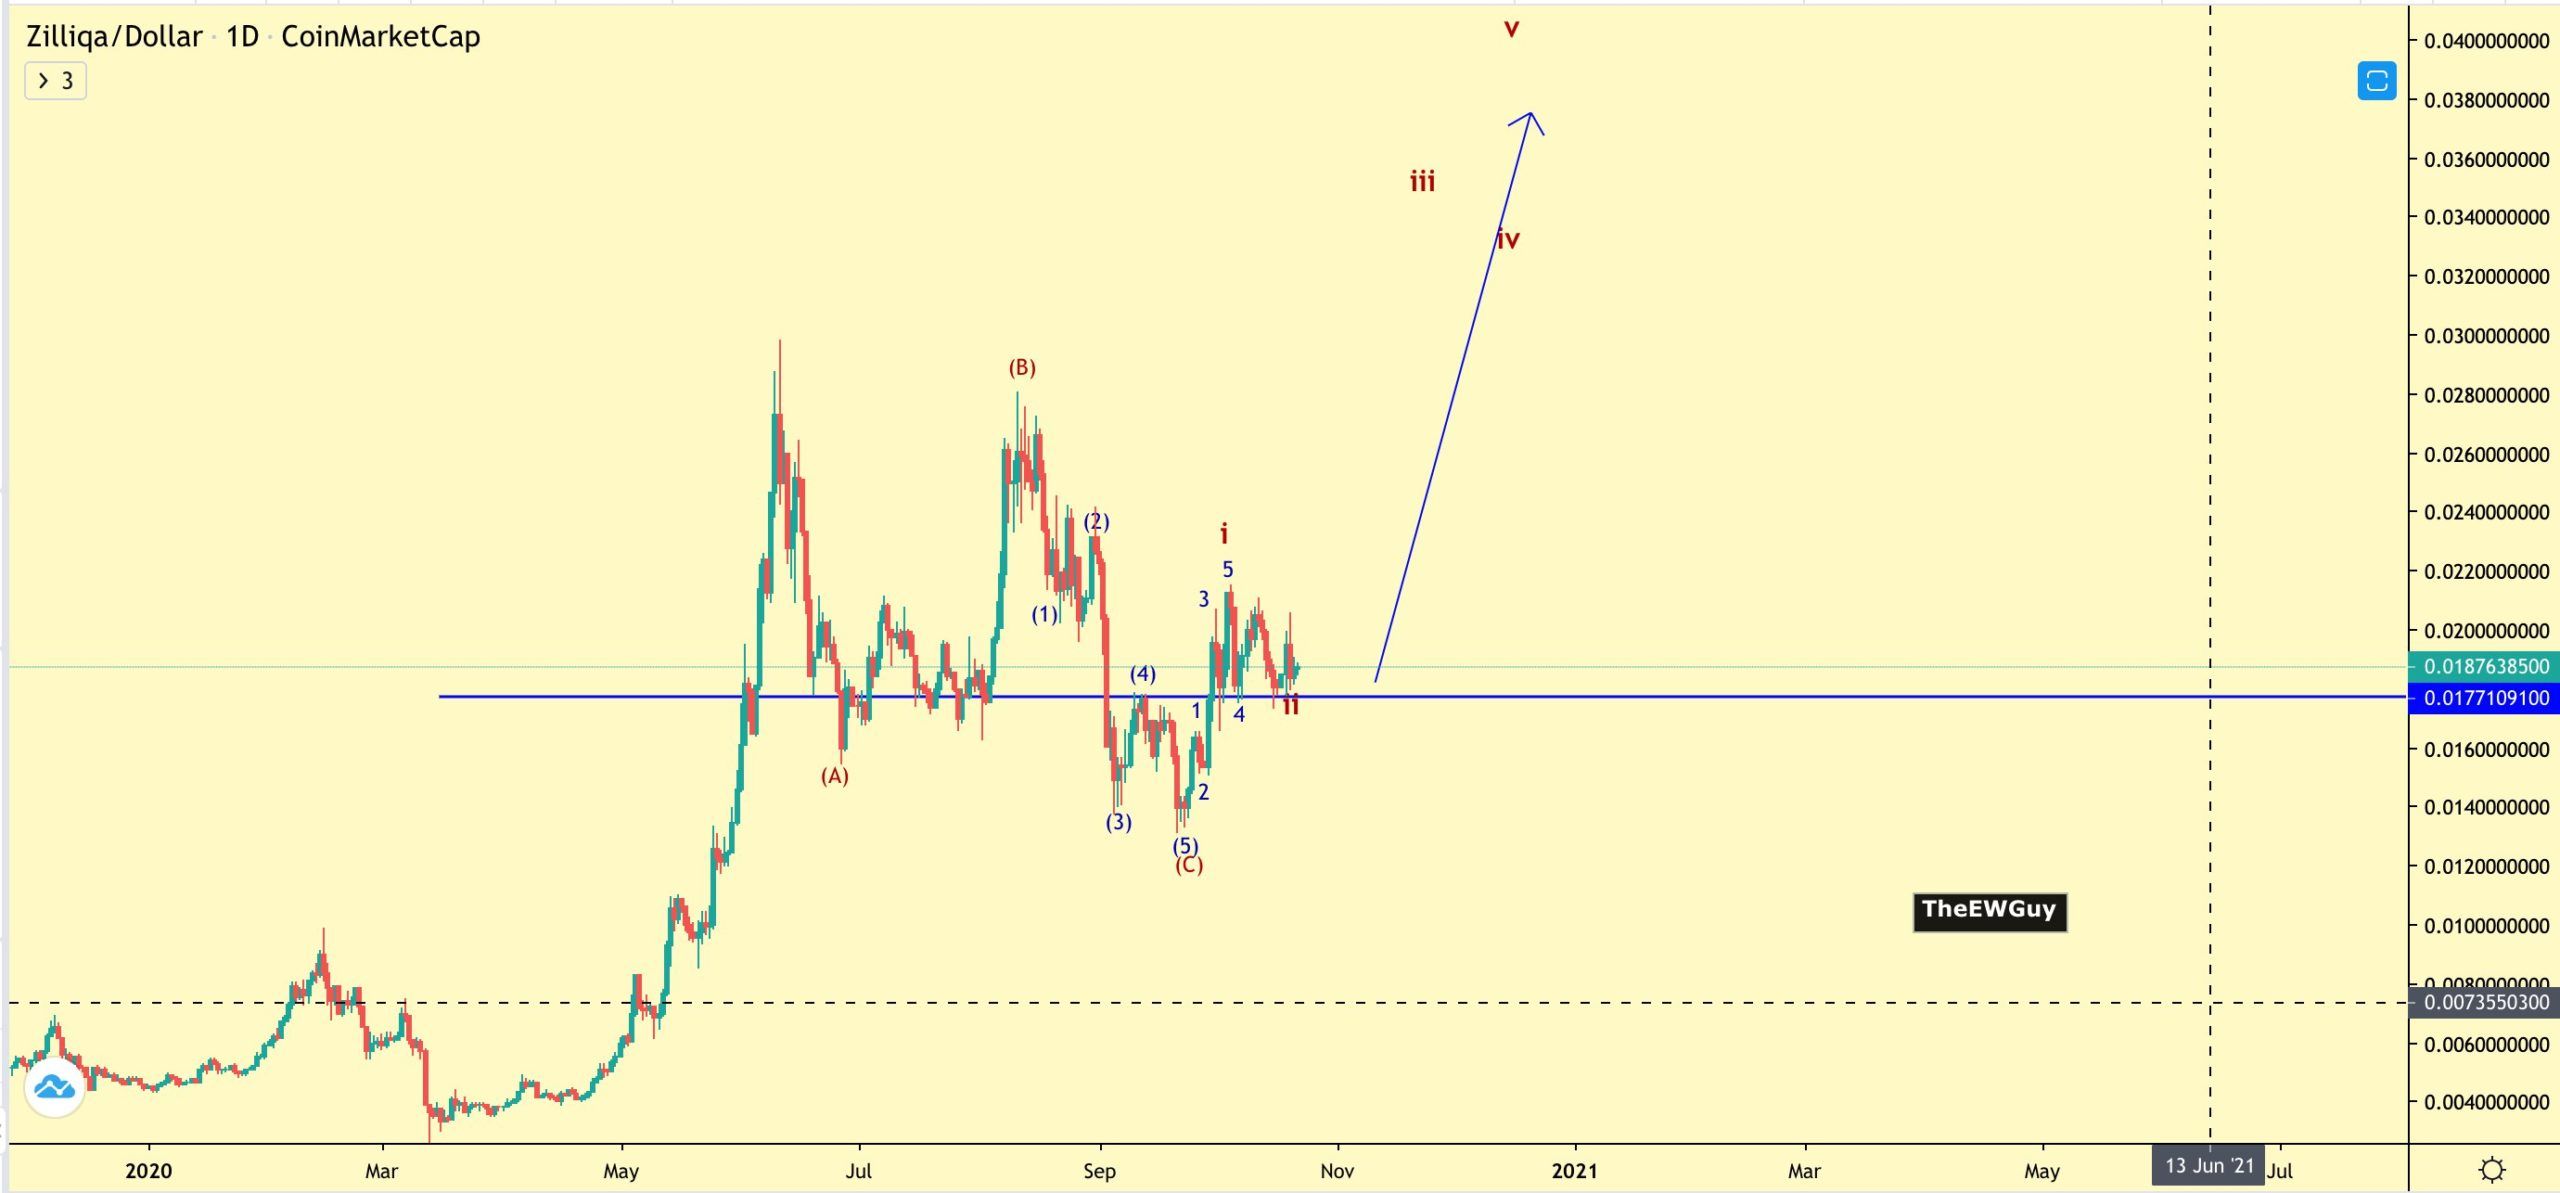
Since the previous Aug 11 high, it seems that the price has completed a textbook A-B-C formation (shown in black below), in which waves A:C had an exact 1:1 ratio. In addition, we can clearly see five subdivisions outlined in wave C (blue).
If correct, the price began a new bullish impulse after the Sept 21 low.
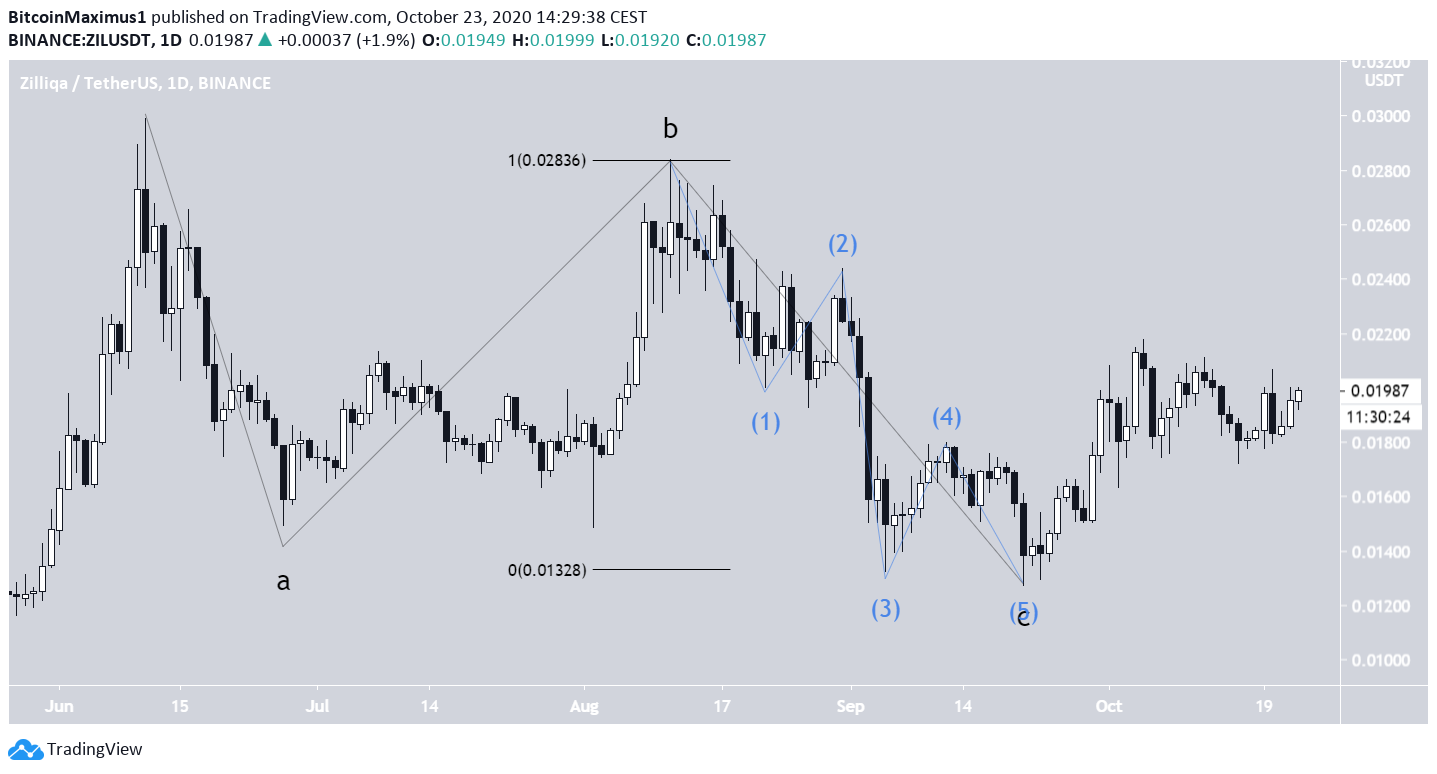
If so, the price has completed waves 1 – 2 of the new impulse (blue), which were created by an expanding diagonal (orange) and an A-B-C correction that reached the 0.5 Fib level of the entire upward move.
A decline below the C wave low would invalidate the short-term count (orange), while a decline below the Sept 21 low at $0.012 would invalidate the bullish hypothesis.
To conclude, it’s possible that ZIL has begun a new bullish impulse and will continue rallying towards the resistance levels outlined above.
For BeInCrypto’s previous Bitcoin analysis, click here!
Disclaimer: Cryptocurrency trading carries a high level of risk and may not be suitable for all investors. The views expressed in this article do not reflect those of BeInCrypto.


