


Zilliqa (ZIL) is showing long-term bullish reversal signs in both its price action and technical indicator readings.
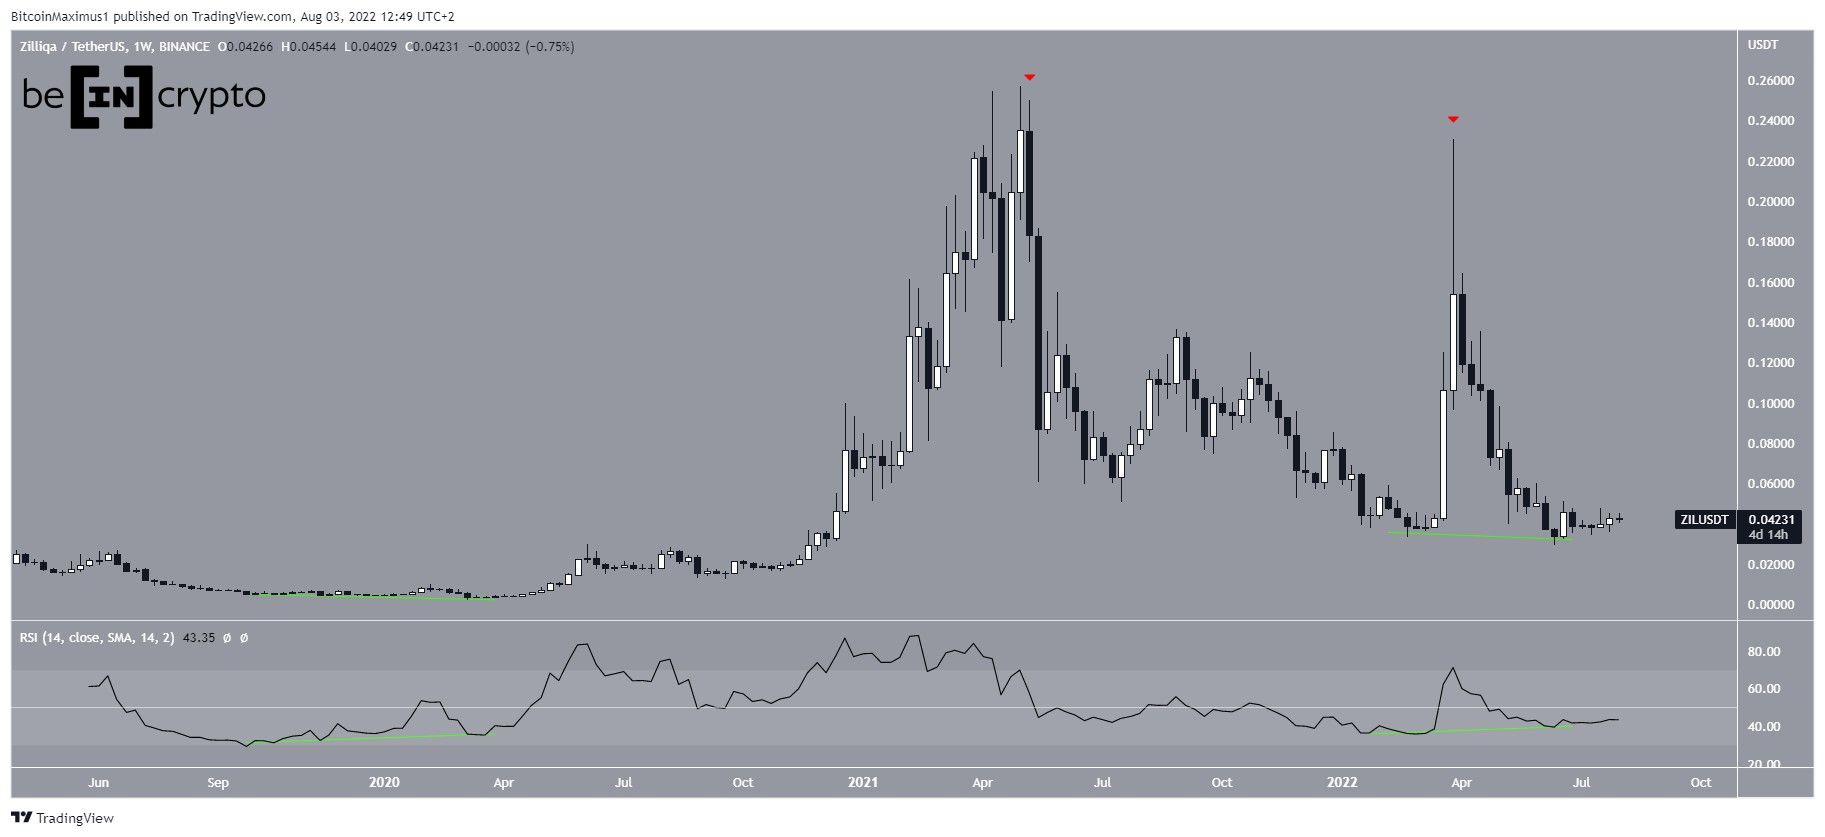
ZIL has been falling since reaching an all-time high price of $0.25 in May 2021. Afterward, it created a slightly lower high and a very long upper wick in April 2022 (red icon) before resuming its downward movement.
So far, the price has fallen to a low of $0.029 on June 29.
A very interesting development is the bullish divergence created in the weekly RSI (green line). Such divergences often precede bullish trend reversals. The fact that it is transpiring in the weekly time frame further increases its legitimacy.
This is only the second time in history in which the weekly RSI has generated bullish divergence. The first was in March 2020 and led to the aforementioned all-time high price.
ZIL breaks out
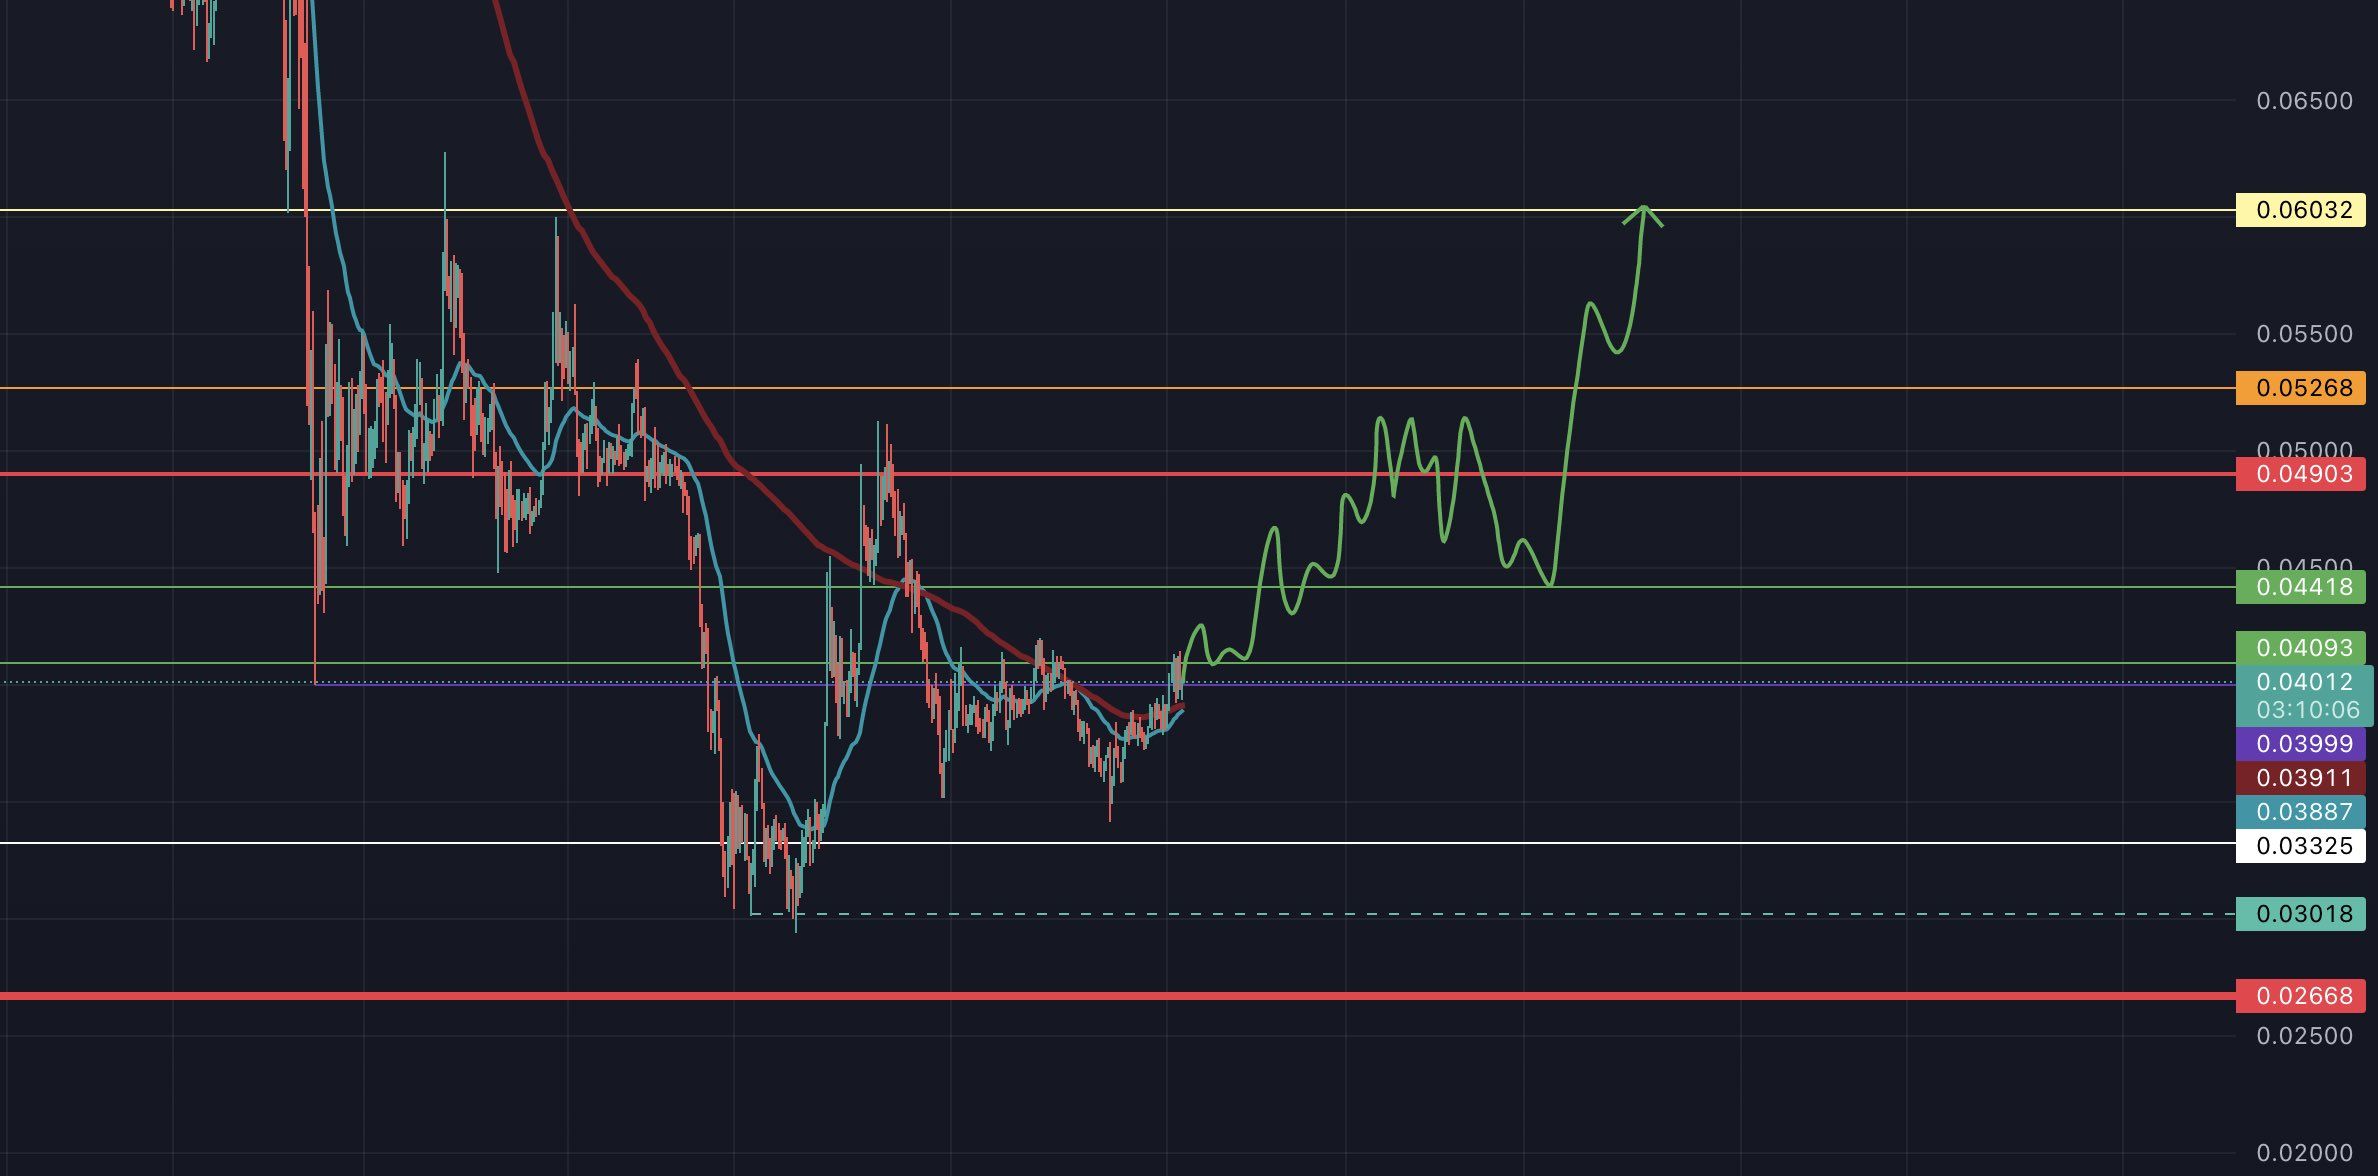
Cryptocurrency trader @bobthebagfinder tweeted a chart of ZIL, stating that the price could eventually increase all the way to $0.06.
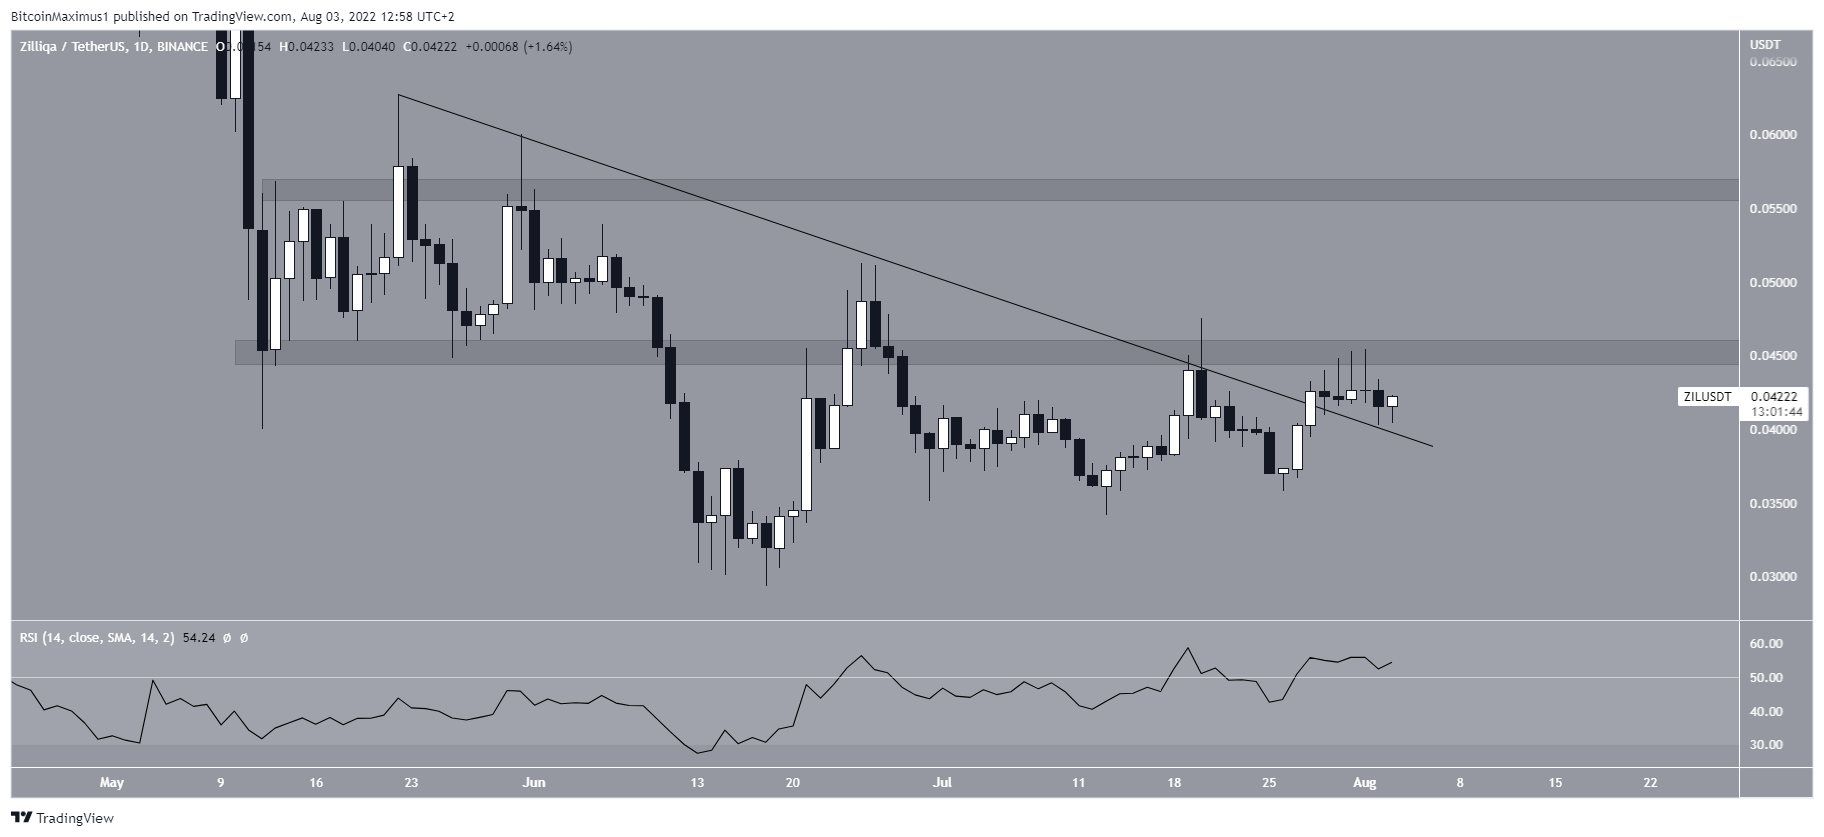
The daily chart provides two decisive bullish signs. Firstly, the price has broken out from a descending resistance line and is in the process of validating it as support.
Secondly, the daily RSI has broken out above 50, in what is also considered a sign of a bullish trend.
Currently, ZIL is attempting to break out from the $0.045 resistance area. If successful, the next resistance would be at $0.565.
Wave count analysis
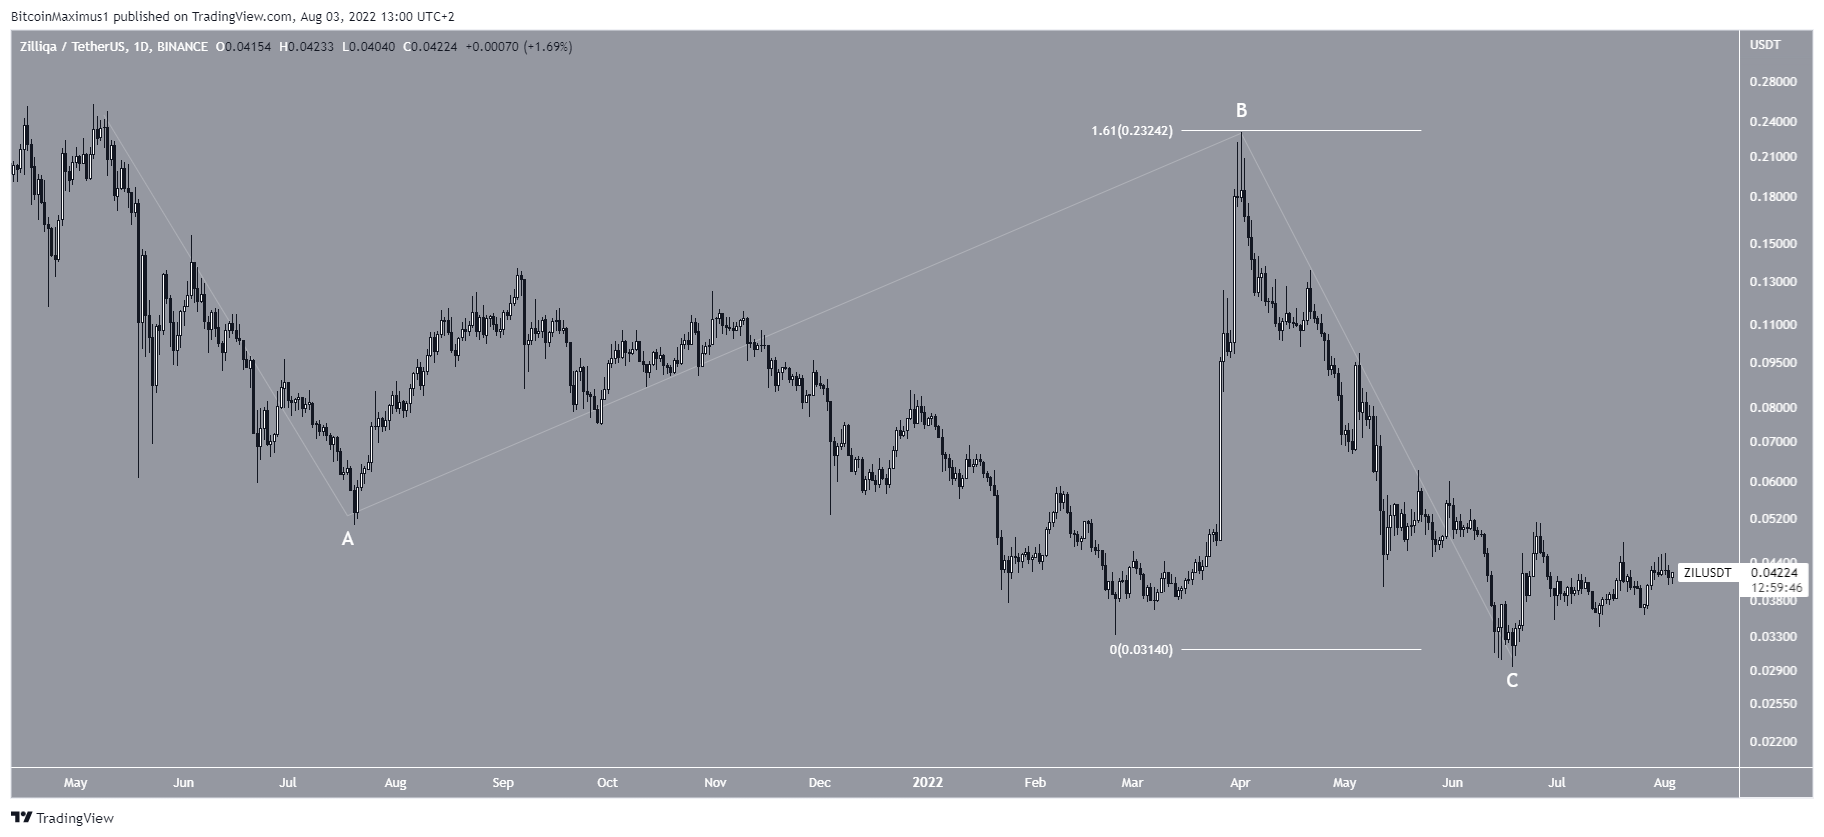
Finally, the wave count shows that since the all-time high, ZIL has seemingly completed an A-B-C corrective structure (white). In it, waves A:C have had an exactly 1:1 ratio, which is common in such structures.
So, the wave count aligns with the readings from the weekly and daily time frames, which suggest that a long-term bullish reversal could occur.
For Be[in]Crypto’s latest Bitcoin (BTC) analysis, click here


