


The Zilliqa (ZIL) price presumably broke out from a long-term resistance level on Nov. 25, but has fallen back below it since.
Despite the rapid decrease, ZIL is expected to reach a bottom soon and resume its upward movement.
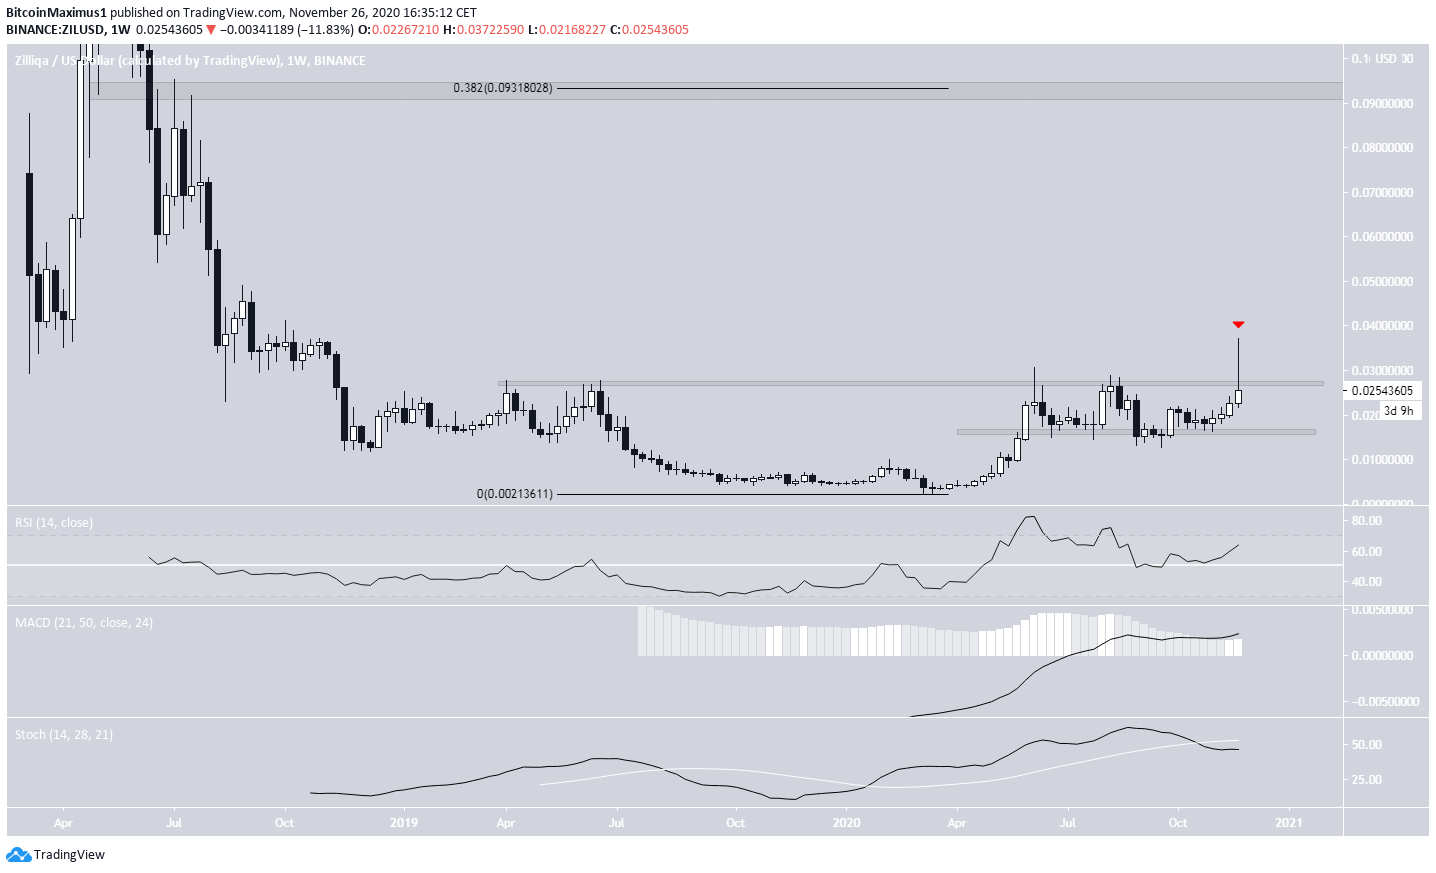
ZIL Long-Term Levels
Since June 2020, the ZIL price has been trading above the long-term $0.016 support level. After bouncing, the price initiated a rapid upward movement on Nov. 23 and seemingly broke out above the $0.027 area two days later.
ZIL has not reached a weekly close above this level since April 2019.
Once more, ZIL was rejected by the resistance and is now in the process of creating another long upper wick.
As for the future movement, technical indicators are ambiguous. The RSI and MACD are increasing, the former is above 50 while the latter above 0. The Stochastic oscillator has made a bearish cross.
Measuring from the all-time high price, the first significant Fib retracement level (0.382) is found at $0.093, so a weekly close above the $0.027 resistance area could trigger a rapid upward movement.
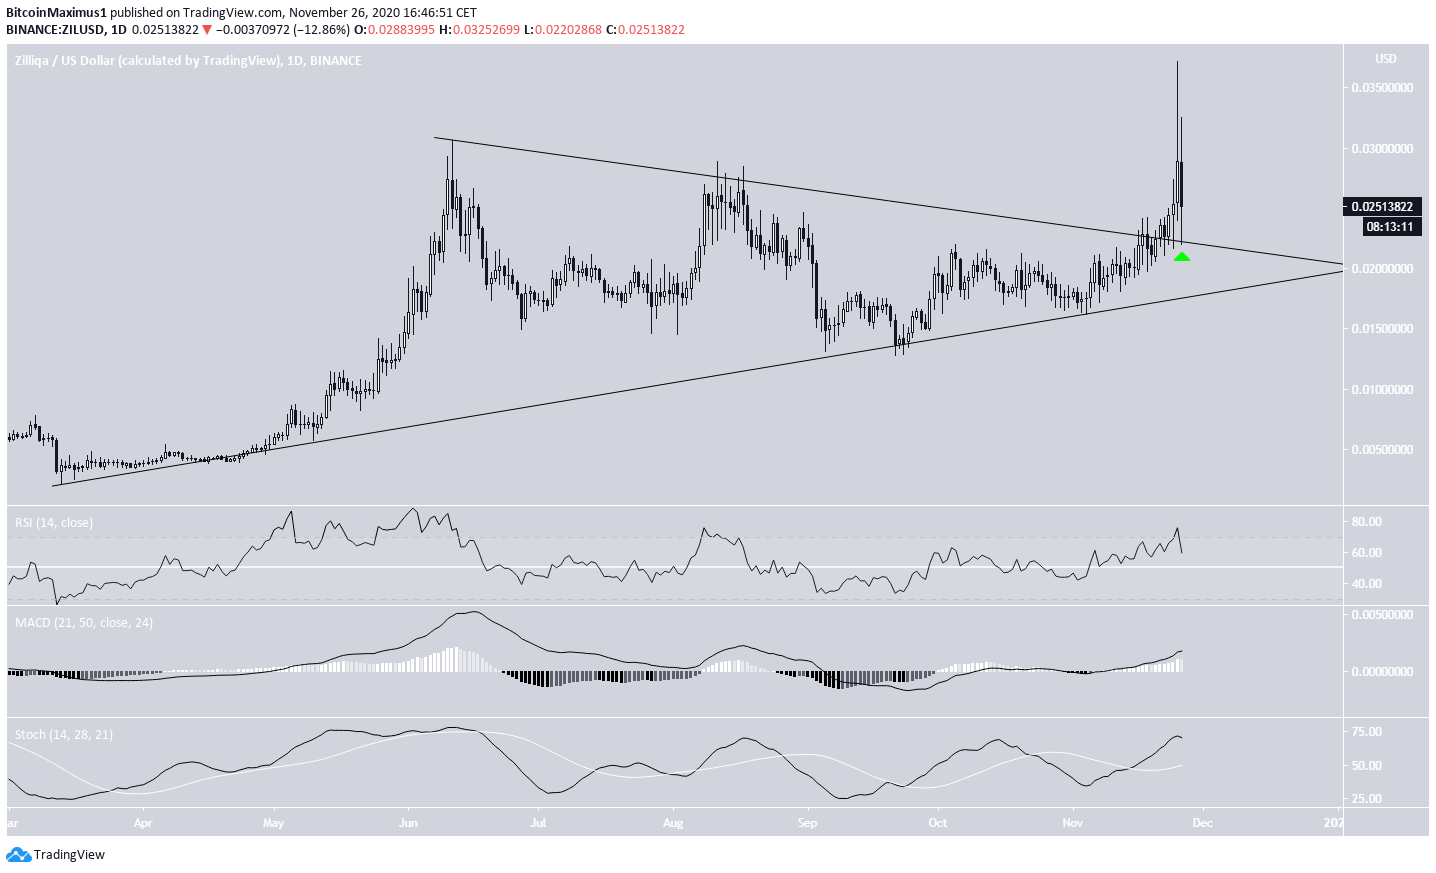
Possible Breakout
A look at the daily chart shows that ZIL has possibly broken out from a very long-term symmetrical triangle and validated it as support afterward (green arrow).
However, due to the presence of numerous wicks, the exact slope of the line is not confirmed.
Technical indicators are bullish and support a continued price increase, which would likely cause a breakout from the $0.027 resistance area.
ZIL Wave Count
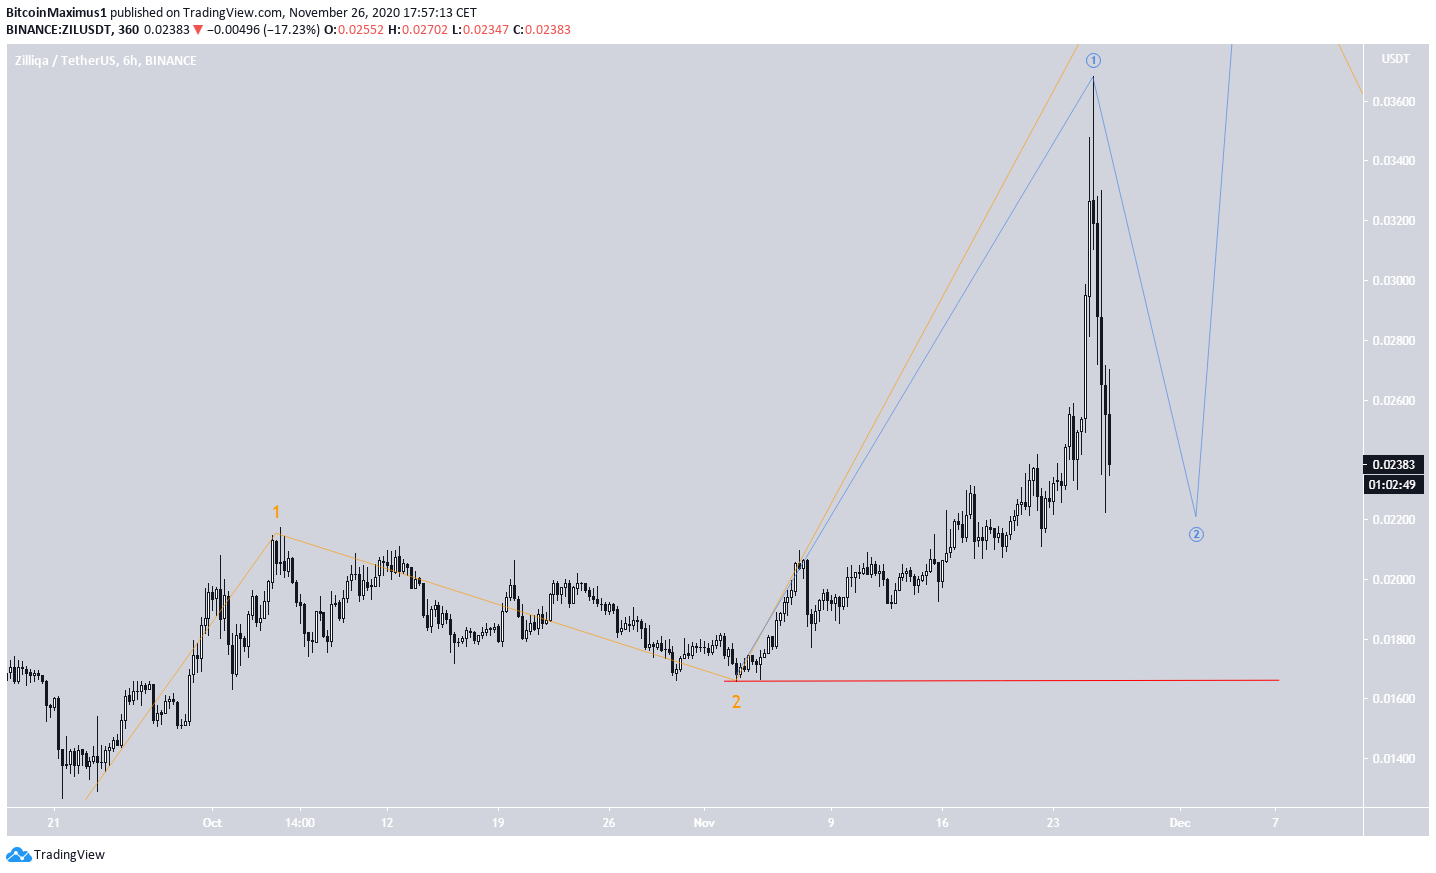
Cryptocurrency trader @TheEWguy outlined a ZIL chart, stating that the price is currently in wave 3 of a five-wave bullish formation that could take the price to $0.09.
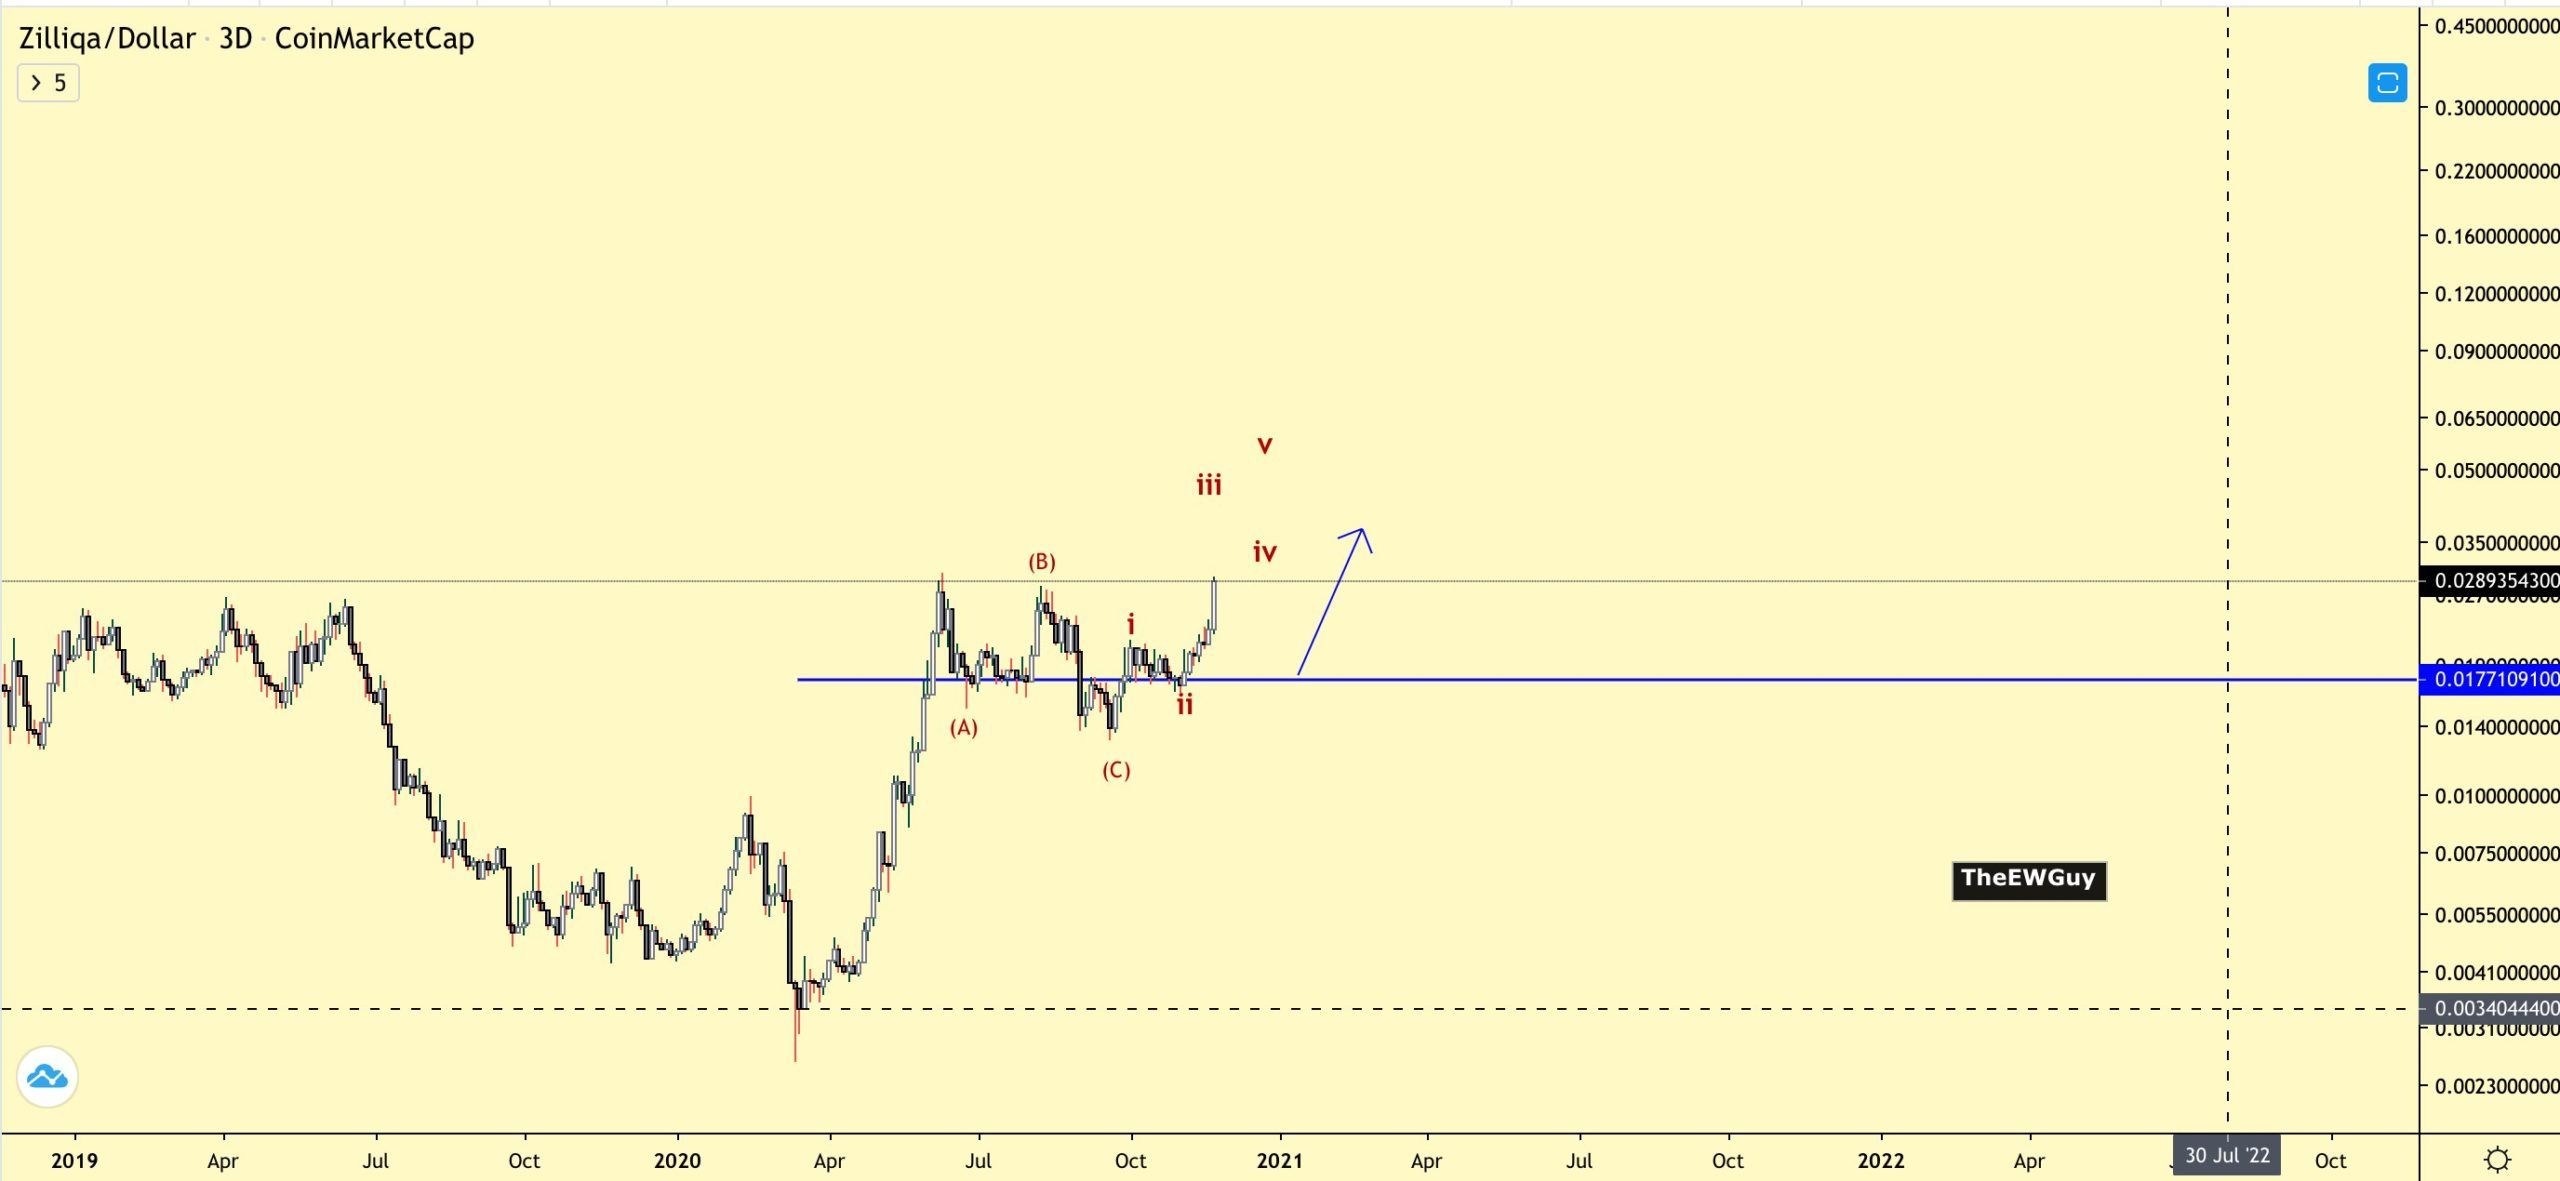
Measuring from March, it seems that ZIL has begun a bullish formation, completed cycle waves 1 and 2 (shown in white below), and is currently in cycle wave 3.
Cycle wave 3 seems to have begun on Sept. 21, and the price is currently in wave 4 (orange). A likely top for cycle wave 3 would be found near $0.046, a target found by using the 1.61 Fib extension of cycle wave 1 (white) and the 3.61 Fib extension of wave 1 (orange).
However, ZIL is very close to the invalidation level of this particular wave count at the top of wave 1 (red line) near $0.02175.
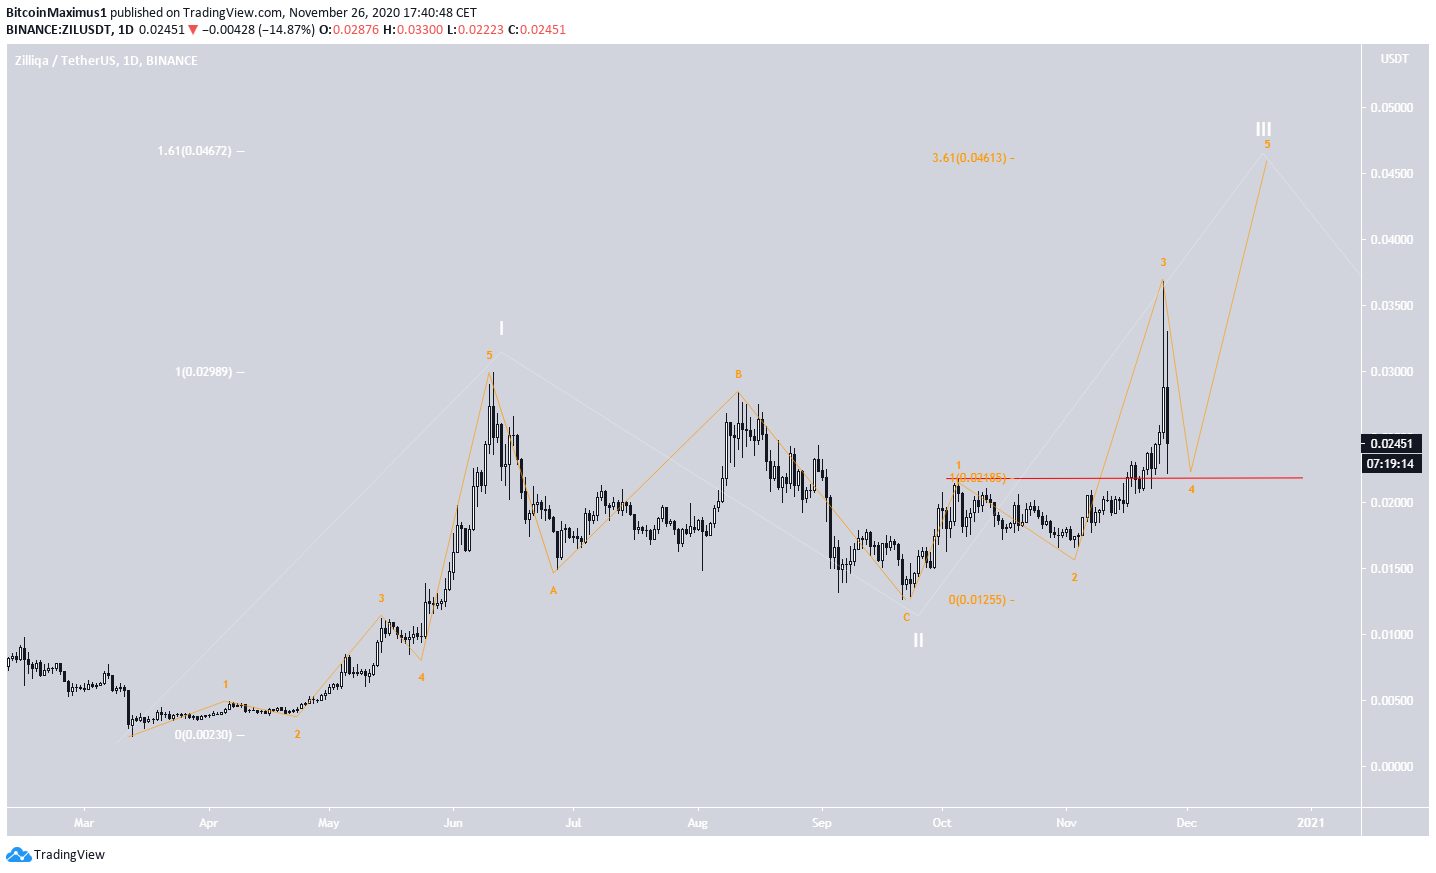
Therefore, it is possible that the movement is a 1-2/1-2 wave formation instead, but its shape is extremely unusual. The difference between these two counts is that the latter would eventually lead to a much stronger upward move, due to the extension of wave 3.
This count would be invalidated with a decrease below $0.0166 (red line).
Conclusion
To conclude, the ZIL price is expected to soon reverse its trend and begin moving upwards towards $0.46 and possibly higher.
For BeInCrypto’s latest Bitcoin analysis, click here!
Disclaimer: Cryptocurrency trading carries a high level of risk and may not be suitable for all investors. The views expressed in this article do not reflect those of BeInCrypto


