


Zilliqa (ZIL) has moved above both diagonal and horizontal levels and is approaching the Sept highs. Due to the lack of overhead resistance, it has the potential for considerable increases.
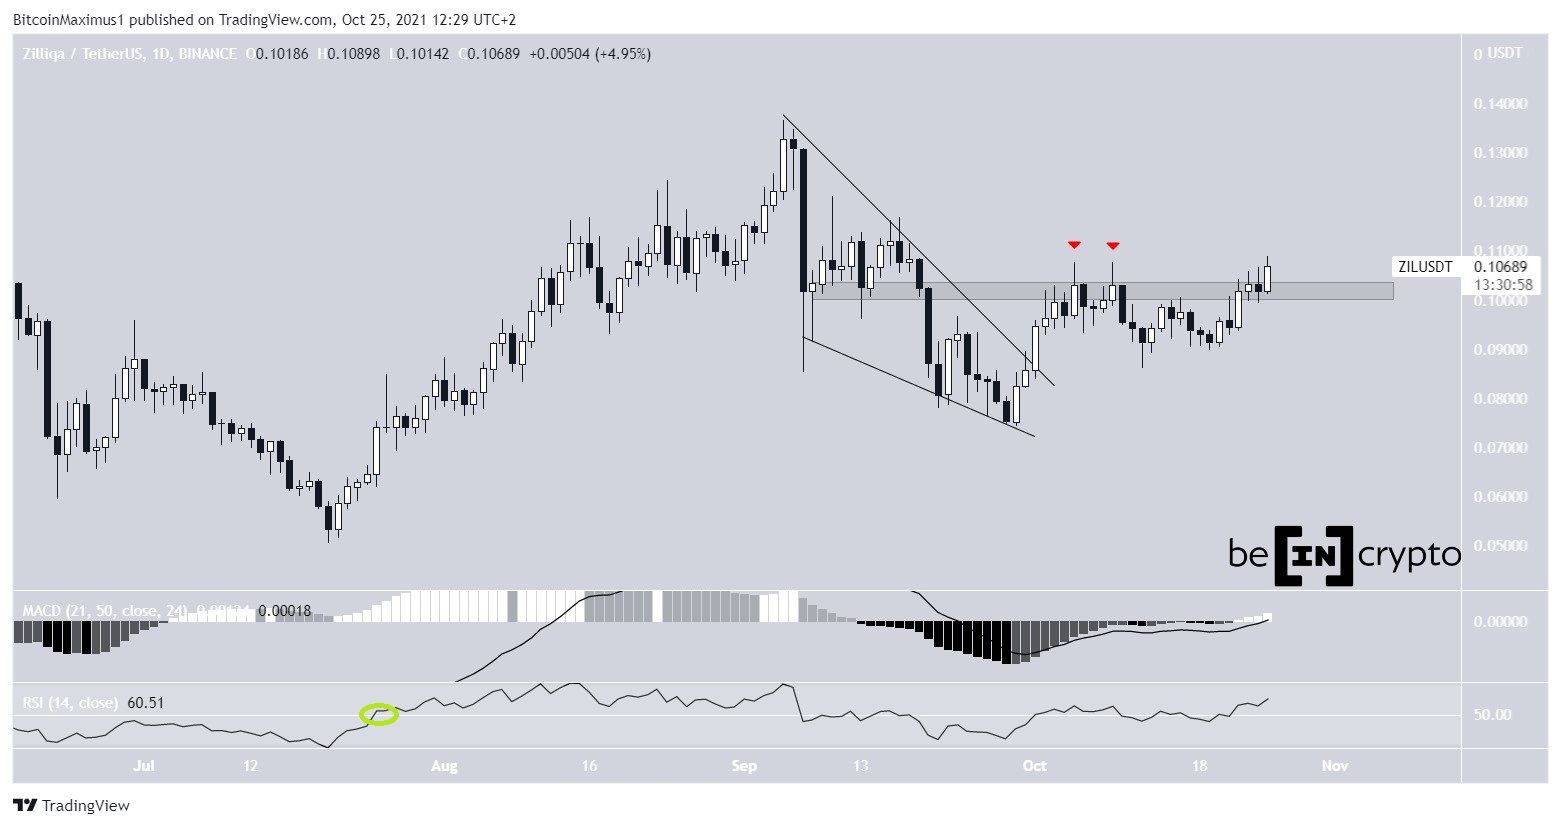
The daily chart shows that ZIL has been moving upwards since breaking out from a descending wedge on Oct 1. The wedge is considered a bullish pattern, meaning that a breakout is expected in the majority of cases.
Initially, the token struggled to move above the $0.102 resistance area (red icon). However, after the initial rejection, ZIL managed to break out on Oct 25.
The next resistance area is at $0.13, created by the Sept highs.
Technical indicators in the daily time frame support the continuation of the upward movement. The MACD is positive and increasing. This means that the short-term trend is faster than the long-term one.
The RSI, which is a momentum indicator has moved above 50. This usually occurs at the beginning of upward movements. The previous time it occurred was on July 24 (green circle), at the beginning of the upward movement.
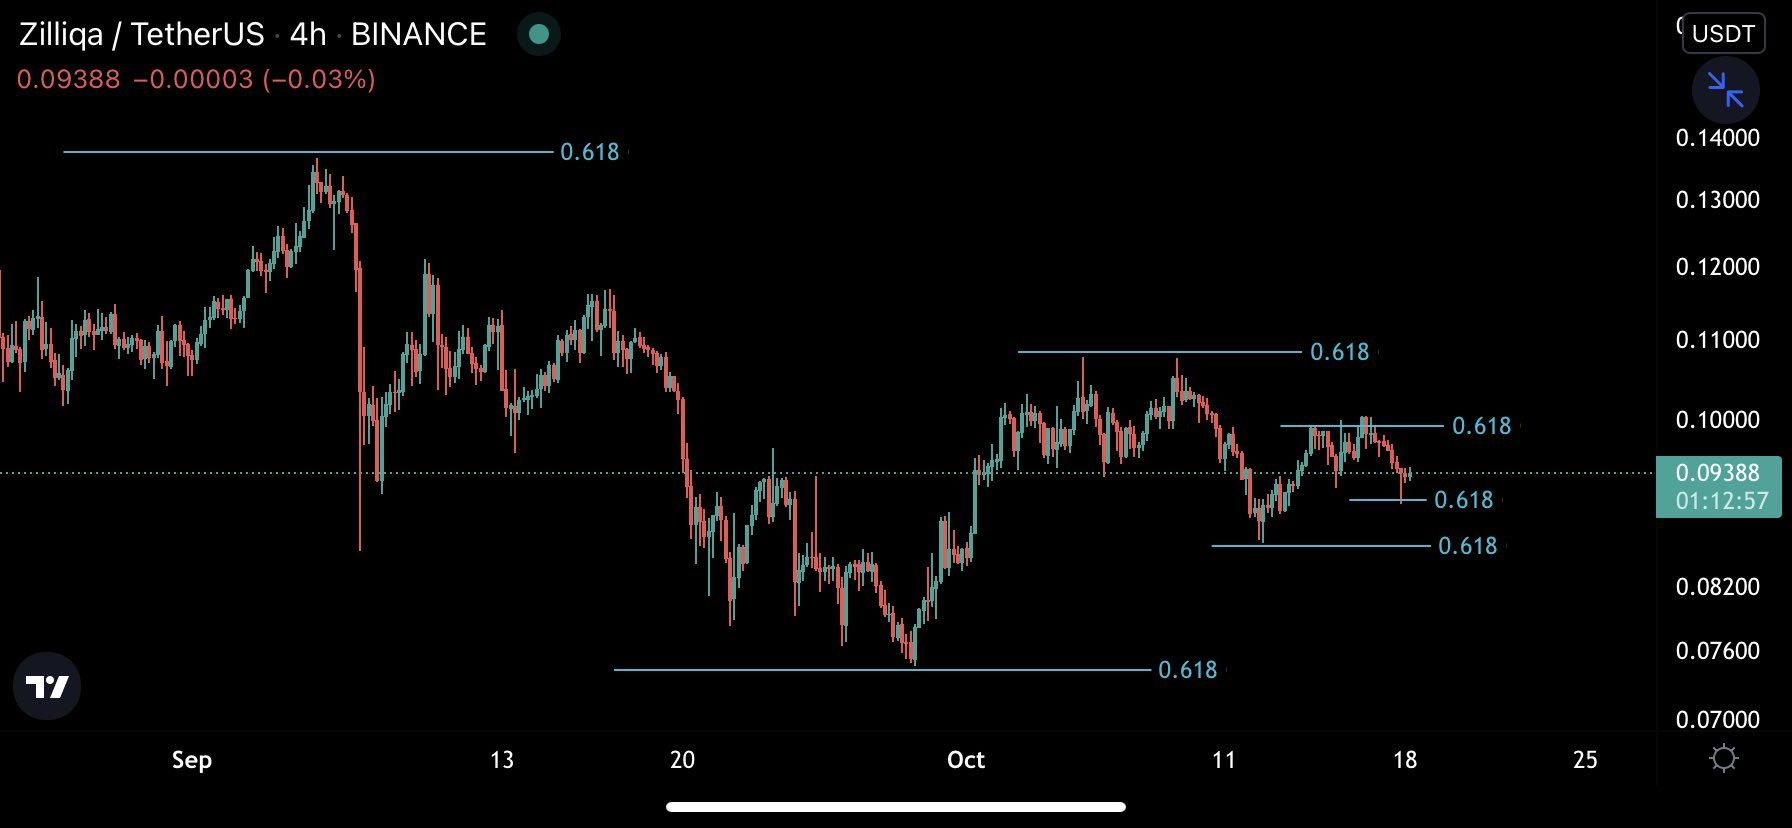
Cryptocurrency trader @Mesawine1 outlined a ZIL chart, stating that the token has bounced at the 0.618 Fib retracement level. Since the tweet, the token has been moving upwards and just broke out from the resistance area outlined above.
Future ZIL movement
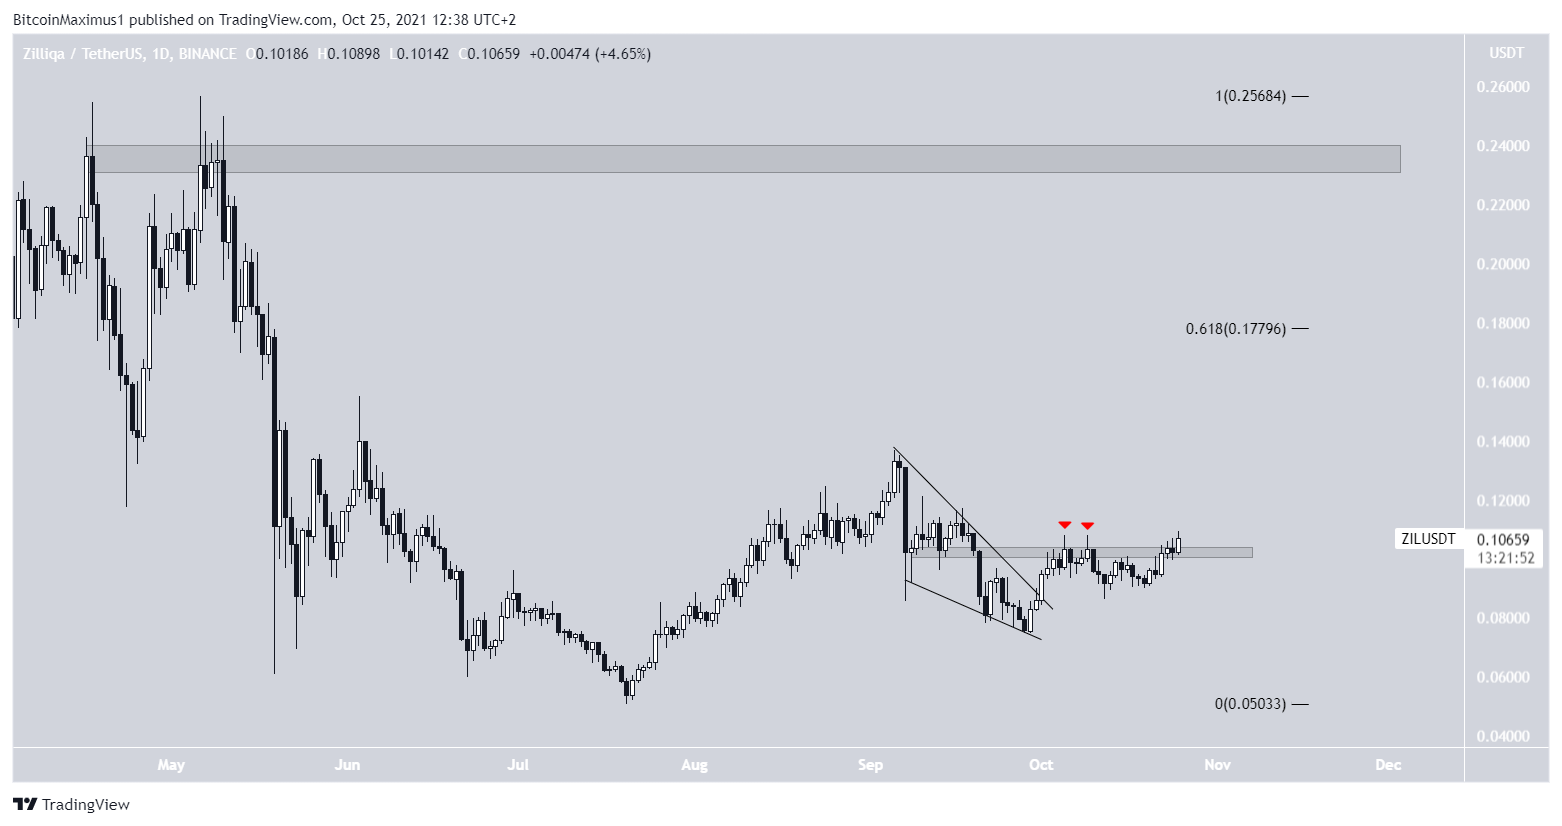
The daily time frame also shows that there is a lack of resistance above the current price.
The first resistance is at $0.178. However, this is only a Fib resistance, corresponding with the 0.618 Fib retracement resistance level. It is not a horizontal resistance area.
The closest horizontal resistance area is at $0.235
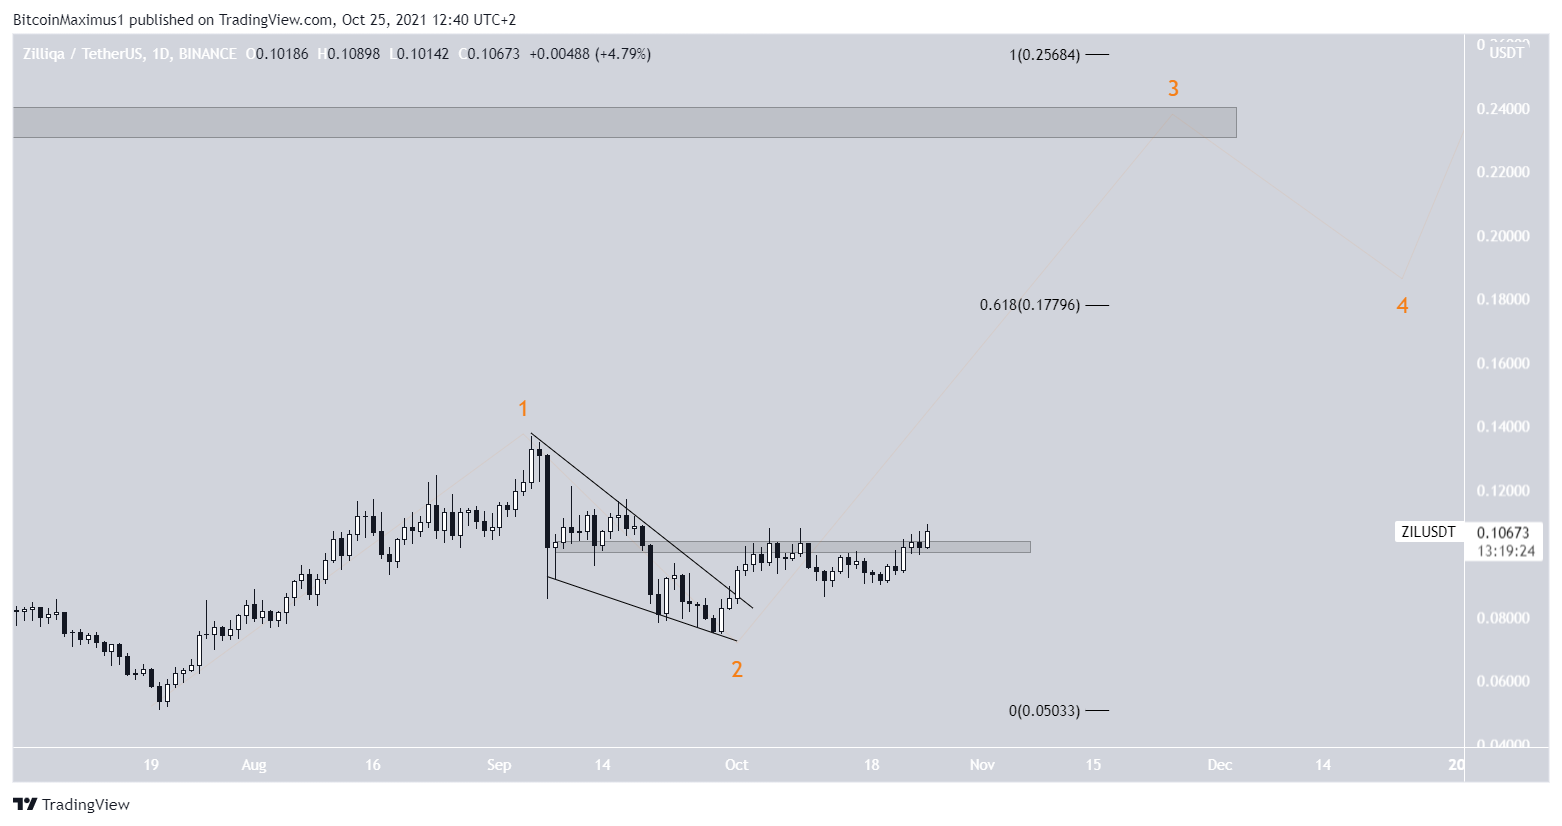
The wave count suggests that ZIL is in wave three of a five-wave bullish impulse (orange). Wave three is usually the sharpest and longest.
Therefore, if correct, the rate of increase would be expected to accelerate soon.
For BeInCrypto’s latest Bitcoin (BTC) analysis, click here.
What do you think about this subject? Write to us and tell us!


