
The Zilliqa (ZIL) price has broken out from a nearly two-month-long resistance line. After a slight retracement, the price is expected to resume its upward movement.
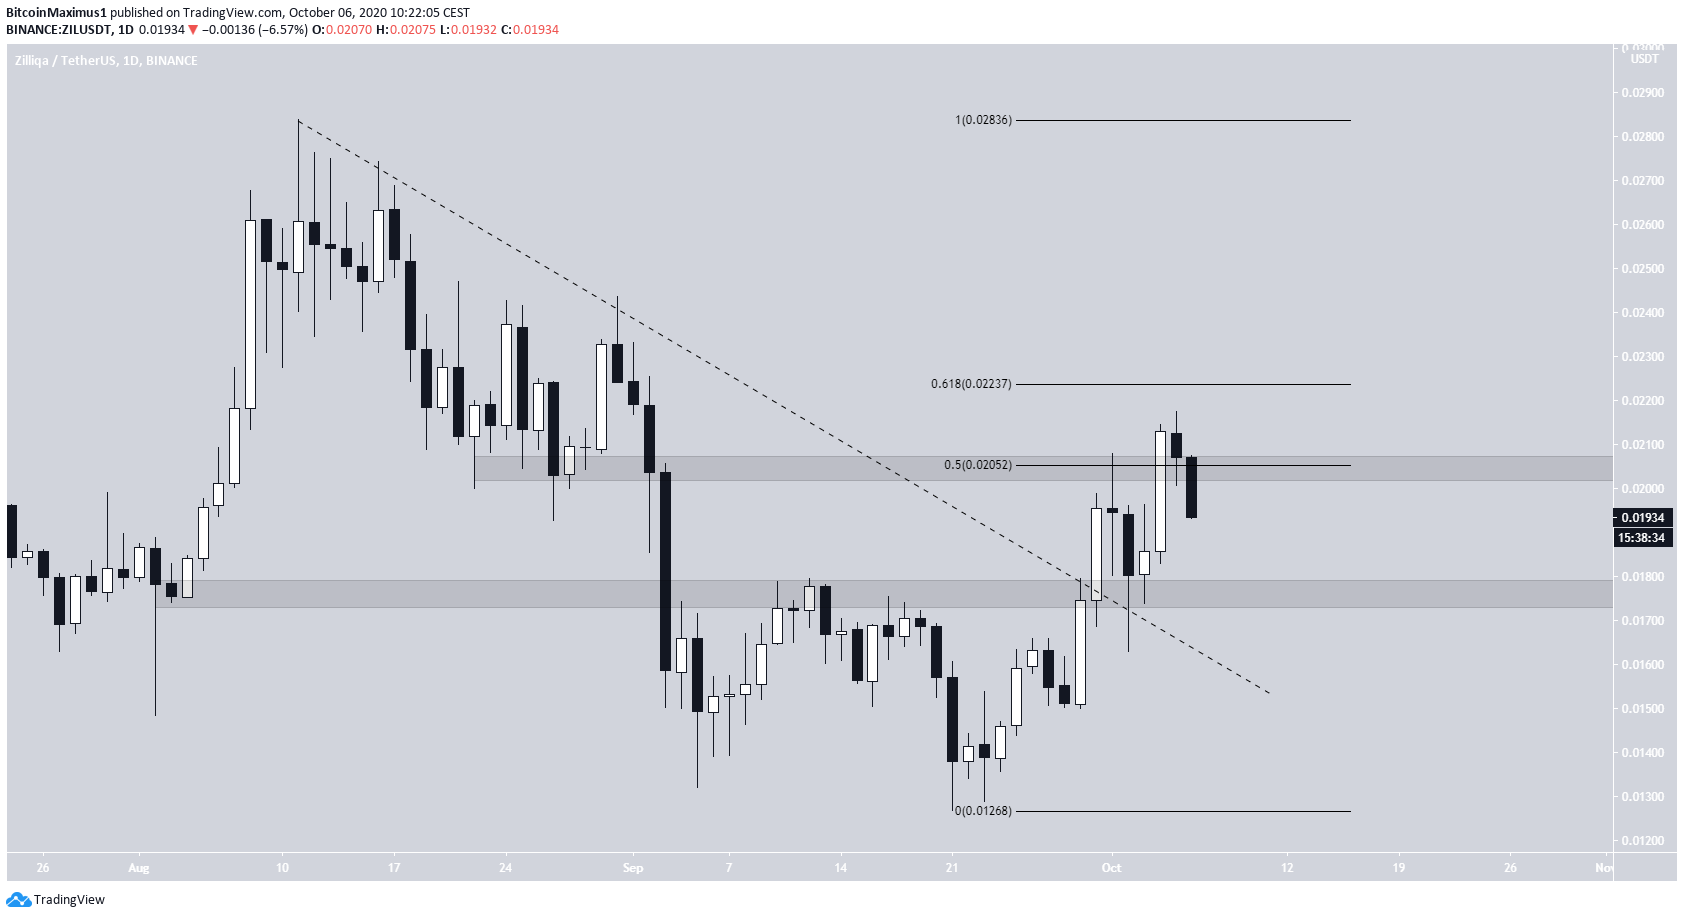
ZIL has been decreasing since Aug 11 when the price closed at a local high of $0.028. Throughout this time, the price has been following a descending resistance line.
ZIL Breakout and Retracement
On Sept 30, the price broke out and proceeded to reach a wick-high of $0.0217 on Oct 5. The high was slightly above the 0.5 Fib level of the entire decrease but fell back below the area shortly after.
Currently, the price is trading between the support and resistance levels of $0.0177-$0.0205.
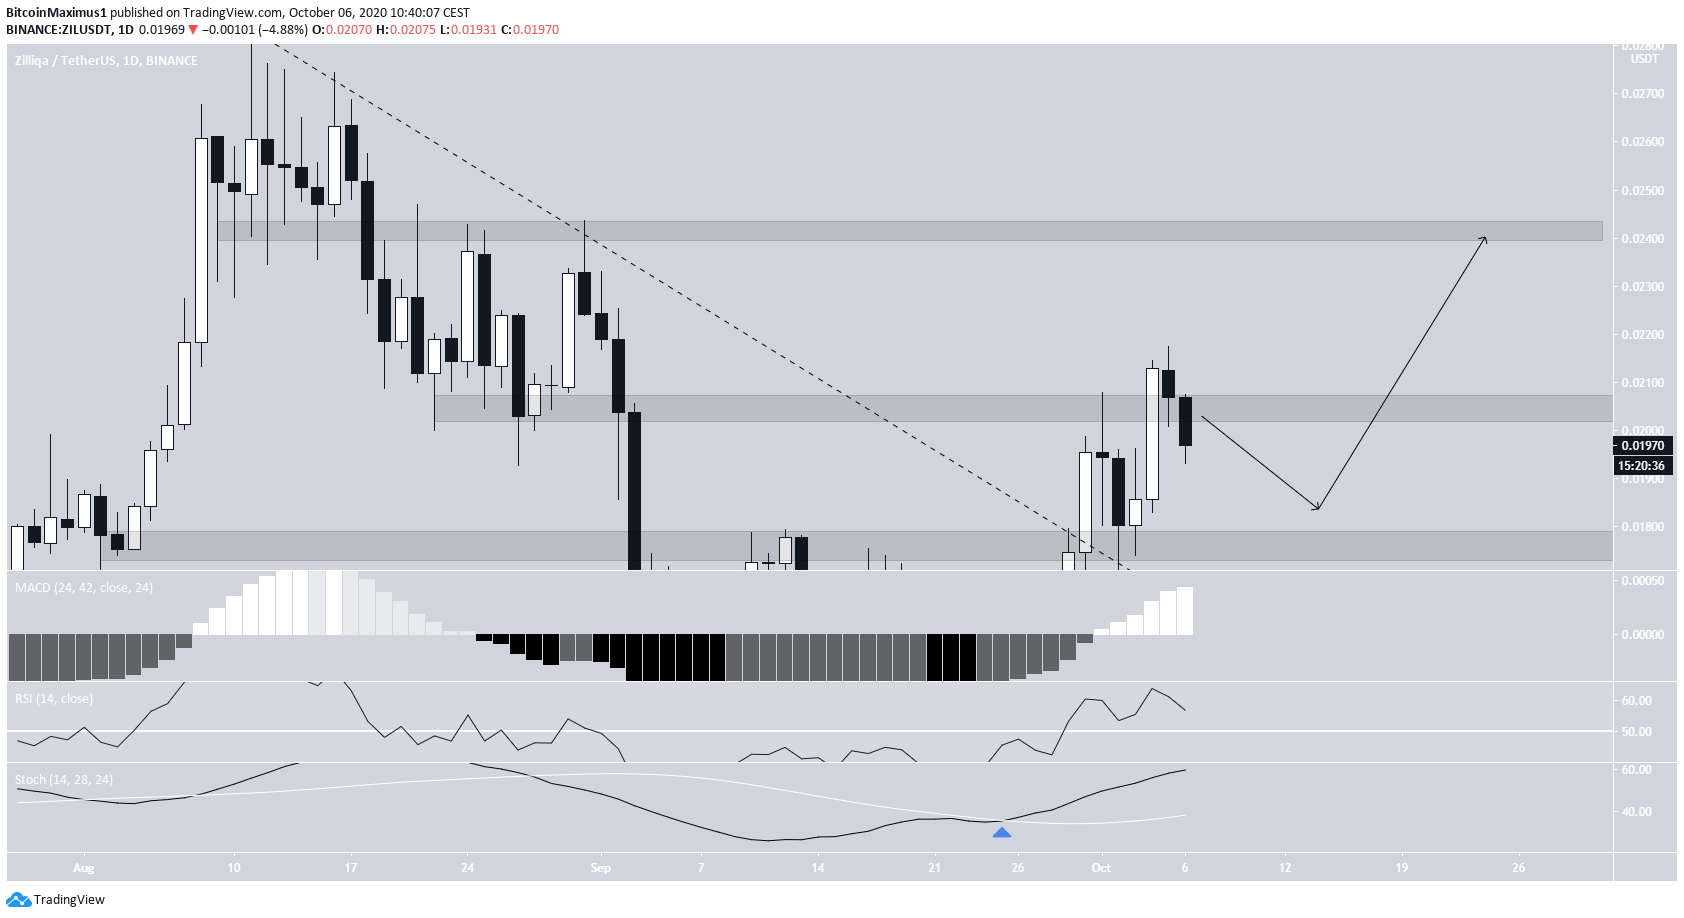
Trading Range
Despite the decrease, technical indicators in the daily time-frame are bullish. The MACD, RSI, and stochastic oscillator are all increasing. Furthermore, there is no bearish divergence in any of these indicators.
If the price continues increasing, the next resistance area will likely be found at $0.024.
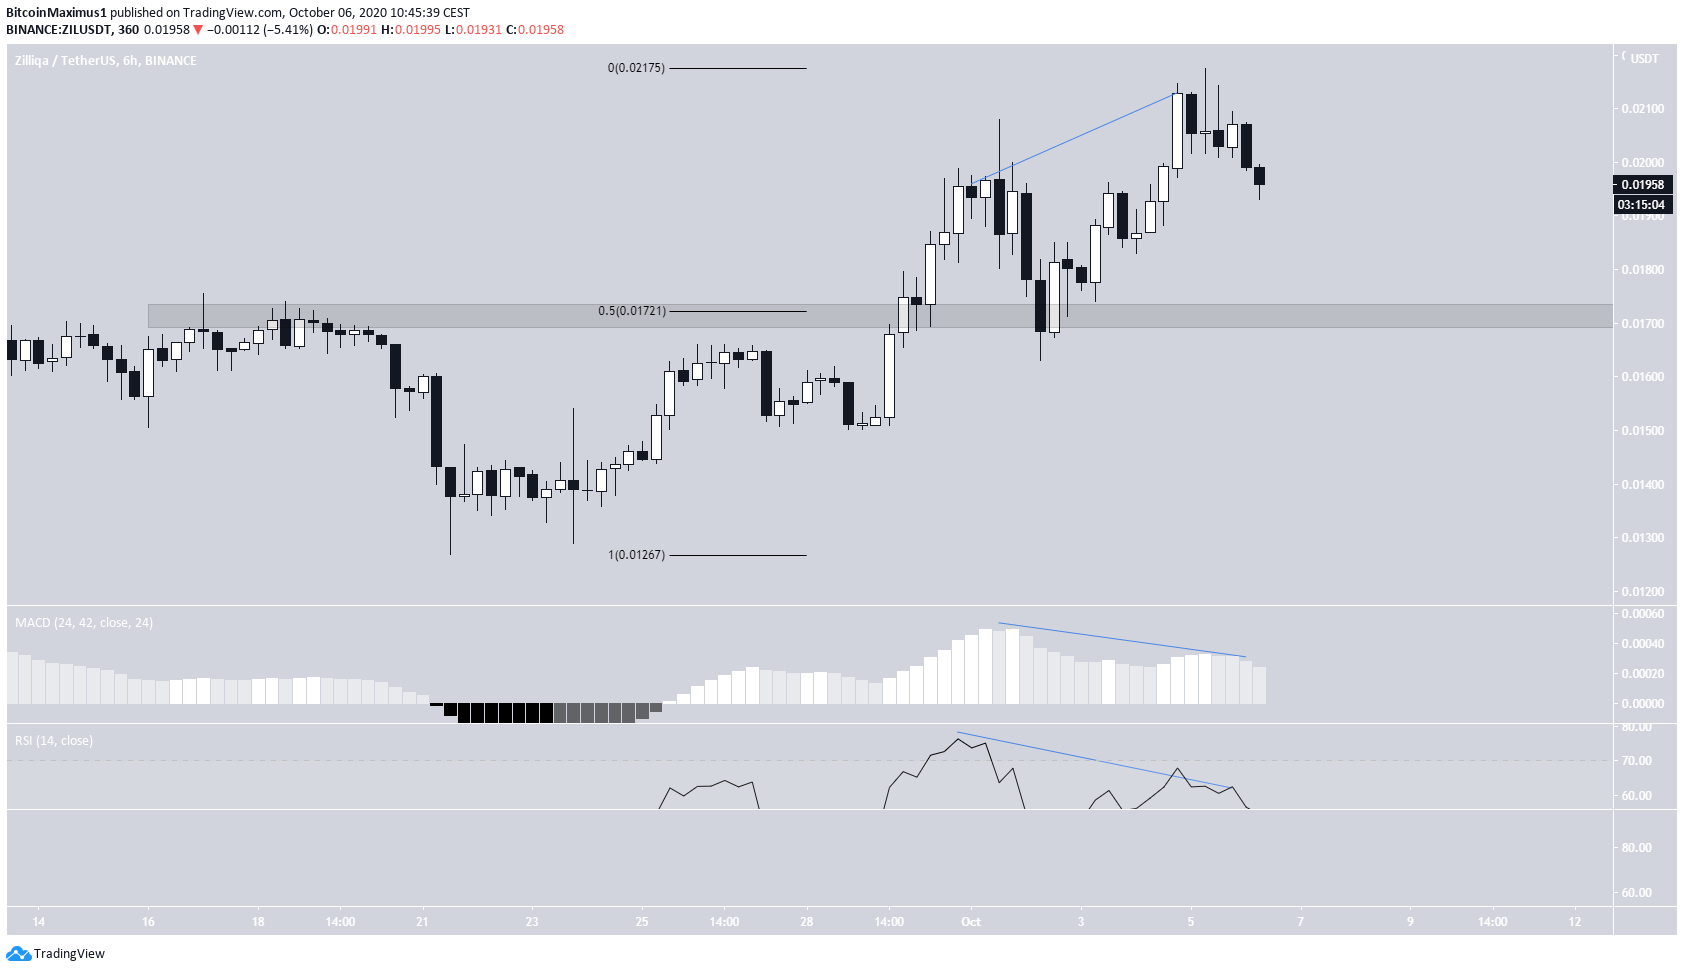
The short-term chart shows considerable weakness in the form of bearish divergence in both the RSI and MACD. This is a sign that the price is likely to decrease.
The 0.5 Fib level of the entire upward move coincides with the previously mentioned support area at $0.017, making it a likely reversal area.
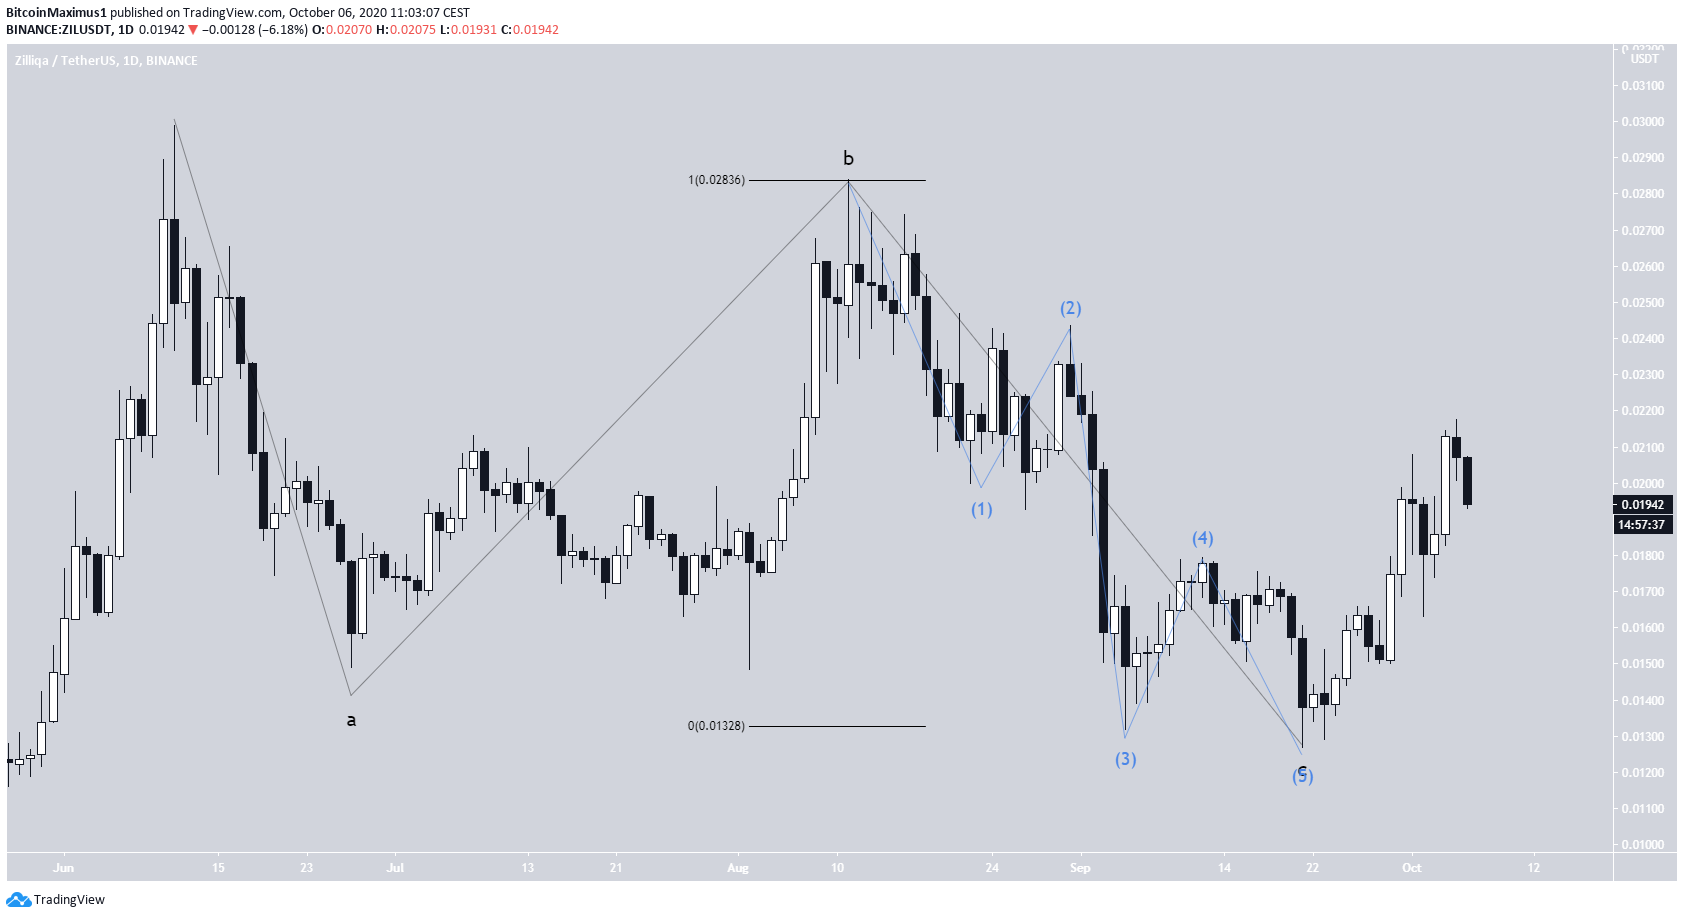
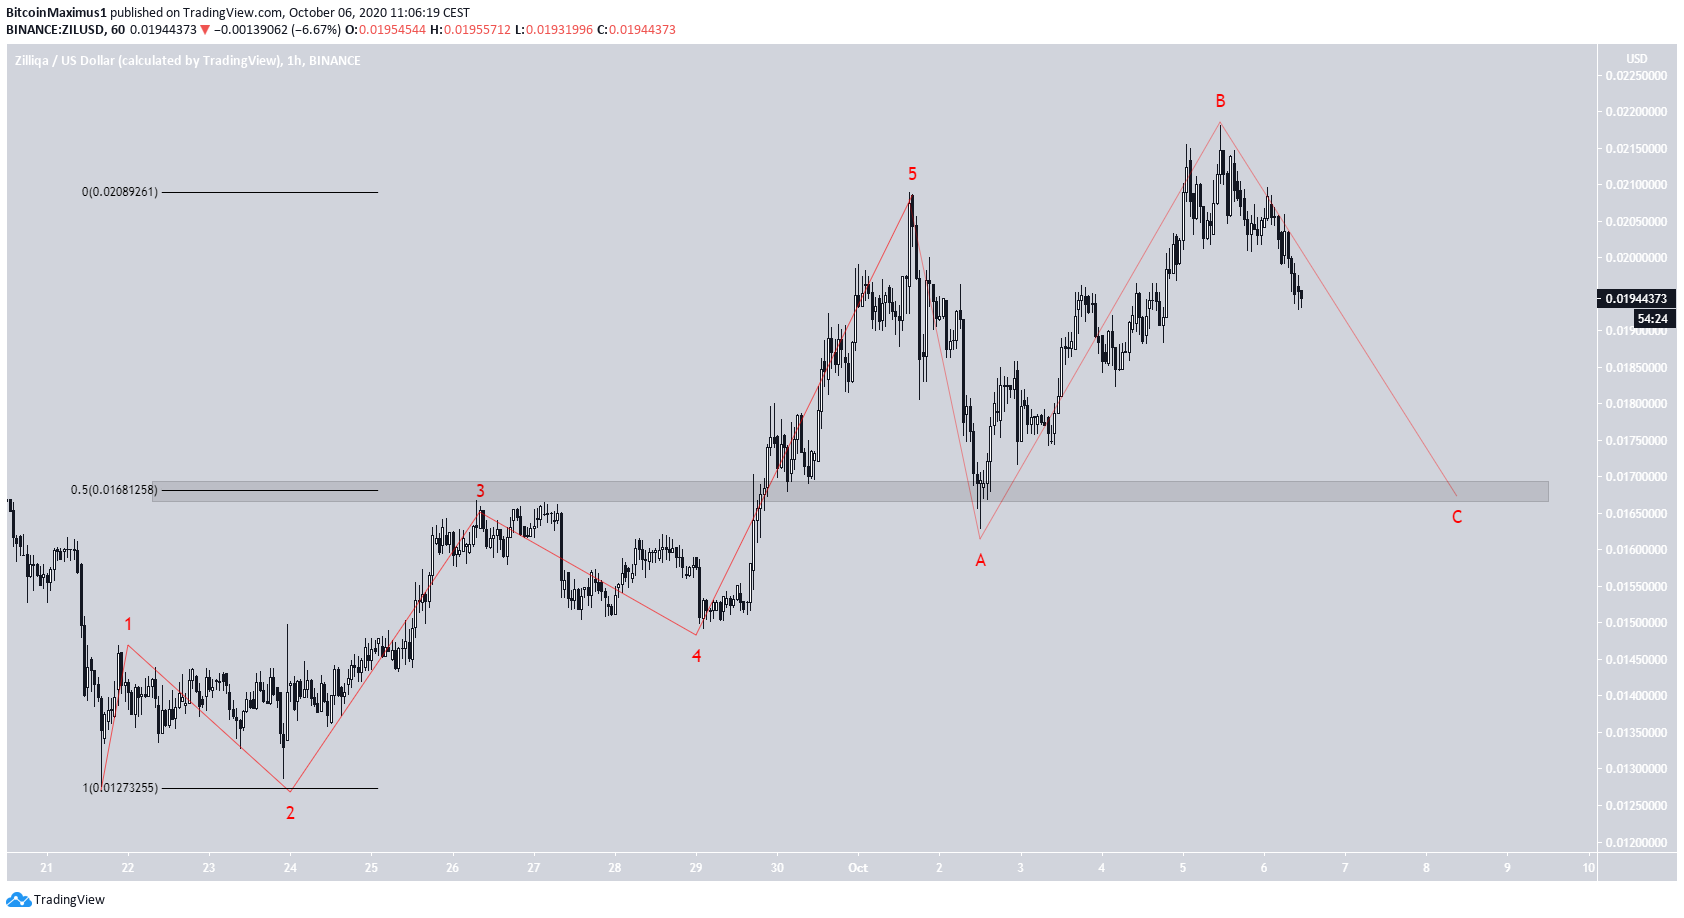
Wave Count
Since reaching a high of $0.029 on June 11, it seems that ZIL has successfully completed an A-B-C corrective pattern (shown in black below), in which the A:C wavelength ratio is very close to 1:1.
The fact that the C wave is comprised of five sub-waves (blue) makes this likely to be the correct count.
If so, the price began an upward move on Sept 21 with a low of $0.0127.
The shorter-term chart shows that the price has completed a bullish impulse (red) and has now only the C wave left to complete before resuming its upward movement.
The 0.5 Fib level is found at $0.0168. A decrease below the previously mentioned low of $0.0127 would invalidate this particular wave count.
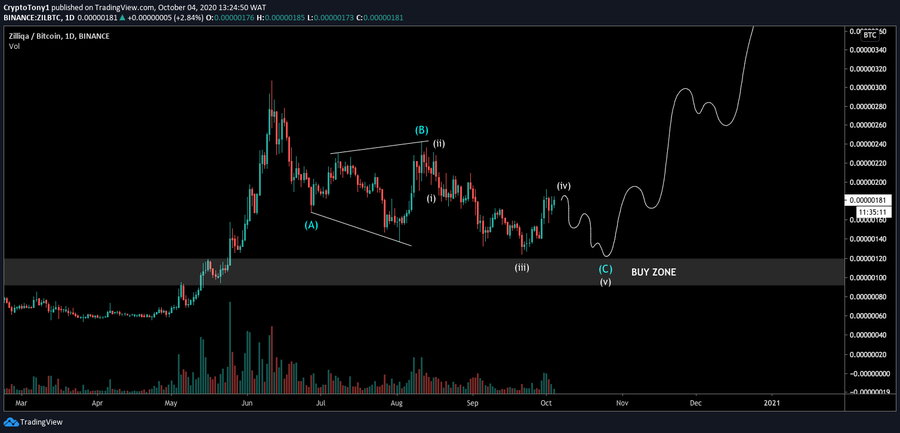
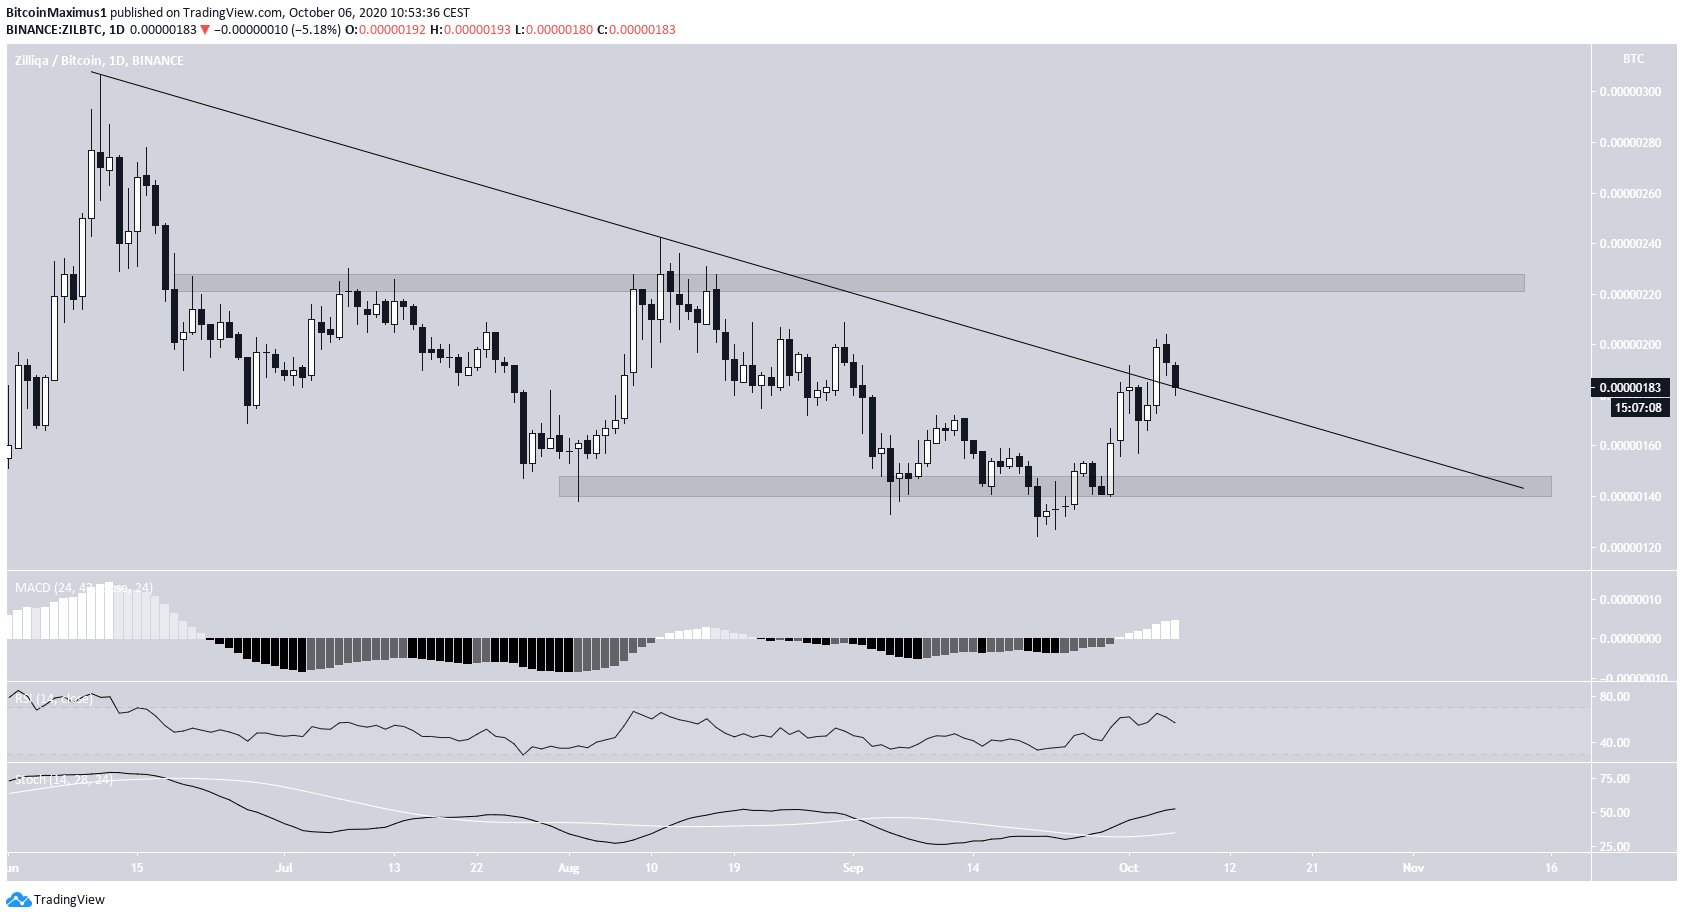
ZIL/BTC
Cryptocurrency trader @CryptoTony_ outlined a ZIL/BTC chart, which forecasts the price increasing above the June highs of 321 satoshis.
Similar to its USD counterpart, ZIL/BTC has also broken out from a descending resistance line (in black below). At the time of press, the price was in the process of validating the resistance as support.
Technical indicators are bullish, indicating that the price is expected to continue moving upwards. If it does, the next closest resistance area is found at 225 satoshis, while the closest support is at 142 satoshis.
For BeInCrypto’s latest Bitcoin analysis, click here!
Disclaimer: Cryptocurrency trading carries a high level of risk and may not be suitable for all investors. The views expressed in this article do not reflect those of BeInCrypto.
