


On Apr 3, 2019 the price of Zcash (ZEC) reached a high of $78. A sharp decrease ensued. It reached similar levels on Apr 8. It has been decreasing since.
We talked about ZEC in our most recent video. Check it out below:
Zcash (ZEC): Trends and Highlights for Apr 15, 2019
- The price of Zcash has been on a gradual uptrend since Mar 26.
- It is trading inside a symmetrical triangle.
- There is bearish divergence developing in the RSI.
- The price is facing resistance from the 100-day moving average.
- There is support near $64.
Symmetrical Triangle
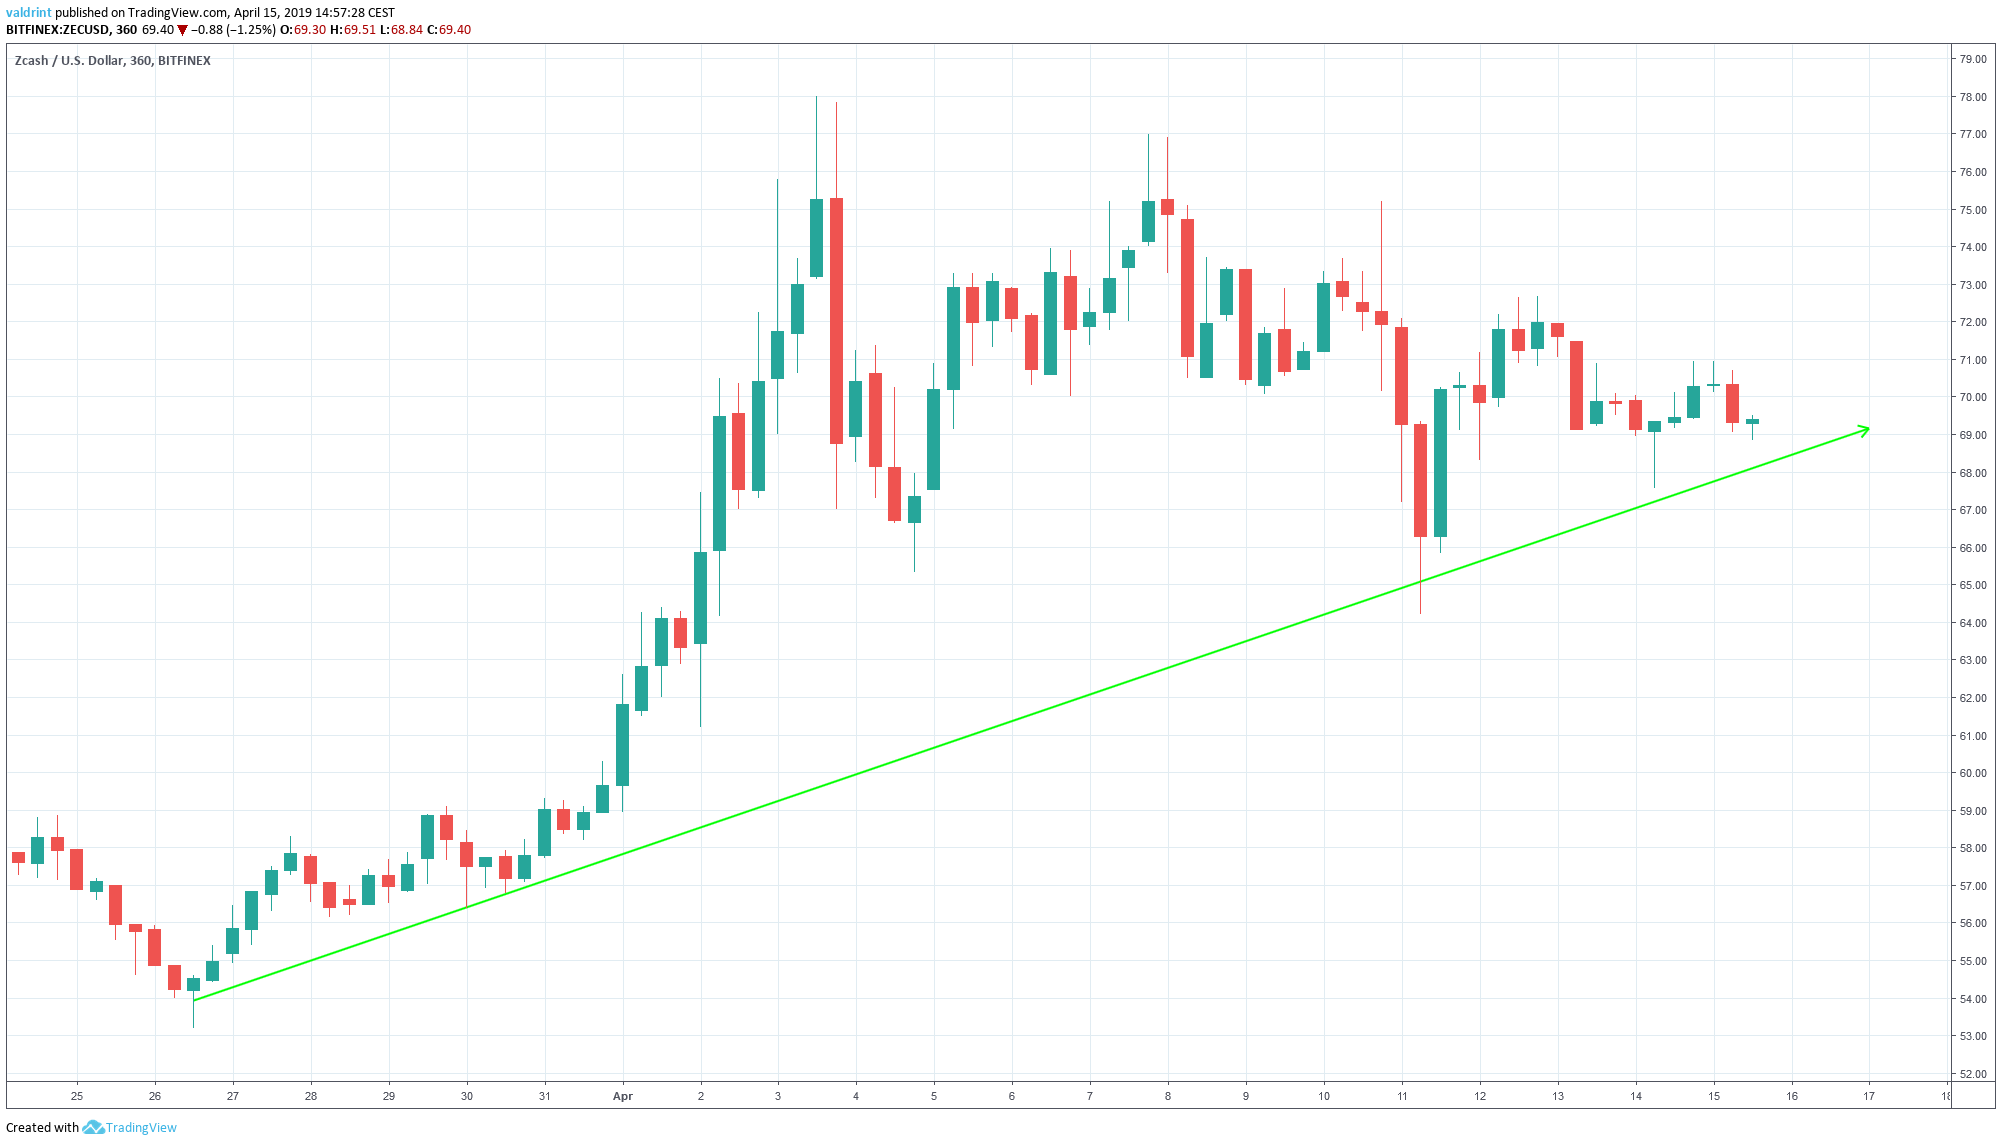
The price made a low of $53.60 on Mar 26. A gradual upward move followed. Several market cycles have been completed since and after each one the lows have been higher than the preceding ones.
Tracing these lows gives us an ascending support line:
On Apr 3, the price reached a high of $78. A sharp drop was followed by a gradual increase. The price has made successively lower highs.
Tracing these highs gives us a descending resistance line:
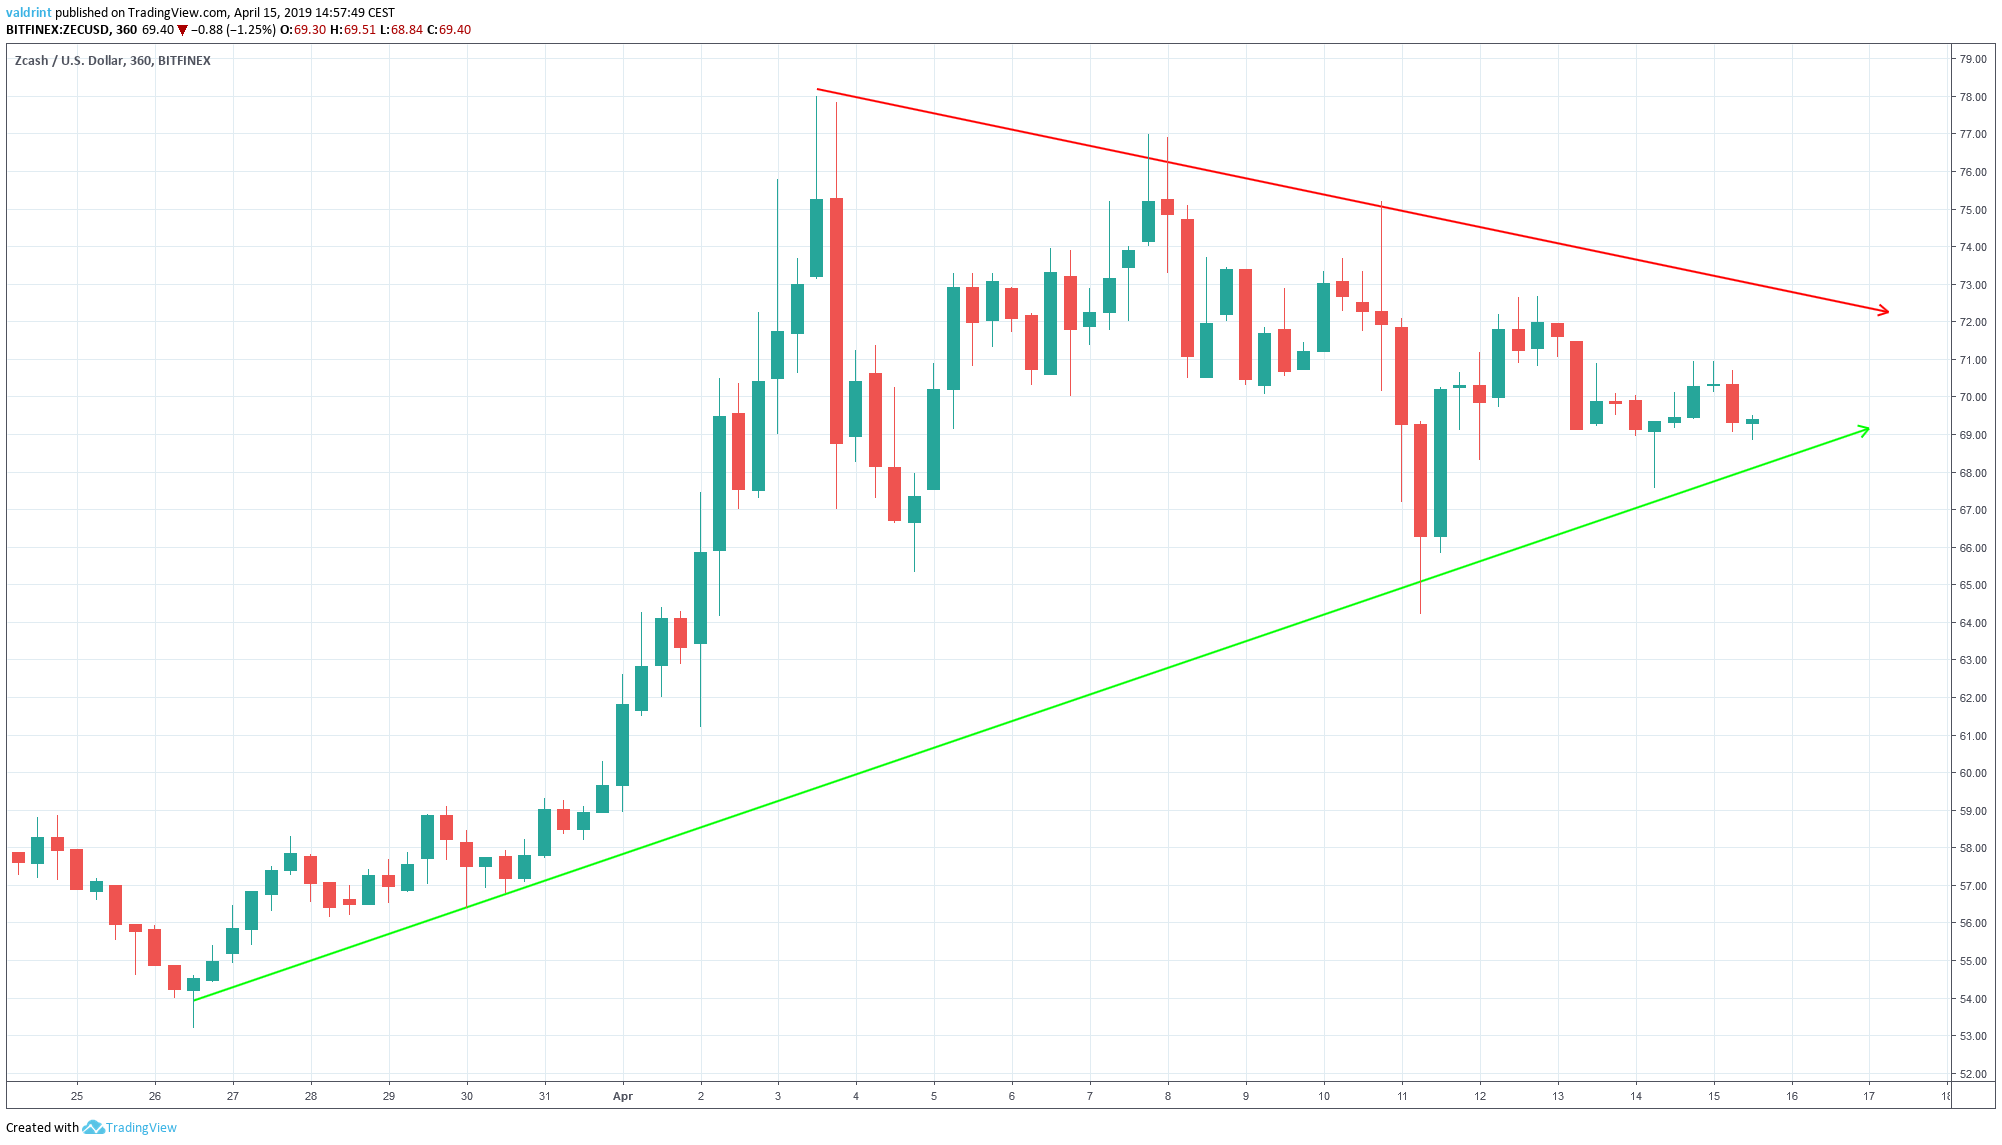
The resistance and support lines combine to create a symmetrical triangle, which is a neutral pattern.
It is likely that the price will keep trading within the confines of this triangle until a decisive move occurs.
In order to figure out the direction of the move, we need to take a look at some technical indicators.
Technical Indicators
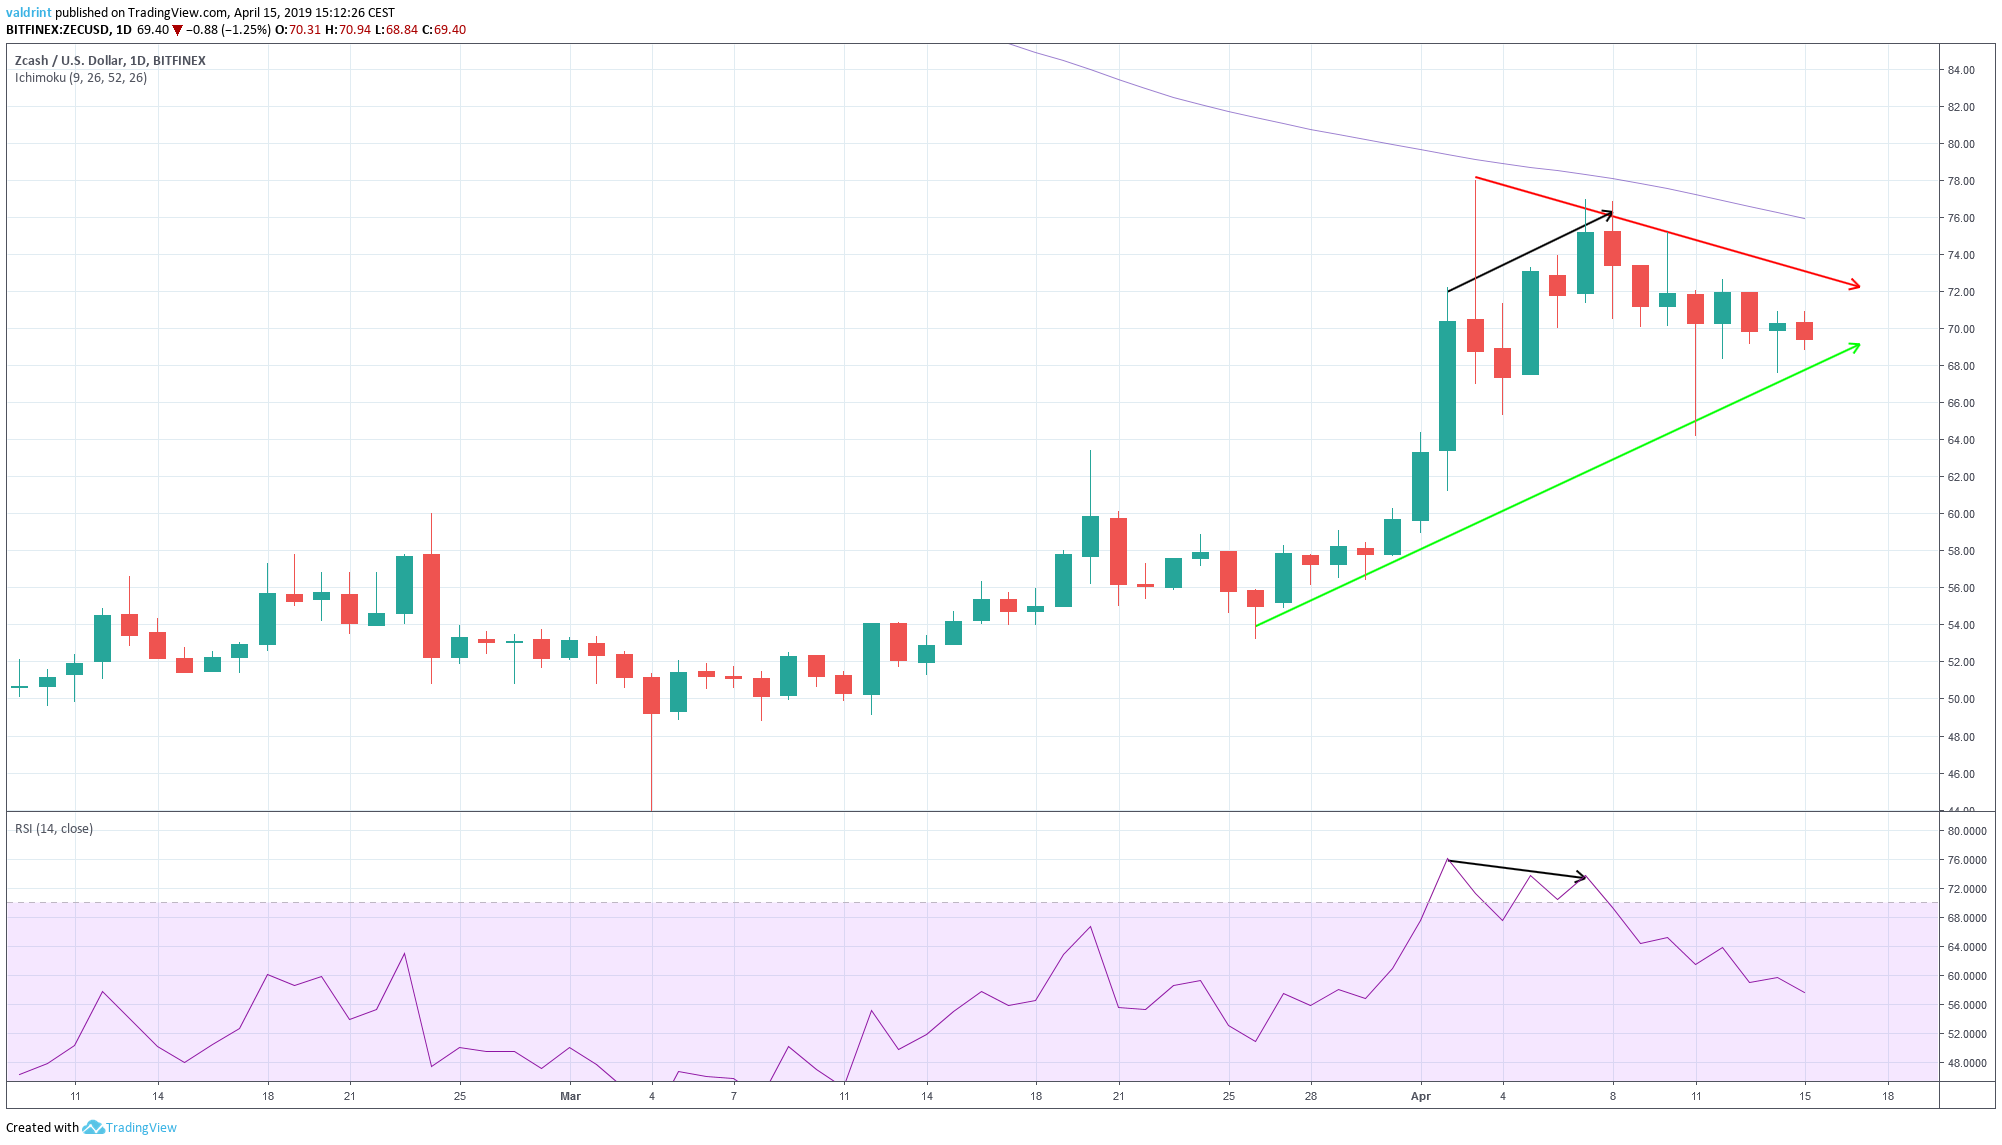
On Apr 2, the price reached a high of $72.24. It reached another high of $76.99 on Apr 7.
Similarly, the RSI reached a high on Apr 2. However, it has generated lower values since.
This is known as bearish divergence and often precedes price decreases.
Furthermore, the price is trading below the 200-day moving average. Hitherto, Zcash has made two unsuccessful attempts at breaking out above it.
The moving average is providing close resistance to the price. Because a breakout is unlikely, price is unlikely to increase. On the contrary, we believe a breakdown from the triangle is likely.
The price might land in the support areas outlined in the next section.
Support Areas
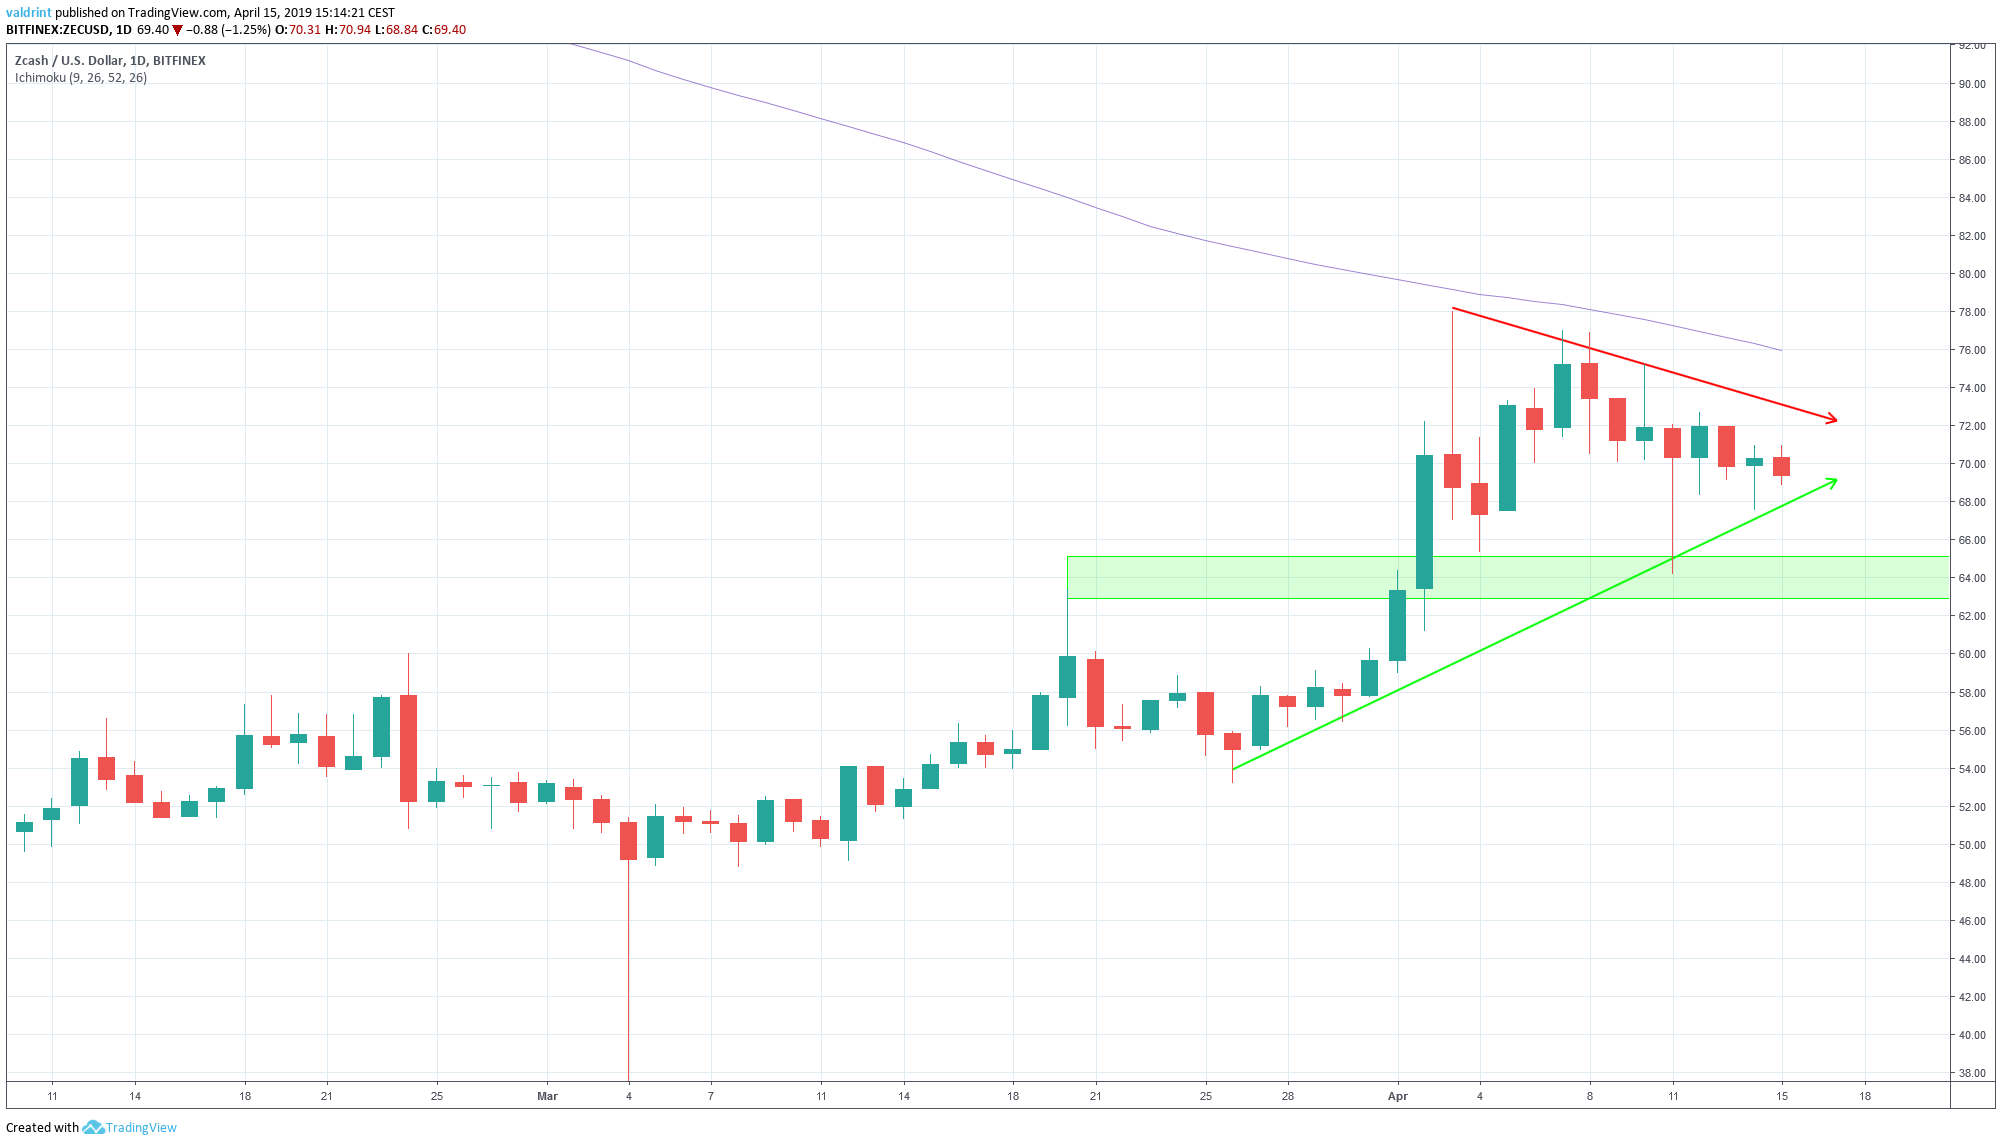
The closest support area is found near $64. If the price breaks down from the triangle, it is likely to provide a reversal.
Summary of Analysis
Based on this analysis, the price will likely trade inside the confines of the symmetrical triangle and eventually break down. Prices below $65 appear possible
Do you think the price of ZEC will break down from the triangle? Let us know in the comments below.
If you’d like to learn more about Bitcoin, however, click on the green button below:
Disclaimer: This article is not trading advice and should not be construed as such. Always consult a trained financial professional before investing in cryptocurrencies, as the market is particularly volatile.


