
Privacy token ZEC has emerged as one of today’s strongest performers, surging 16% in the past 24 hours to hit a nine-month high at press time.
The rally comes as the broader crypto market rebounds following a subdued weekend. ZEC could extend its gains with traders rotating back into altcoins showing fresh momentum.
ZEC Rally Gains Strength
Technical indicators suggest ZEC’s rally may have further room to run. For example, the current setup of its Moving Average Convergence Divergence (MACD) indicator signals that market participants favor accumulation over distribution.
At press time, the MACD line (blue) rests above the signal line (orange), indicating strong bull dominance.
For token TA and market updates: Want more token insights like this? Sign up for Editor Harsh Notariya’s Daily Crypto Newsletter here.
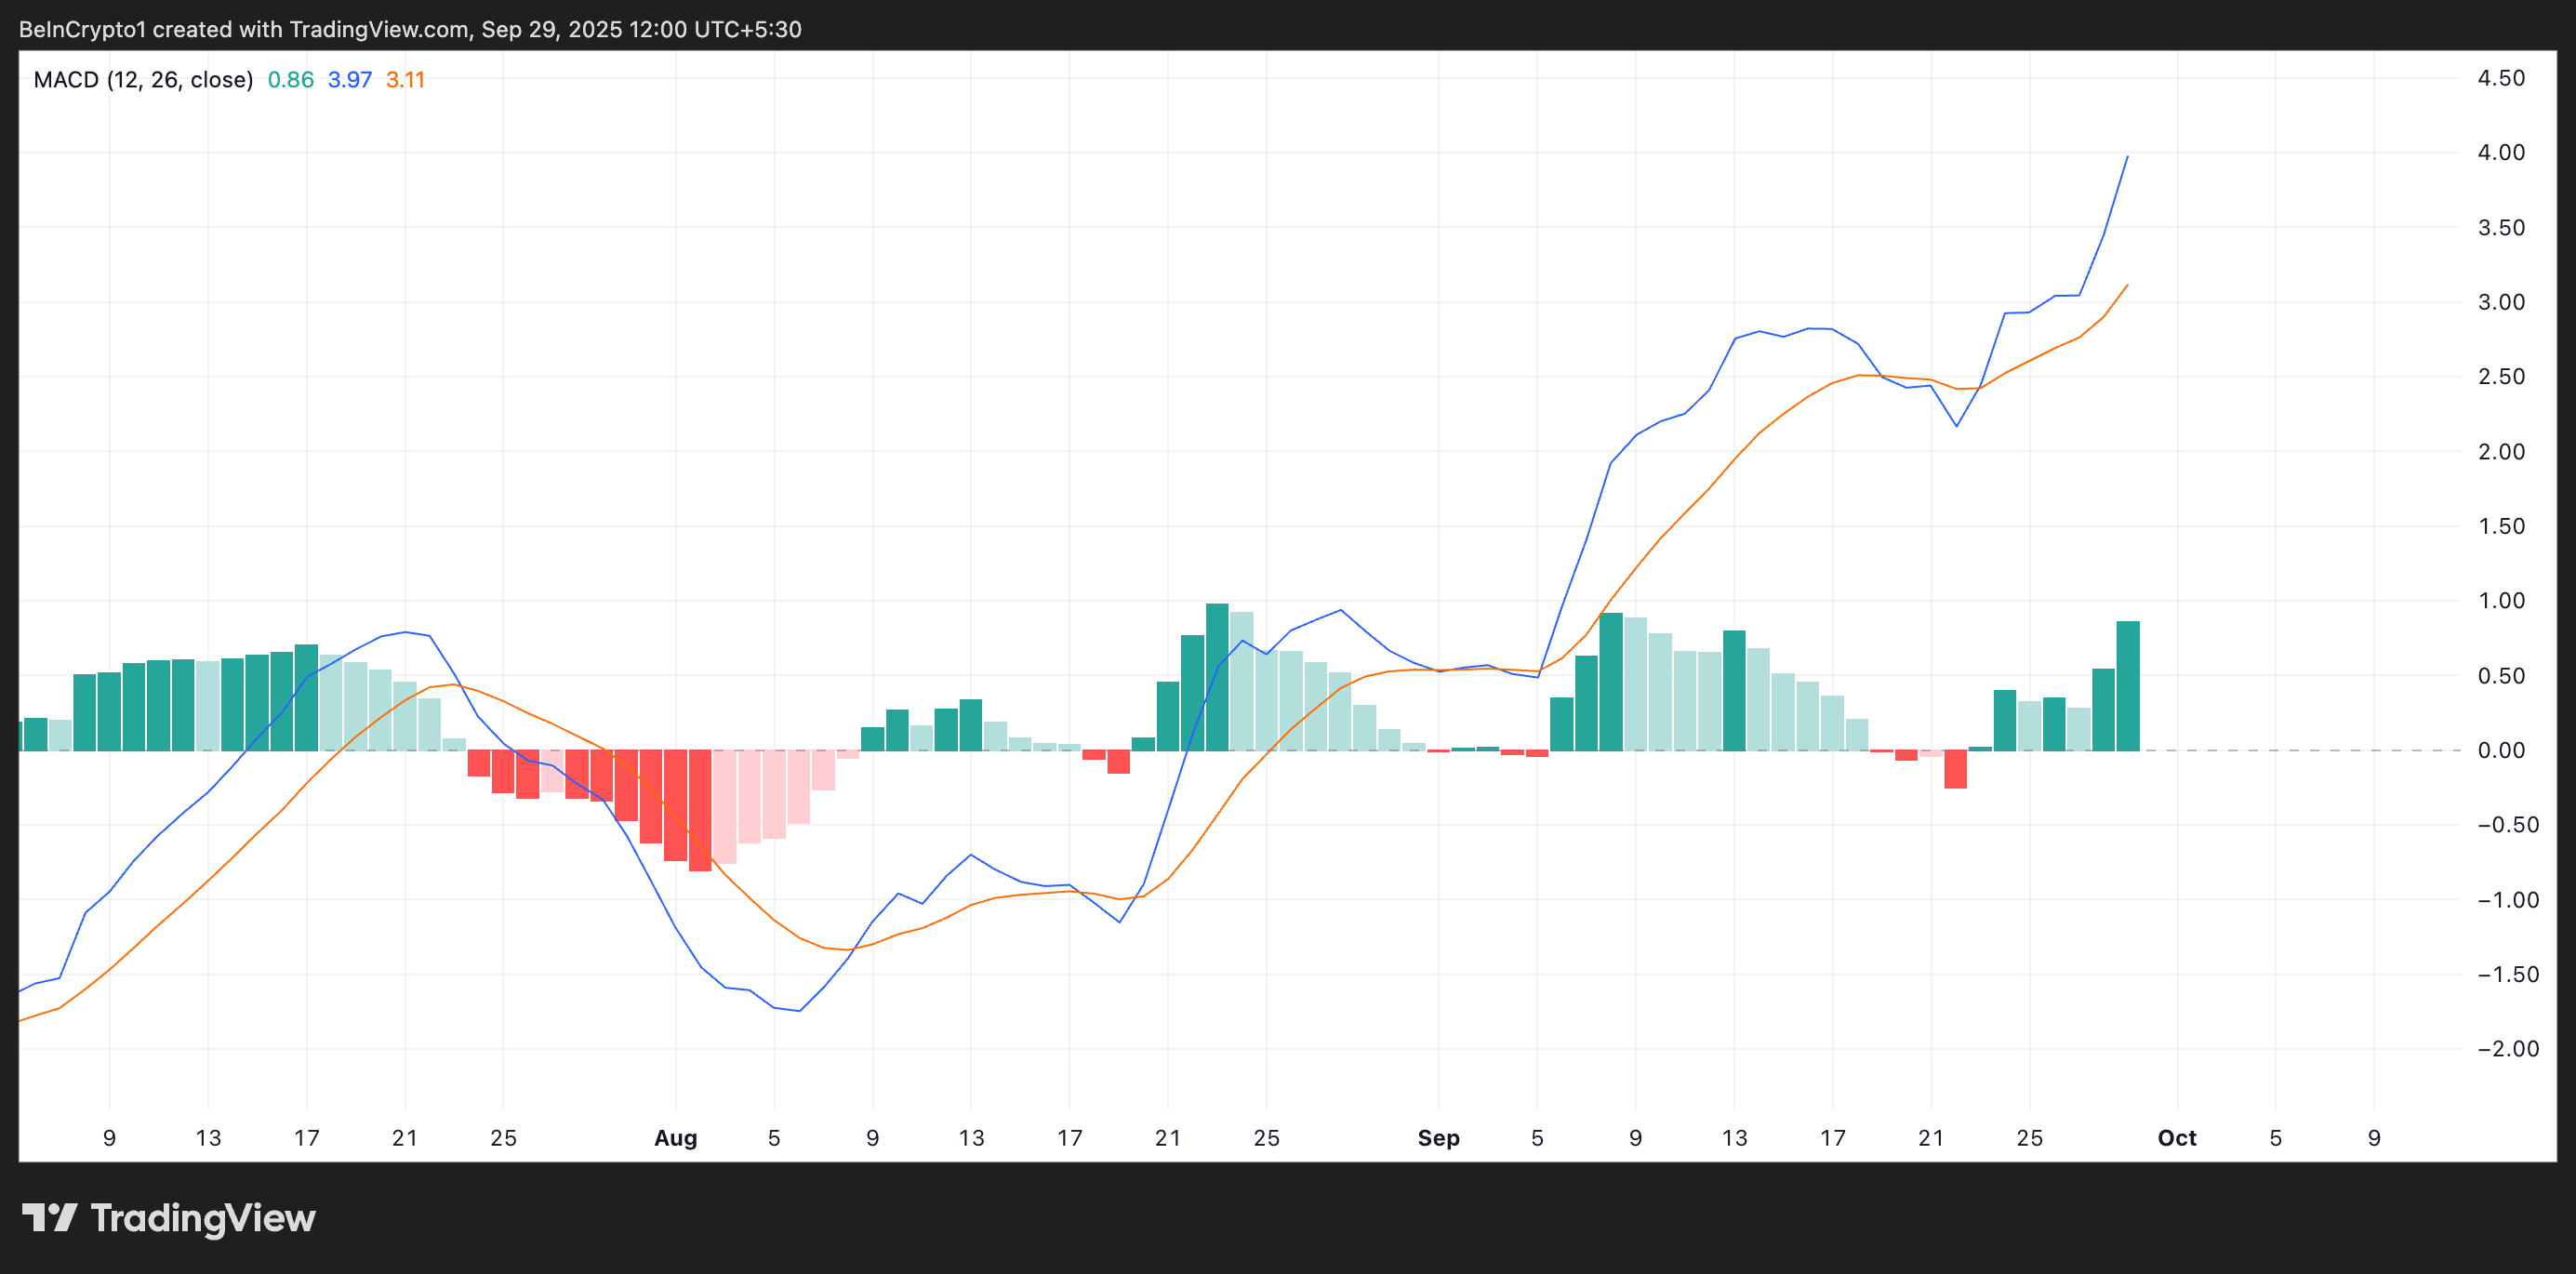
The MACD indicator identifies an asset’s price trends and momentum. It helps traders spot potential buy or sell signals through crossovers between the MACD and signal lines.
When the MACD line crosses above the signal line, it suggests that buying momentum is strengthening and that bulls are in control. Conversely, a cross below the signal line is viewed as a bearish shift, pointing to potential downside pressure.
For ZEC, its MACD setup reflects the conviction behind its latest rally and supports the view that further gains could be in play if bullish sentiment remains.
In addition, ZEC’s Aroon Up Line has hit 100%, a level that signals a strong and dominant uptrend.
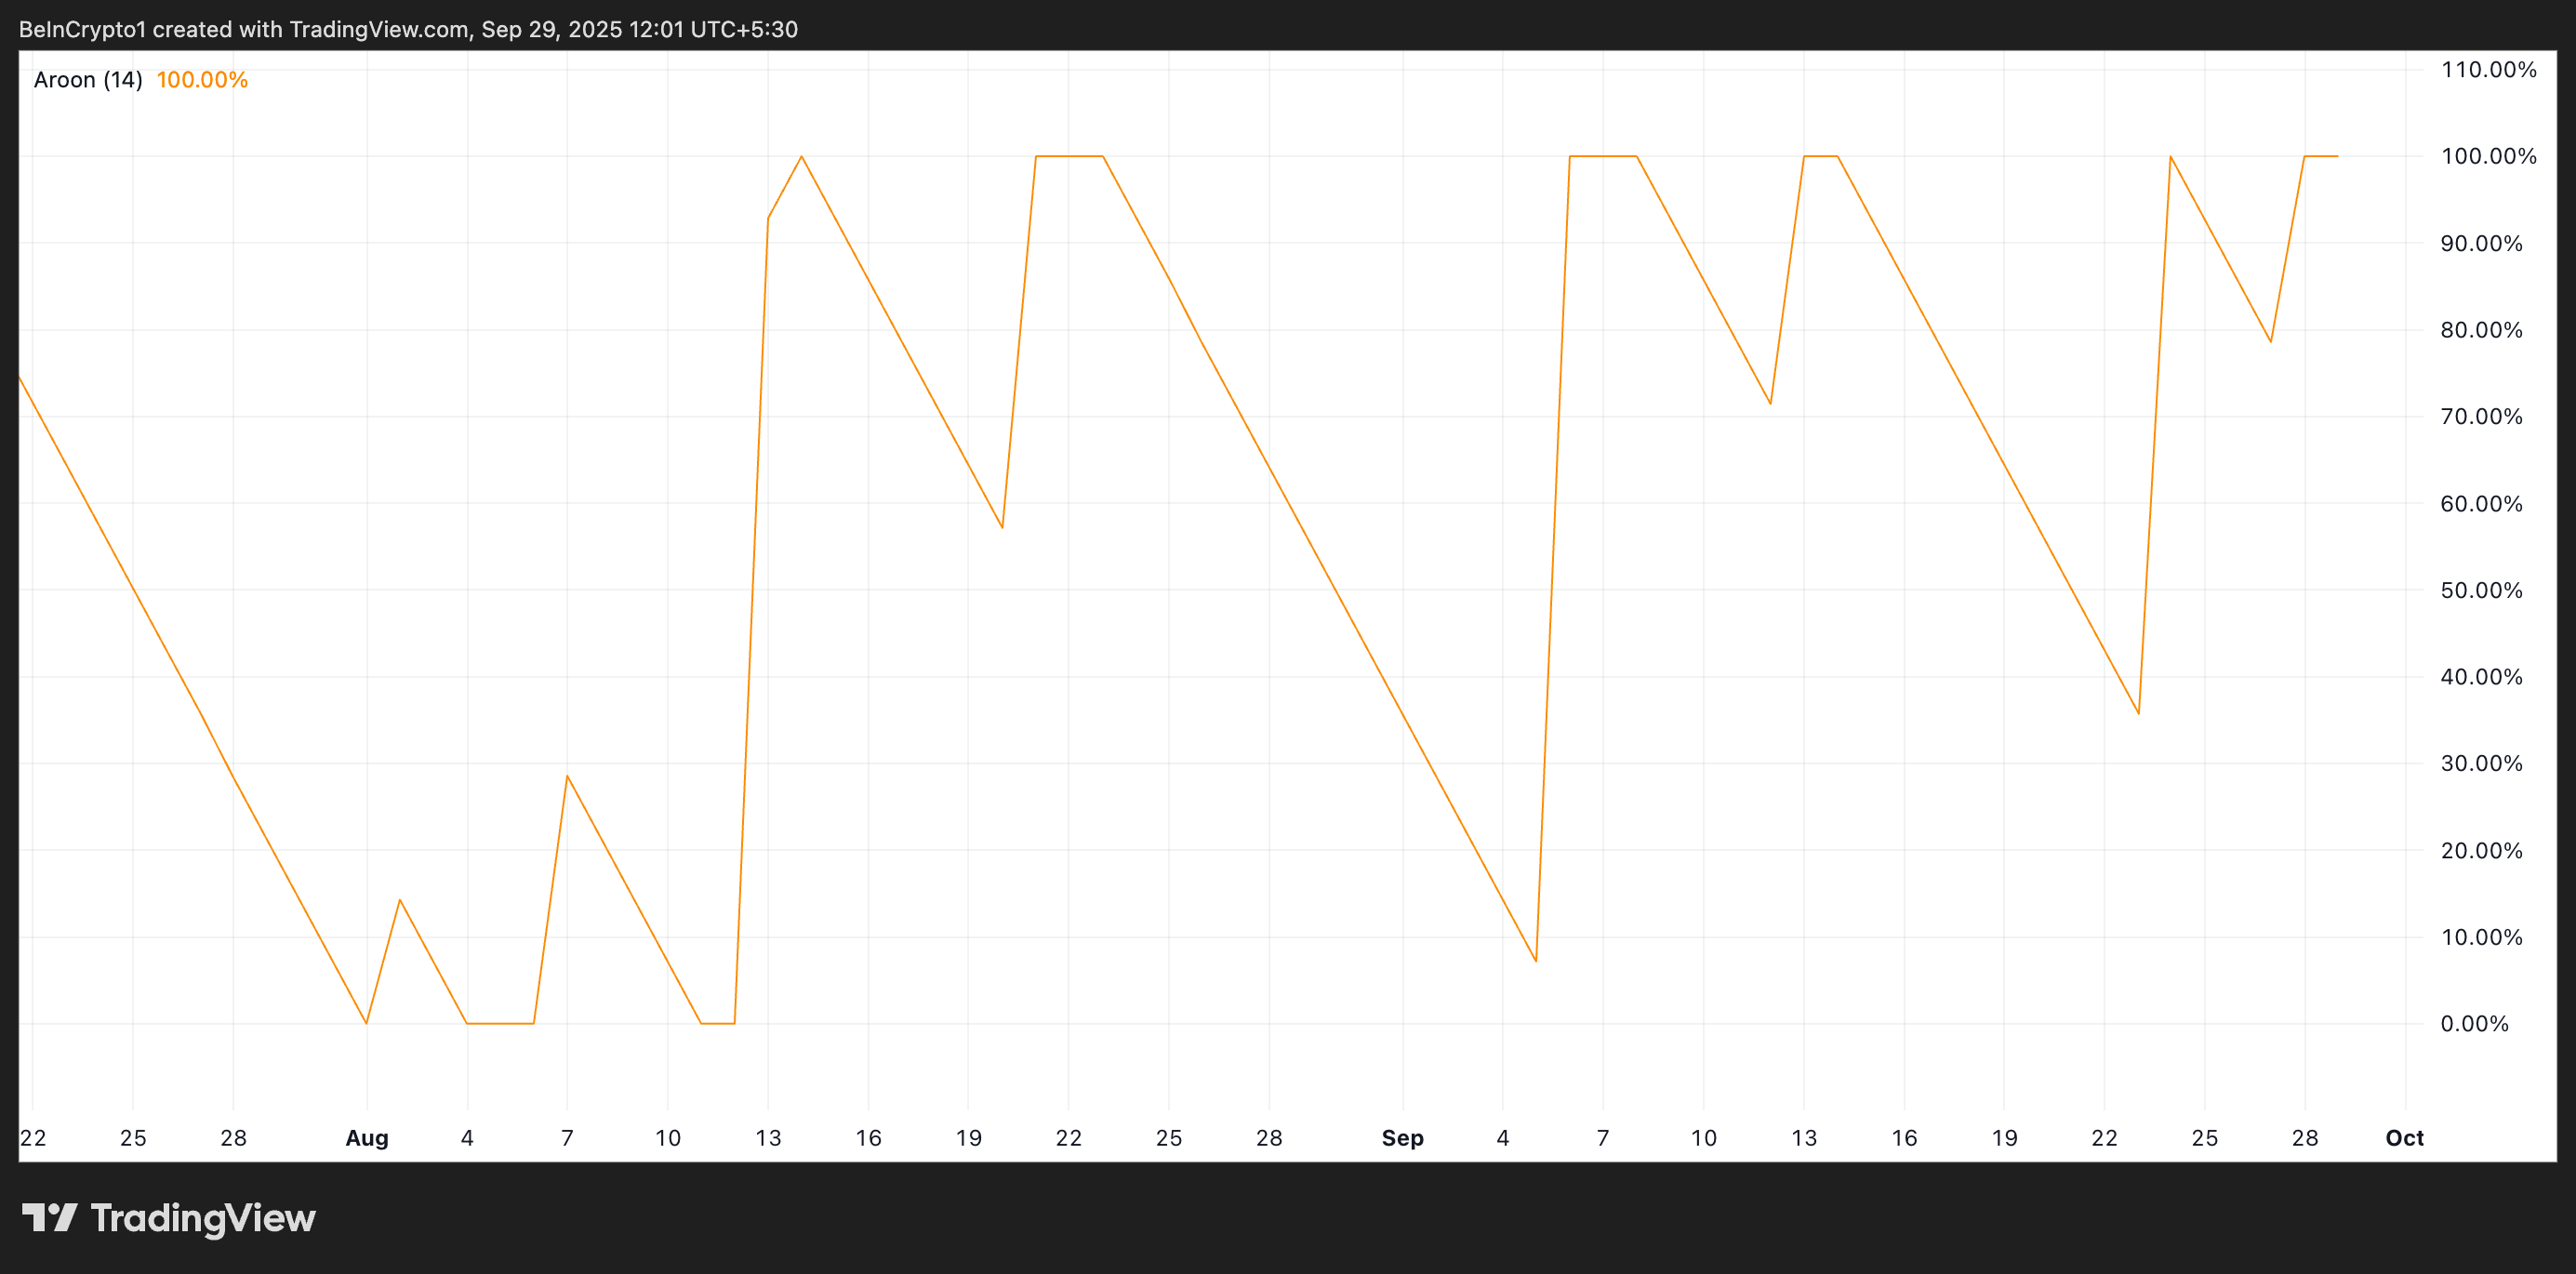
The Aroon indicator measures the strength and direction of a trend by analyzing the time since an asset’s recent highs (Aroon Up) and lows (Aroon Down). When an asset’s Aroon Up Line is climbing, it signals that its price is consistently setting new highs, strengthening bullish momentum, and confirming the likelihood of a sustained uptrend.
This is true of ZEC, which trades at a high last observed in December 2024, and receives solid bullish backing, which could drive further gains.
Zcash Trades Near Breakout Zone
At press time, the altcoin trades at $63.92, pegged below the resistance at $68.04. If buying pressure holds, ZEC could breach this barrier, flip it into a support floor, and climb toward $79.33.
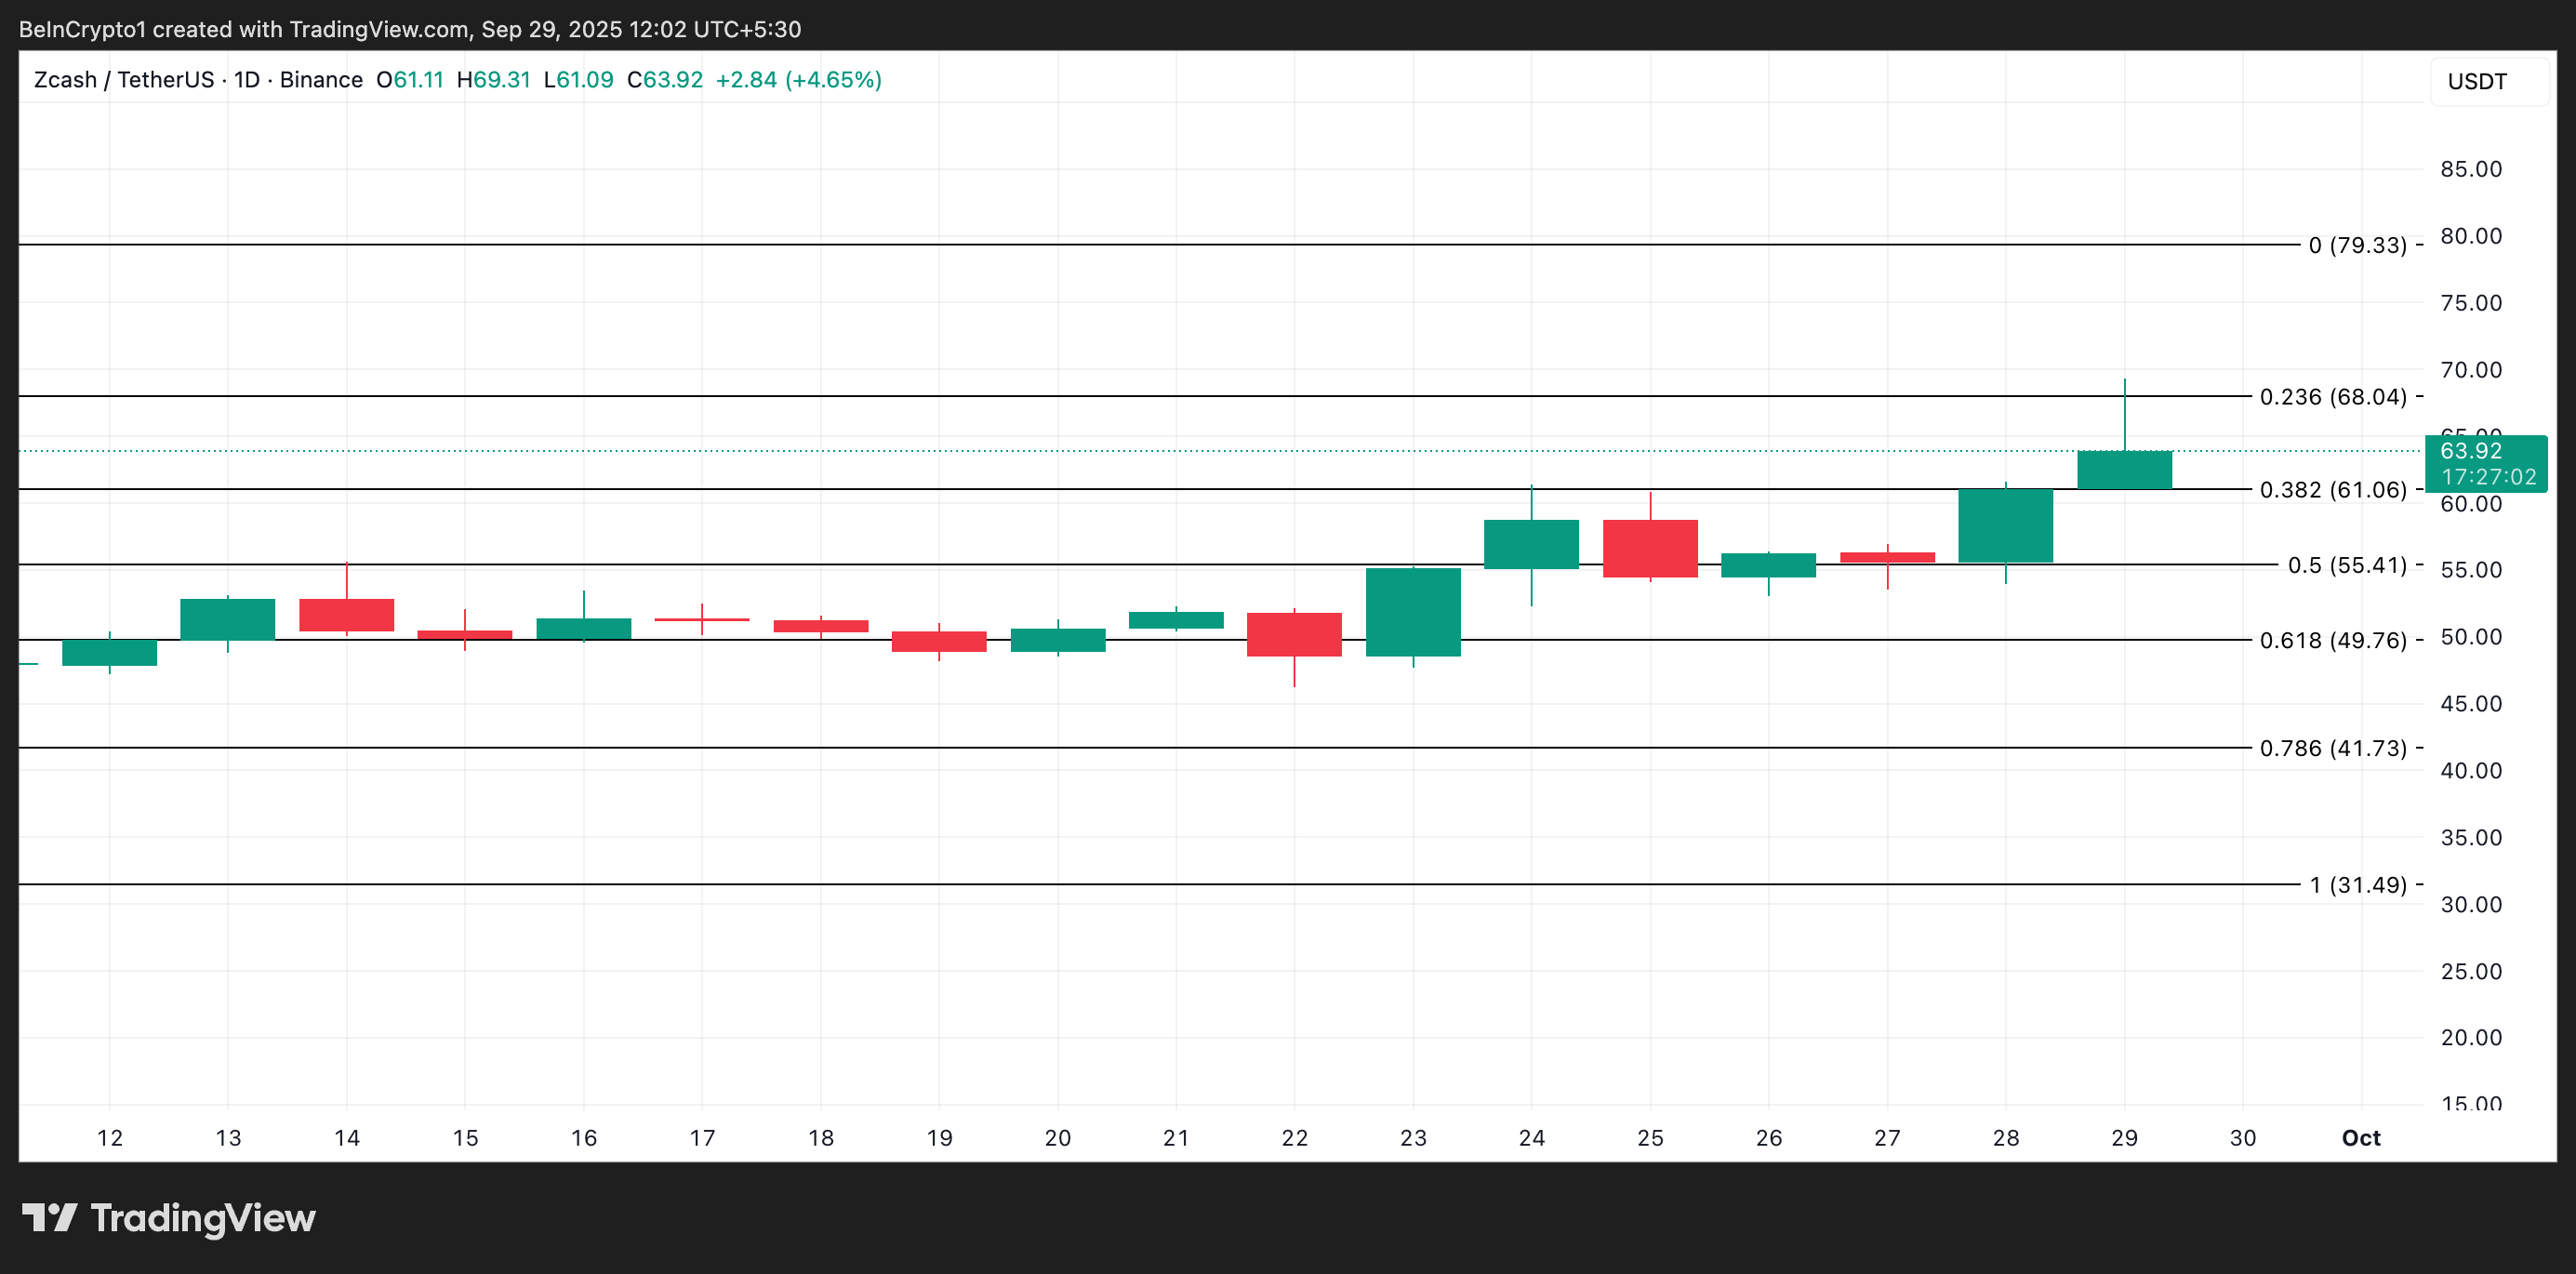
However, a surge in profit-taking activity could invalidate this bullish outlook. If selloffs resume, ZEC could lose recent gains and plunge below support at $61.06.
