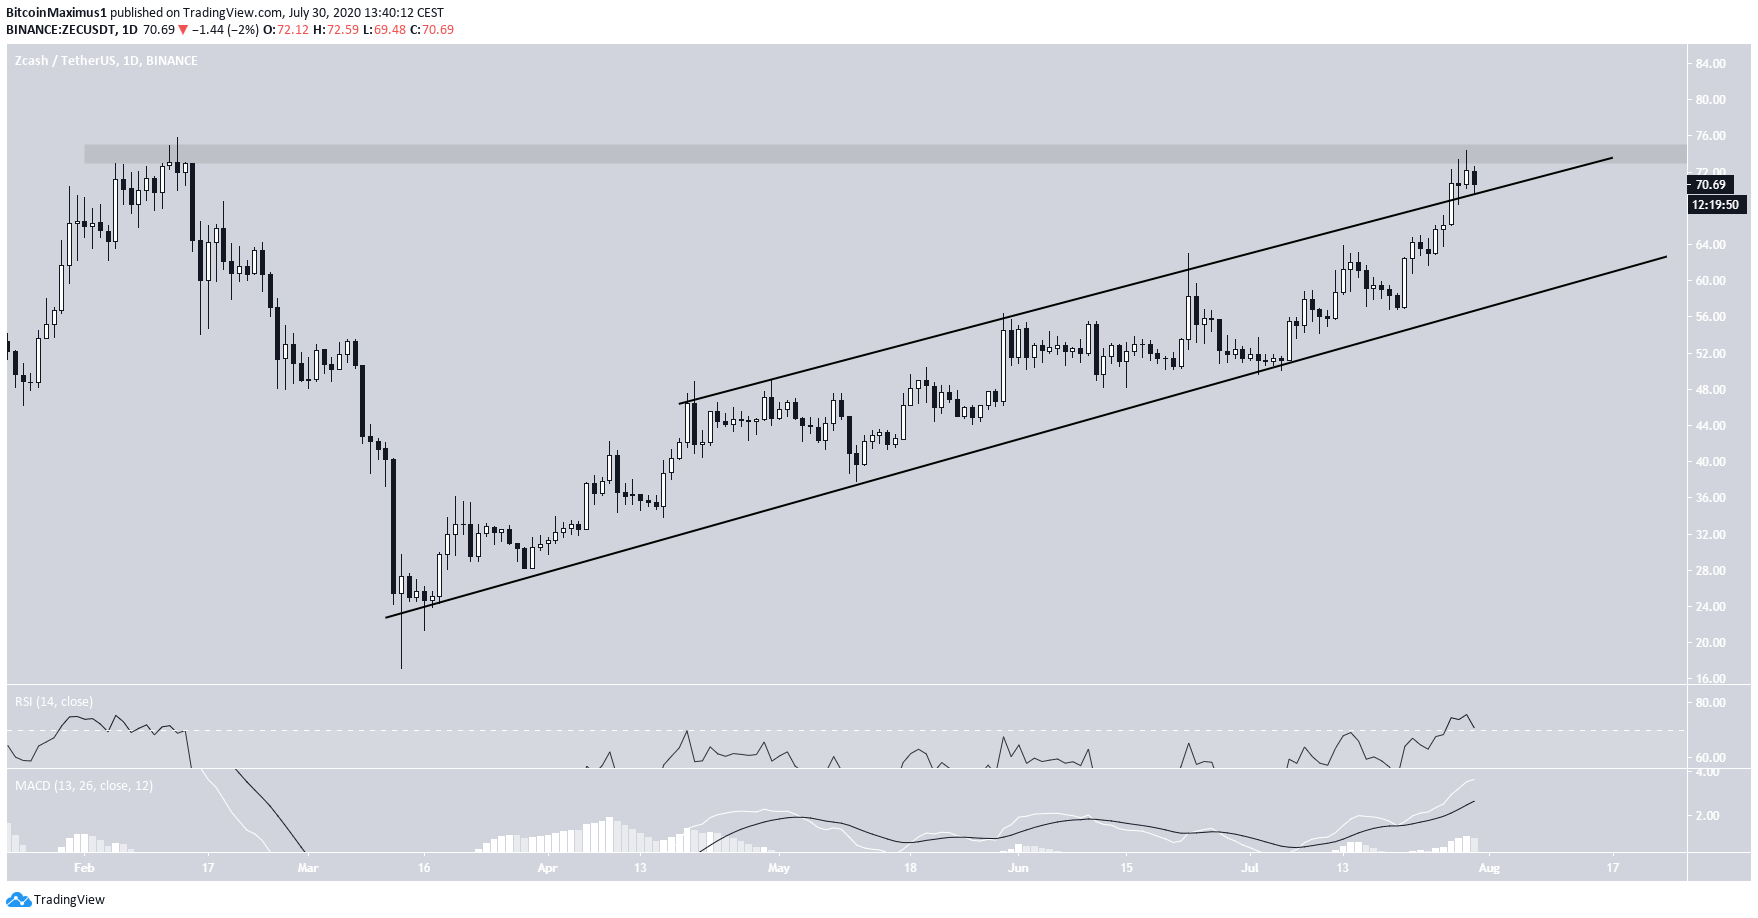
The Zcash (ZEC) price has broken out from a parallel channel in place since March. If it successfully breaks out above the long-term $74 resistance area, it could rapidly accelerate.
ZEC Attempts to Break the March High
The ZEC price has been increasing since it reached a bottom on March 13. The rise was gradual, taking the shape of a parallel ascending channel.
On July 27, the price broke out from this channel and is currently in the process of validating it as support. However, the price is stuck between this support line and the $74 resistance area, which was the March high.
Technical indicators are still bullish, even though the rally has begun to stall. The RSI is overbought but has not formed any bearish divergence yet.
While the MACD is losing steam, with the current daily momentum bar lower than the preceding one, it has not reached a close yet, so it’s possible that the bar will rise.
Therefore, an eventual breakout from this resistance area is the most likely scenario.
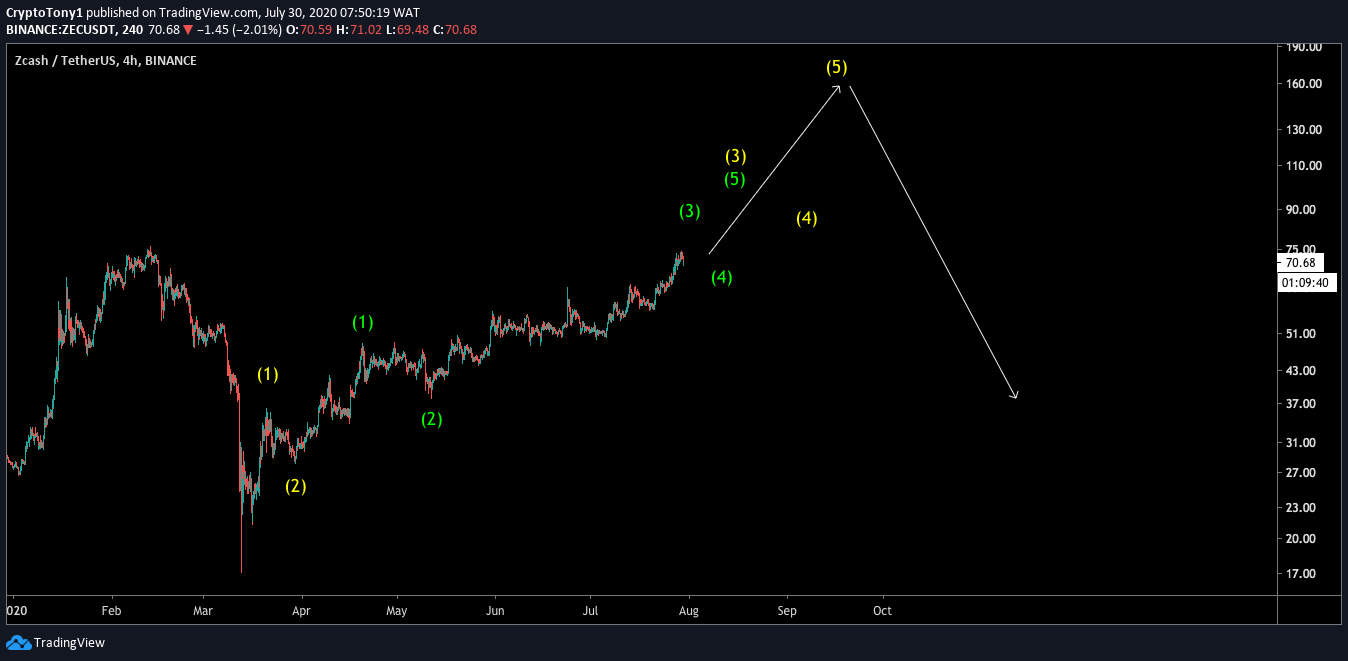
Cryptocurrency trader @glowto1994 outlined a ZEC chart, which gives a final target of $150 for the upcoming move.
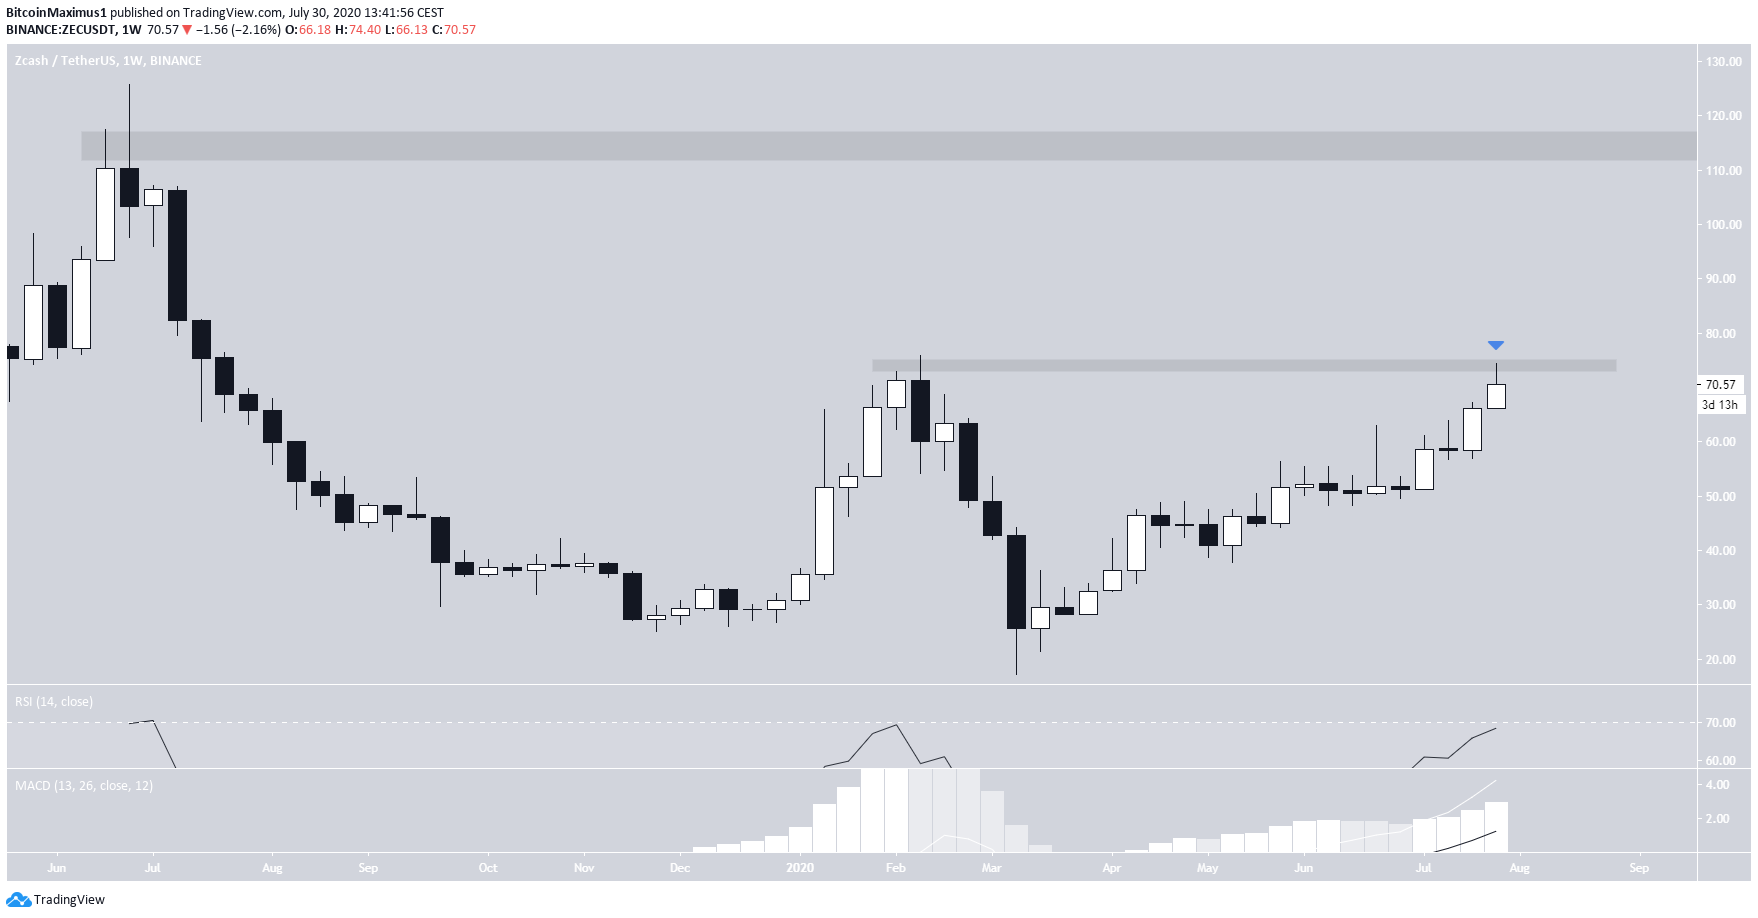
Looking at the weekly price action formed from March, we can see a possible double top forming, which is also visible by a potential long upper wick.
However, technical indicators support a rally. Both the RSI and the MACD are growing, and the former is not even overbought yet. If the price successfully breaks out, the next resistance area would be found at $115.
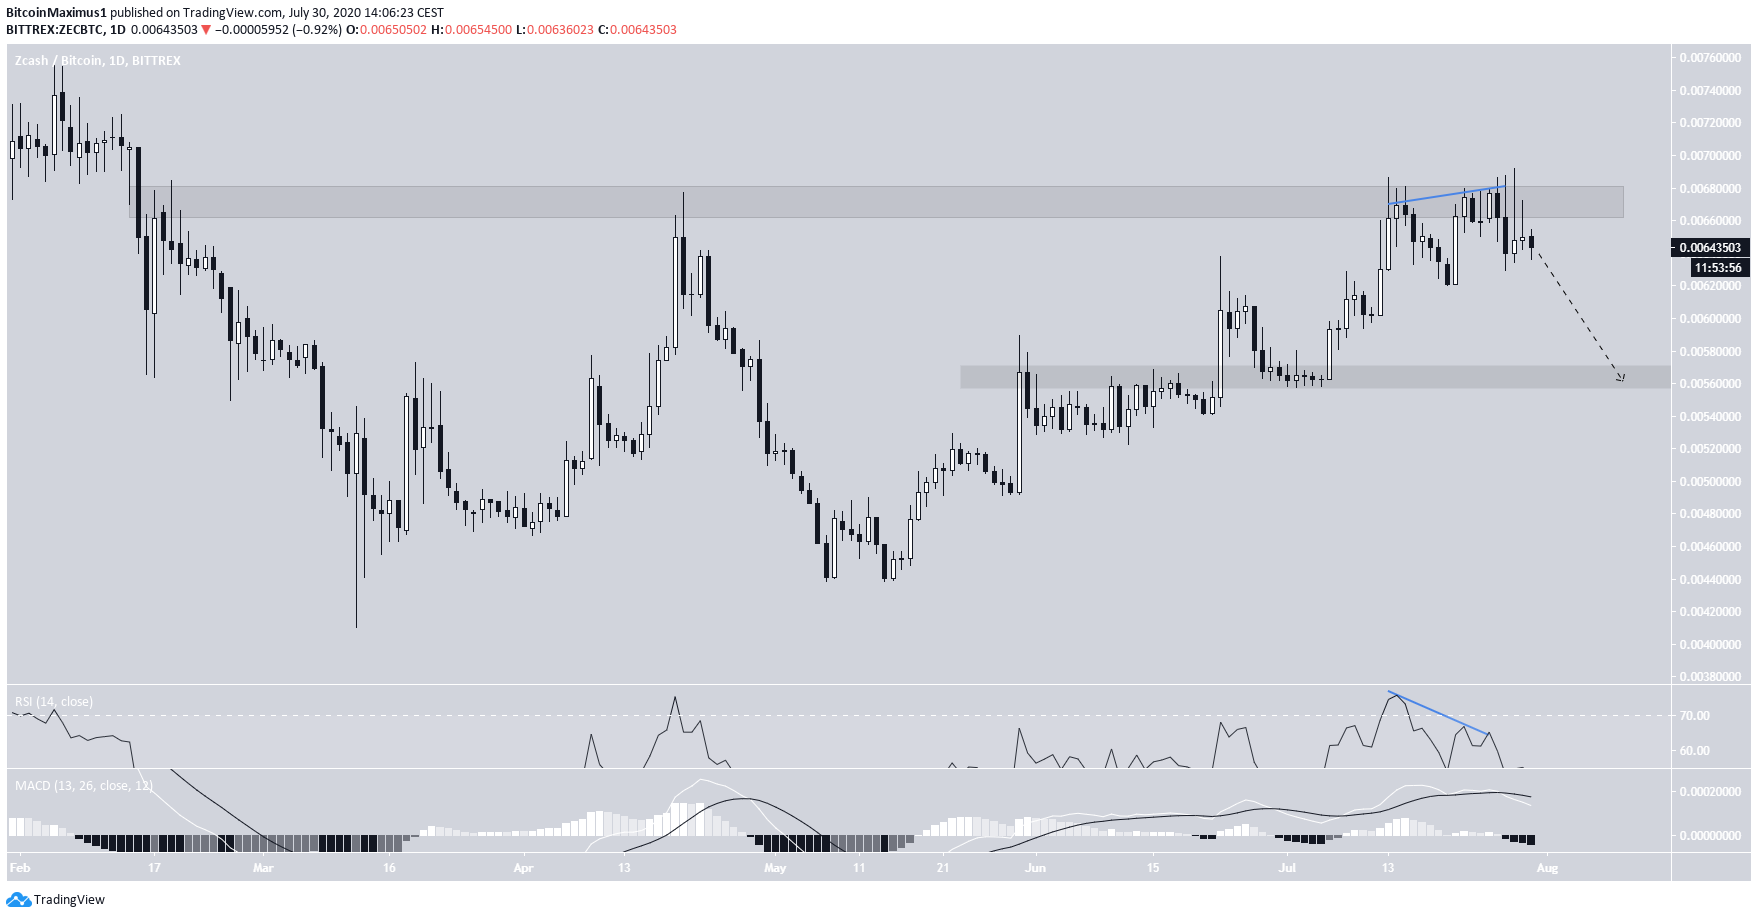
ZEC/BTC
The ZEC/BTC pair provides a considerably more bearish outlook compared with its USD counterpart. The price was rejected by the ₿0.00675 resistance area, creating several long upper wicks, a double top pattern.
Furthermore, it has since declined and the daily RSI is forming considerable bearish divergence. The MACD has also made a bearish cross. This signals that the price will fall. The closest support area is at ₿0.0055.