
On June 4, the Zcash price (ZEC) reached an hourly high of $83.3. A rapid decrease ensued and the price made a low of $75.4 the same day.
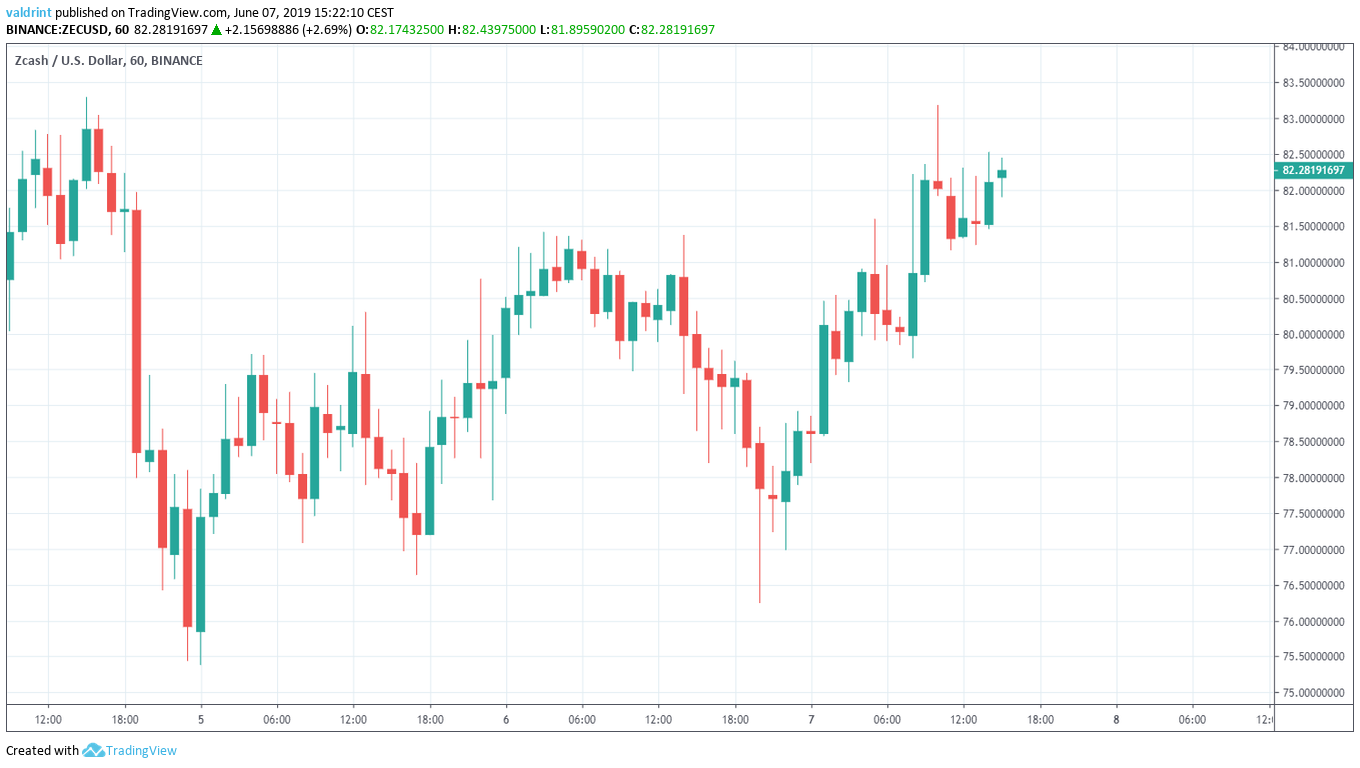
Since then, the price has been gradually increasing, reaching highs above $73 on June 7.
Below we are going to analyze the Zcash price in different timeframes alongside technical indicators and try to predict its future movement.
Zcash Price (ZEC): Trends and Highlights for Jun 7, 2019
- ZEC/USD is trading inside an ascending channel.
- The moving averages have made a bearish cross.
- The price is struggling to break out above the 0.5 fib line of the entire drop.
- There is resistance near $84 and support near $76.
Ascending Channel
The price of ZEC on Binance is analyzed at one-hour intervals from June 4 to June 7 in order to trace its current pattern.
On June 5, the Zcash price )ZEC) made a low of $75.38. An upward move ensued, and ZEC/USD made a high of $80.3 the same day.
Since then, it has been trading inside the ascending channel outlined below:
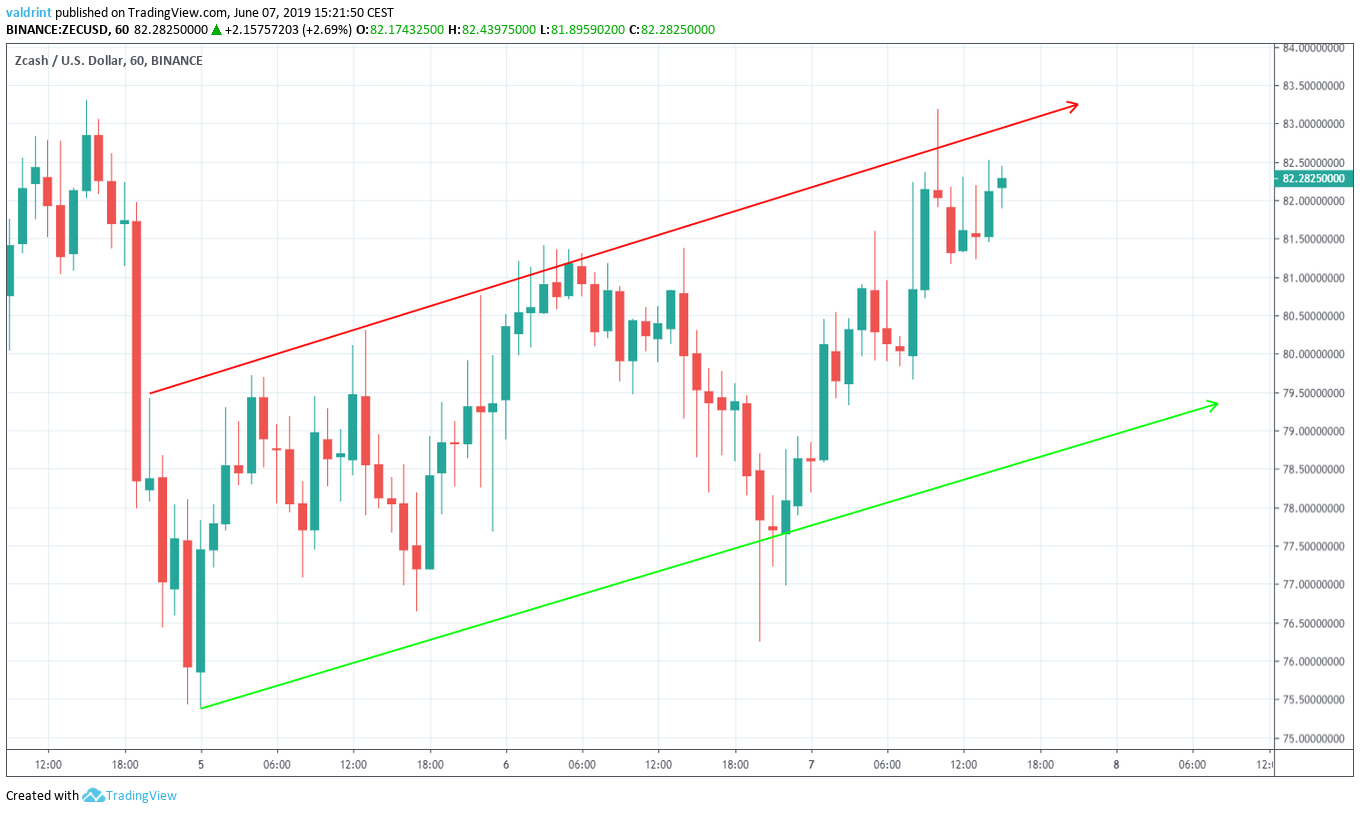
At the time of writing, the Zcash price (ZEC) was trading close to the resistance line of the channel. Previously, it had made three unsuccessful attempts at breaking out above this line.
Will this one be successful? A look at technical indicators is required in order to answer this question.
Technical Indicators
The Zcash price is analyzed alongside the 100- and 200-period moving averages (MA) below:
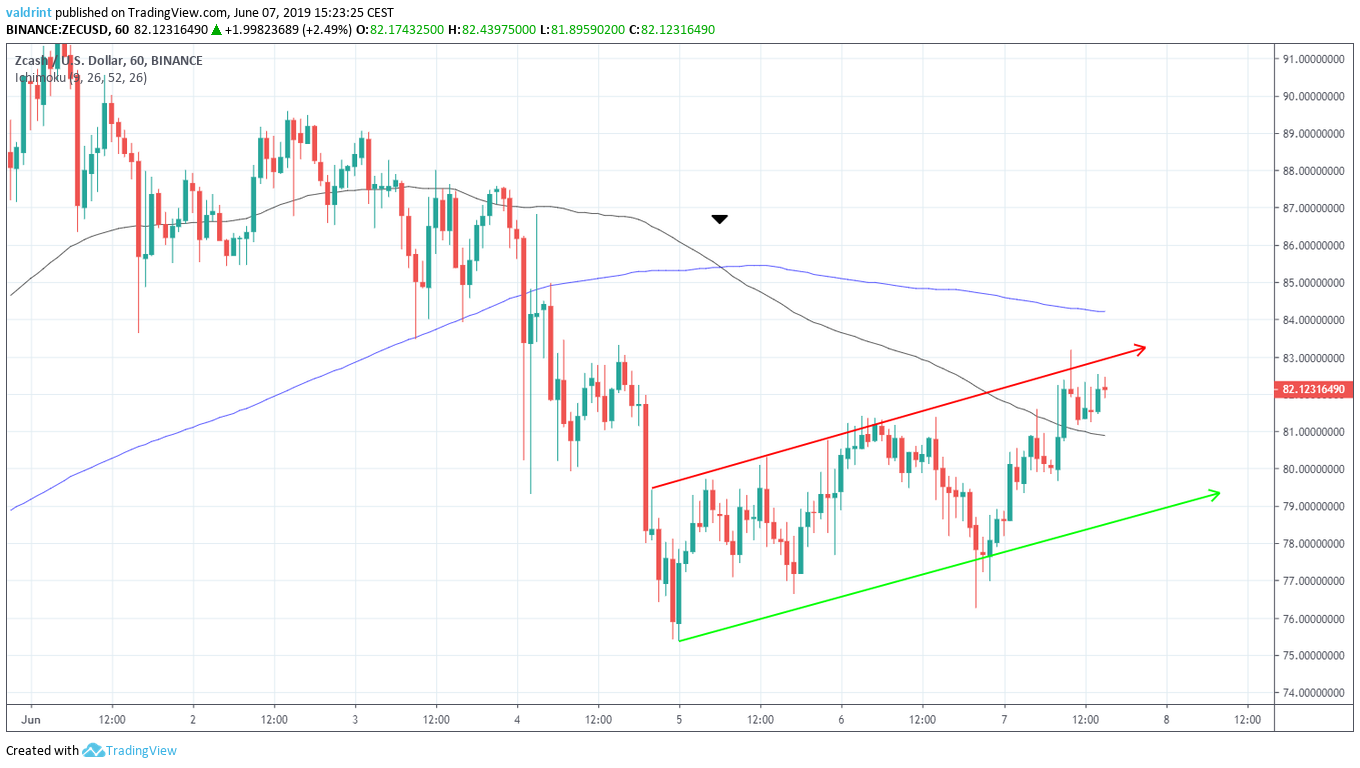
On June 5, the 100- and 200-period MAs made a bearish cross. This often indicates that a downtrend has begun.
The recent upward movement took the Zcash price (ZEC) above the 100-period MA. However, it is still trading below the 200- period one.
The price is also struggling to break out above the 0.5 fib line of the entire drop.
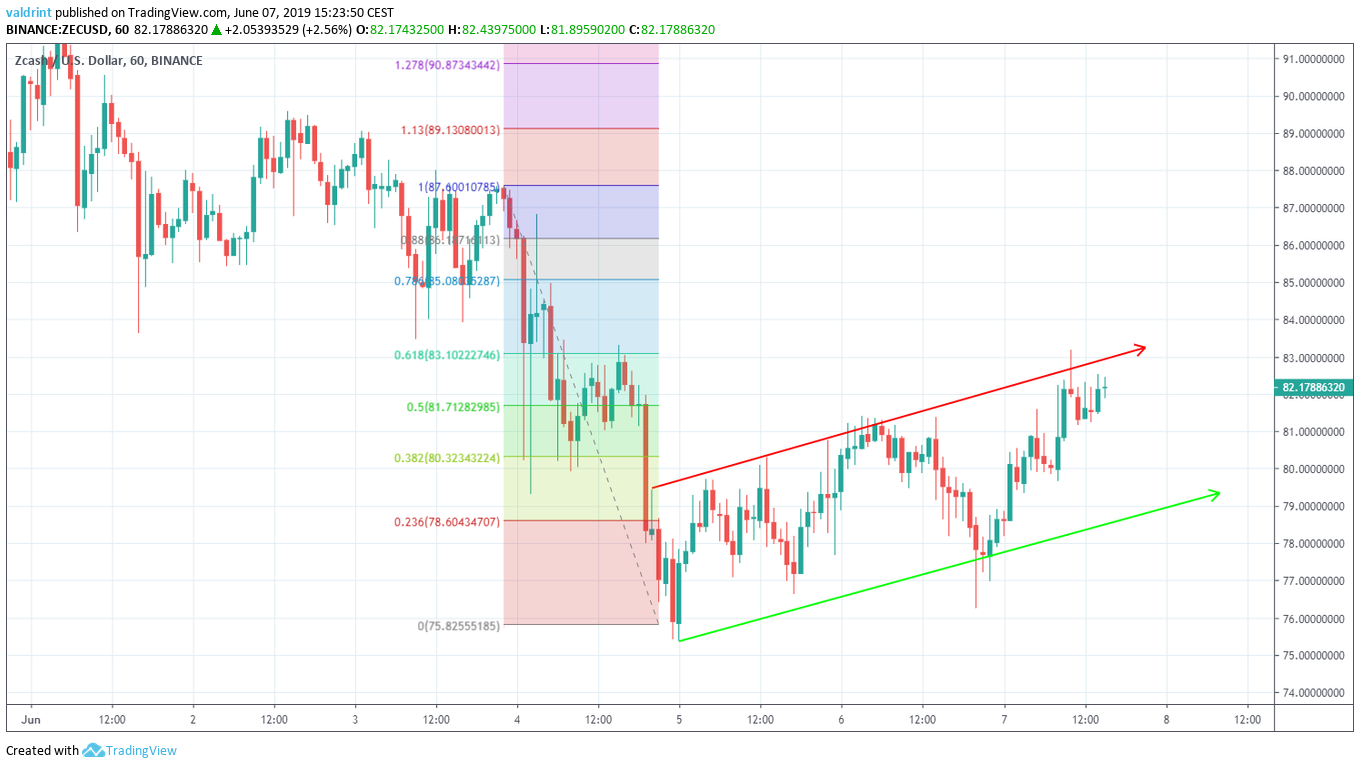
It previously made an unsuccessful attempt at breaking out on June 4, before reversing and making a low on June 5.
These indicators and fib ratios indicate that there is significant resistance near current prices. However, there are no definite signs that the Zcash price (ZEC) will not break out above it. Most short-term technical indicators give a neutral outlook.
Therefore, the most likely scenario is that the price will continue to trade within the confines of the channel, possibly dropping to validate the support line once more.
Reversal Areas
One resistance and one support area are traced for ZEC/USD below. If a decisive move occurs, they are likely to provide a reversal.
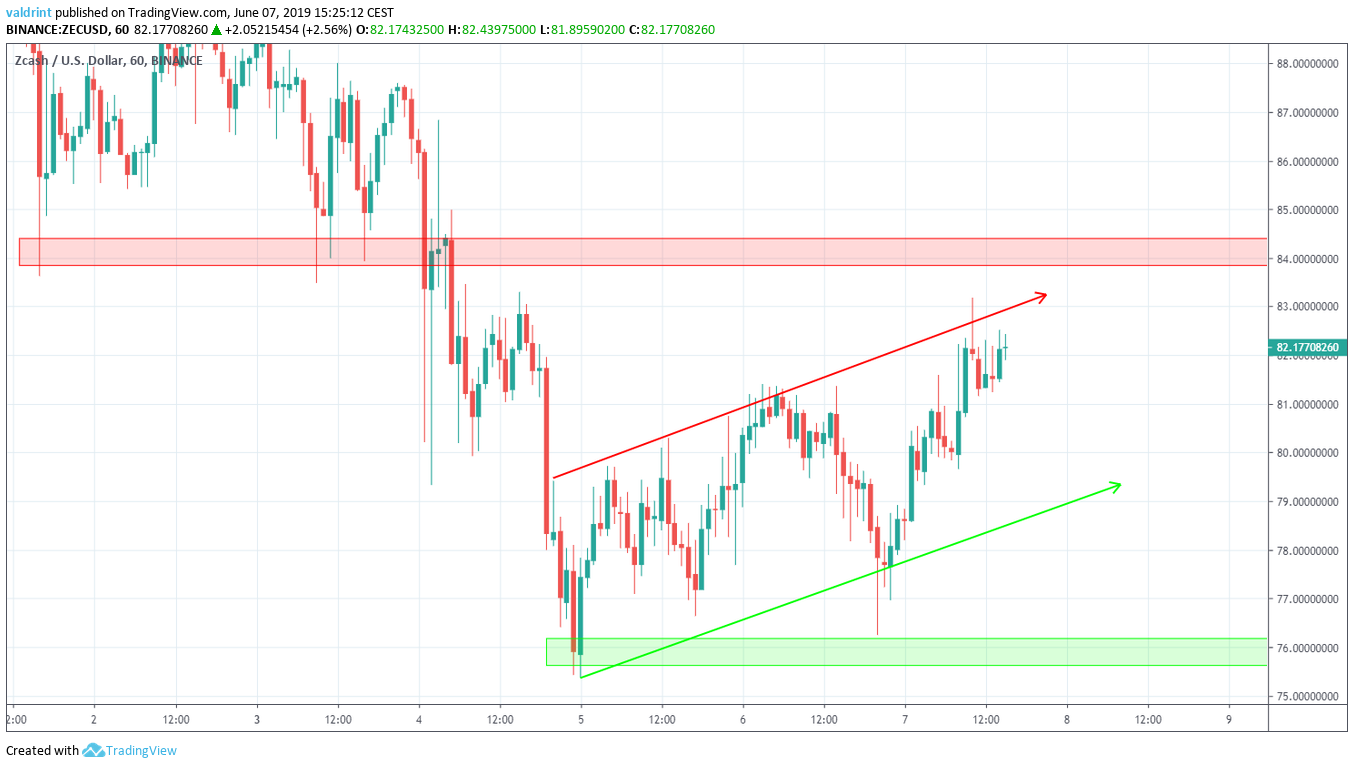
The closest resistance area is found near $84. If the price continues to increase at the rate predicted by the channel, it is likely to reach this area on Jun 9.
The closest support area is found near $76. If the price breaks down from the triangle, it is likely to provide support and possibly initiate a reversal.
Summary
The Zcash price (ZEC) s trading in an ascending channel. The 100- and 200- hour moving averages have made a bearish cross. An analysis of technical indicators supports gradual price increases at the rate predicted by the channel.
Do you think the price of ZEC will reach the resistance area? Let us know in the comments below.
If you’d like to read the long-term price predictions of Zcash, click on the blue button below:
