


The Zcash (ZEC) price is currently trading inside a long-term resistance area. Multiple attempts at breaking out have been rebuffed and ZEC has been consolidating just below this resistance area since.
Whether Zcash breaks out above this resistance or breaks down from its bullish structure will be crucial in determining the direction of the trend.
Zcash Long-Term Levels
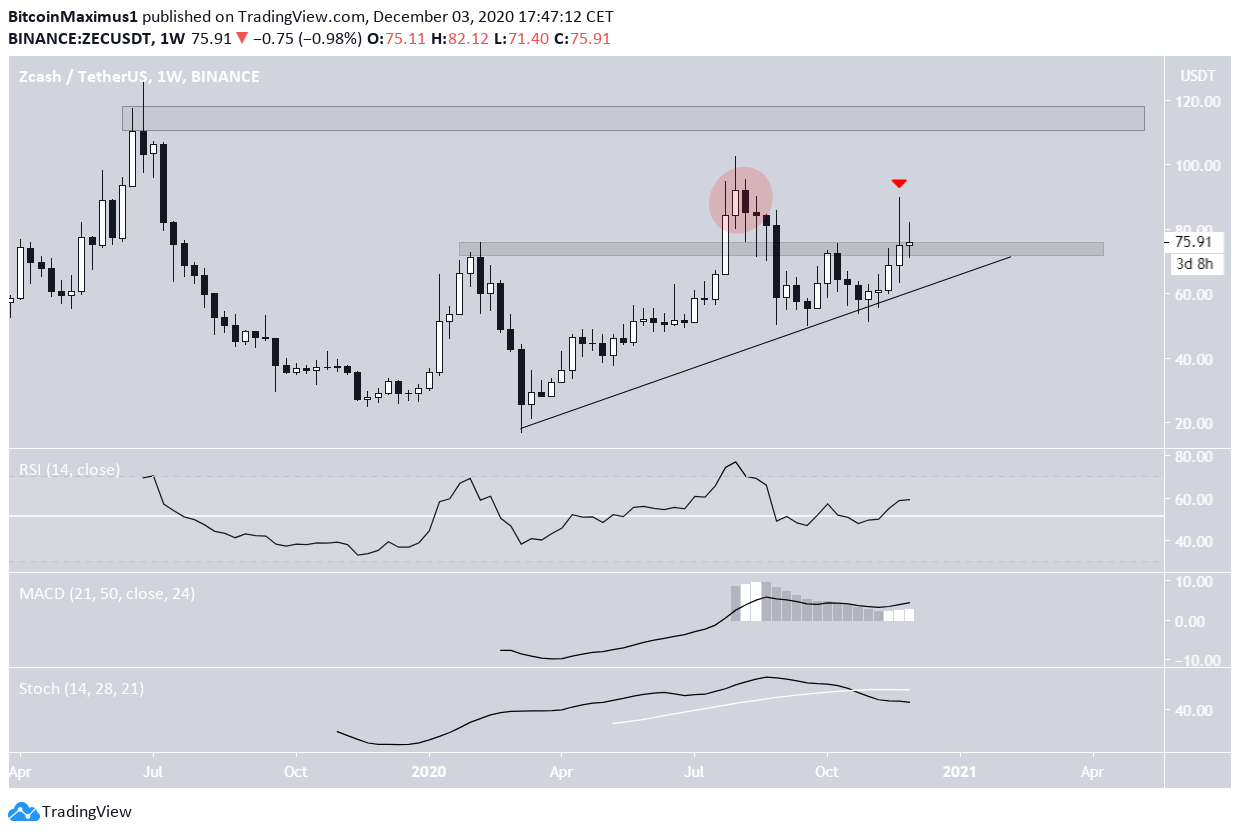
The ZEC price is currently trading inside the long-term $75 resistance area. The area has been acting as resistance since the beginning of 2020, with the exception of a deviation in August that was followed by a sharp drop below this area (highlighted in red in the image below).
ZEC is still following an ascending support line, which combined with the resistance area creates an ascending triangle. If ZEC were to break out above this triangle, the next resistance area would be found at $115.
Technical indicators give conflicting signs. The MACD and RSI are increasing, but the Stochastic oscillator has made a bearish cross.
Therefore, we need to take a look at lower time-frames in order to determine if the price will break out above the resistance area or break down from the ascending support line.
Current Rejection
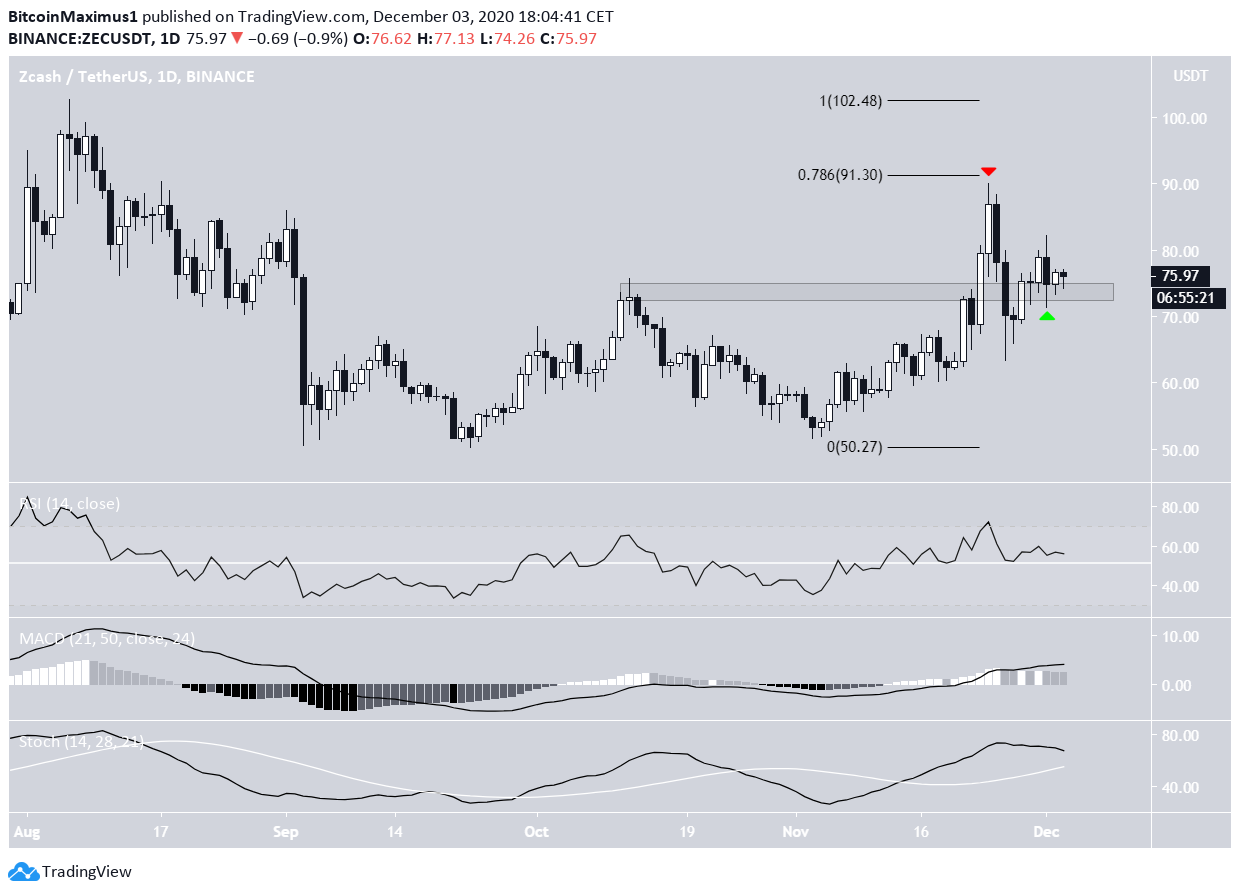
The daily chart for ZEC shows that the price was rejected by the 0.786 Fib resistance level on Nov. 24 before decreasing once more. This allows for the possibility that the entire increase measured from the beginning of September is a correction in relation to the previous downward movement.
However, ZEC reclaimed the minor $74 support area after being rejected. As long as it’s trading above it, ZEC is expected to continue moving upwards.
Similar to the weekly time-frame, technical indicators are undecided.
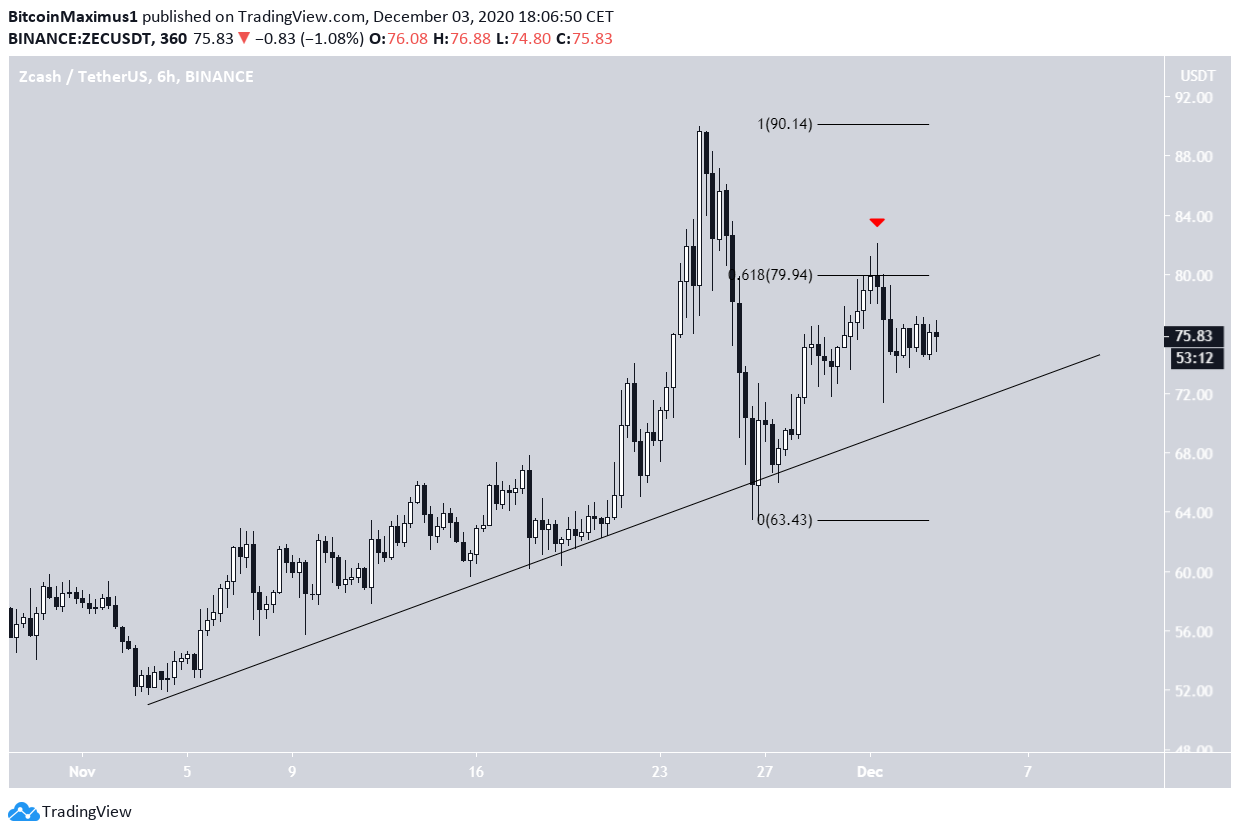
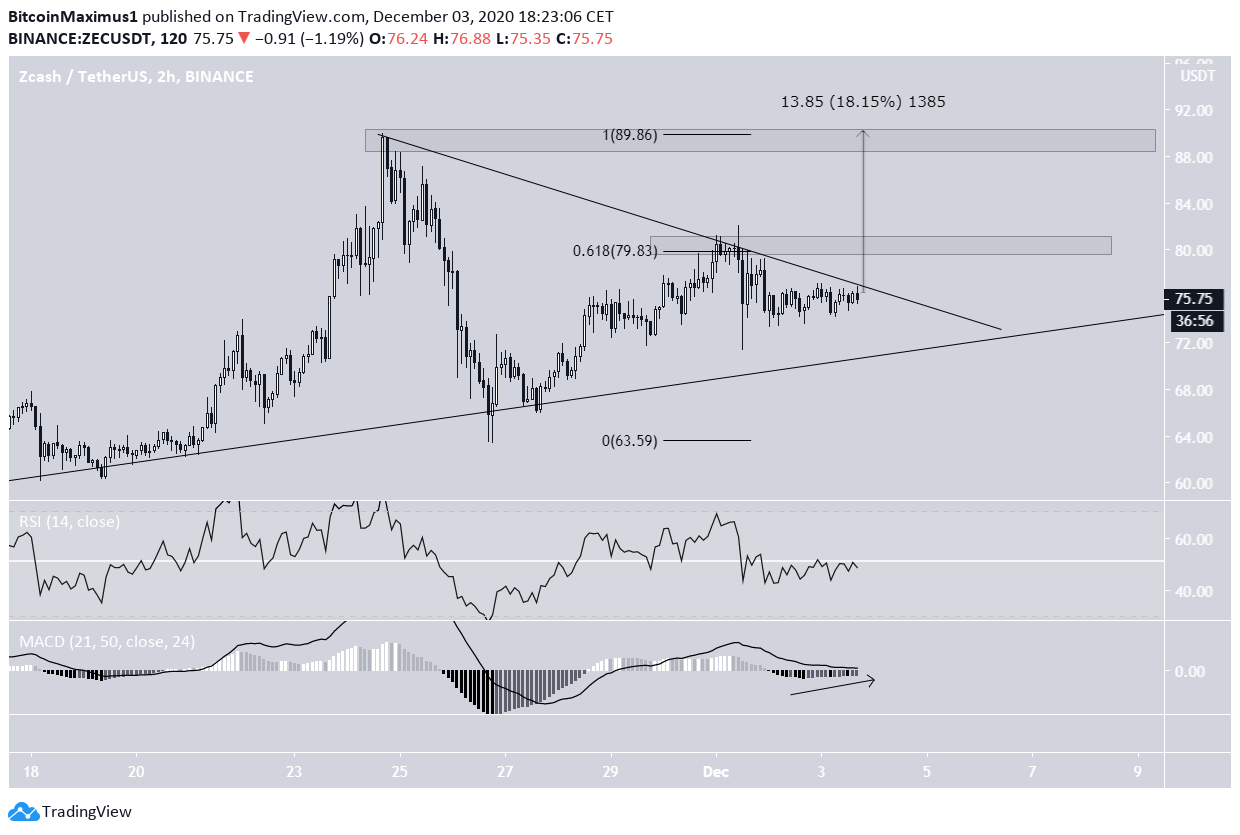
An even shorter-term look shows that ZEC is following an ascending support line and has been doing so since Nov. 4
Despite this, there is another rejection from the 0.618 Fib retracement level which caused yet another drop. However, as long as ZEC is trading above this support line, it is expected to continue moving upwards and eventually break out from the 0.618 Fib resistance level.
Future Movement
Cryptocurrency trader @Cointradernik tweeted a chart that shows a possible breakout for ZEC, which could cause it to increase by at least 20%.
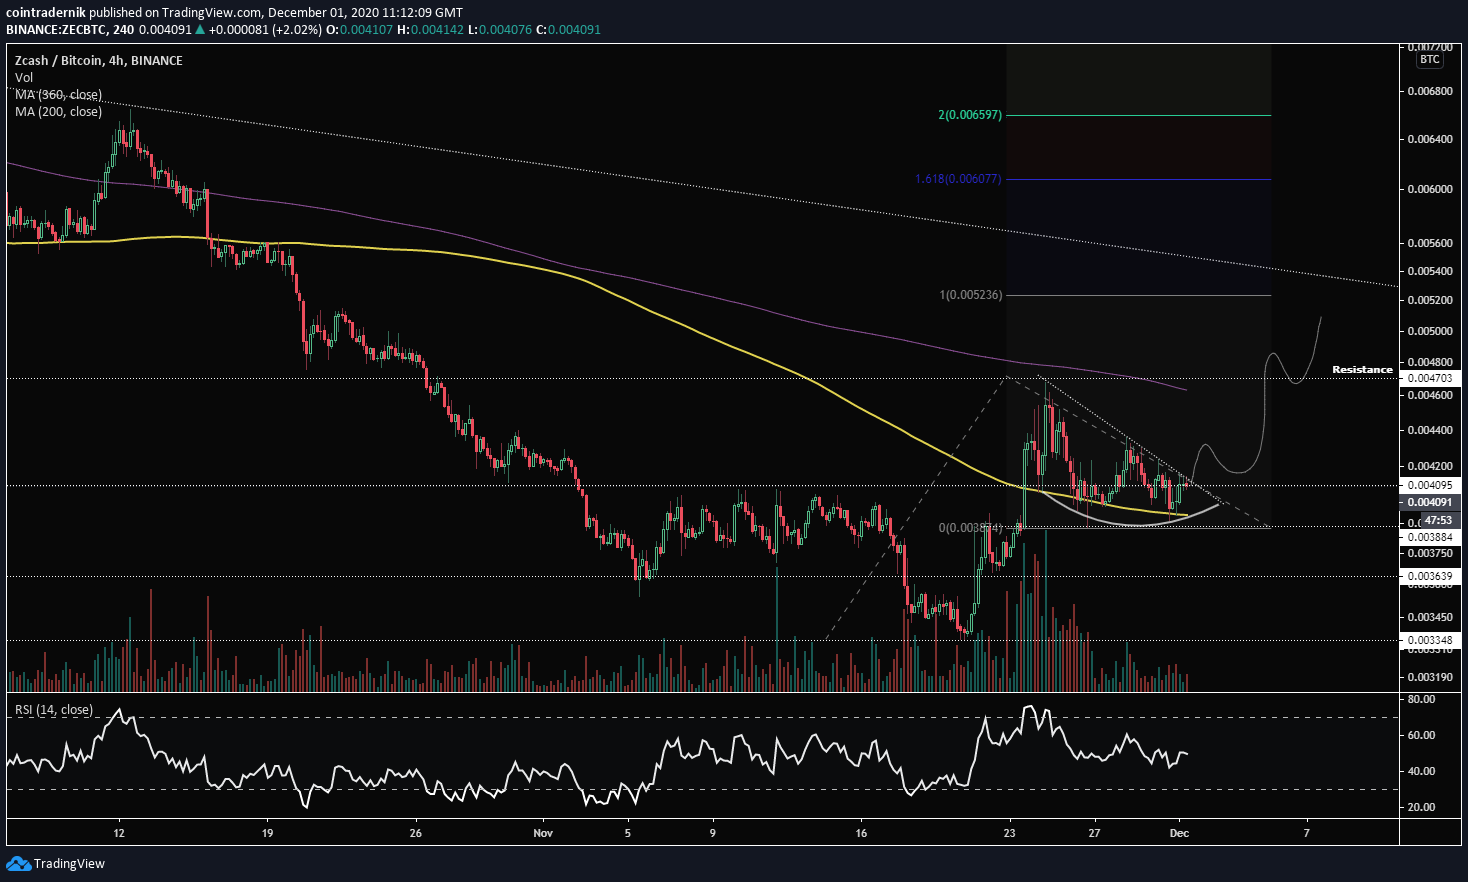
A closer look at the movement reveals that the price is also following a descending resistance line. A breakout above this line could indeed cause an upward move of nearly 20%.
However, while the MACD supports the possibility of a breakout, the RSI is neutral.
Therefore, whether ZEC breaks out or down from the current pattern will be essential in determining the direction of the next movement.
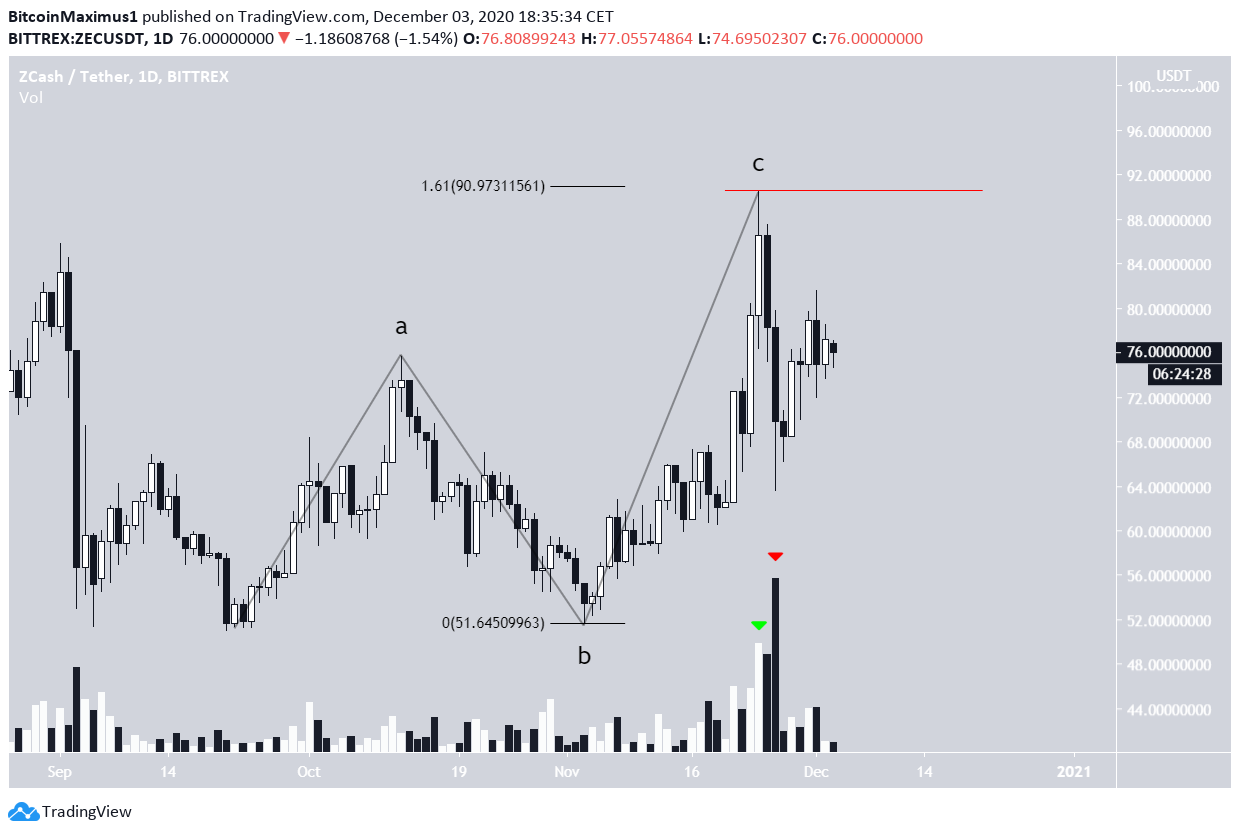
ZEC Wave Count
The ZEC movement since Sept. 23 closely resembles an A-B-C corrective structure (black). This possibility is supported by the fact that the A:C waves have a 1:1.61 ratio, common in such corrections.
Furthermore, volume has been higher during the drop than it has been during the upward movements.
If the count is accurate, ZEC will likely break down from the previously mentioned ascending support line and continue towards new lows.
An increase above the C wave high at $90.45 (red line) would invalidate this particular wave count.
Conclusion
The direction of the Zcash trend remains unclear. Whether the price breaks out from the current short-term resistance area or breaks down from the ascending support line will likely be the determinant of the trend’s direction.
For BeInCrypto’s latest Bitcoin analysis, click here!
Disclaimer: Cryptocurrency trading carries a high level of risk and may not be suitable for all investors. The views expressed in this article do not reflect those of BeInCrypto


