
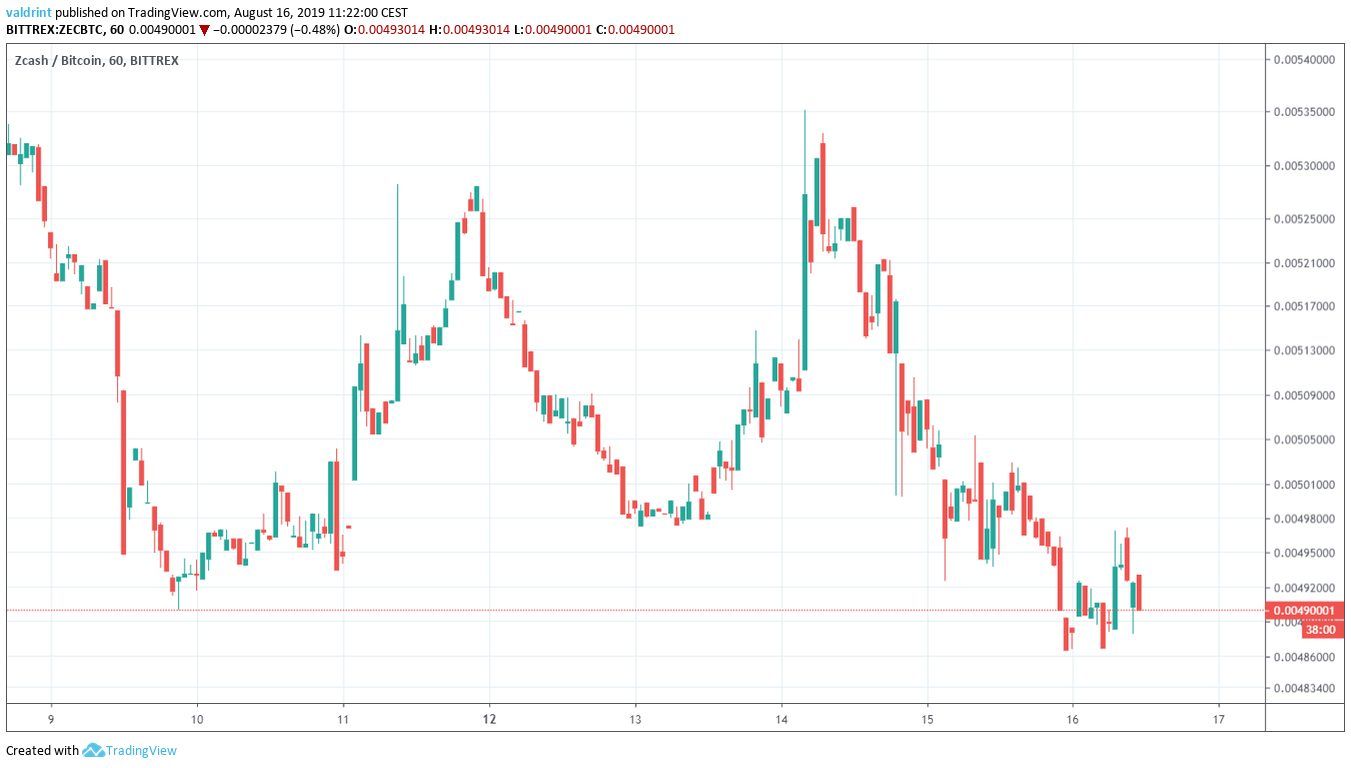
On August 10, 2019, the Zcash price reached a low of 490,000 satoshis. An upward move followed, and ZEC reached a high of 511,200 satoshis on August 14. It has been decreasing since — most notably reaching lows 486,500 satoshis of on August 16.
Will the ZEC price continue to decrease or is there a reversal waiting to be initiated? Continue reading if you are interested in finding out.
For our previous analysis, click here.
For those of you interested in a video analysis, click below:
If you are interested in trading cryptocurrencies with a multiplier of up to 100x on our new partner exchange with the lowest fees, follow this link to get a free StormGain account!

Zcash Price: Trends and Highlights for August 16
- ZEC/BTC is trading at an all-time low price.
- There is bullish divergence developing in the RSI.
- The price is trading at a possible Fibonacci reversal level.
- The MACD has made a bullish cross.
- There is resistance at 513,000 satoshis.
ZEC Price at an All-Time Low
A look at the weekly time-frame shows that Zcash is trading at an all-time low price.
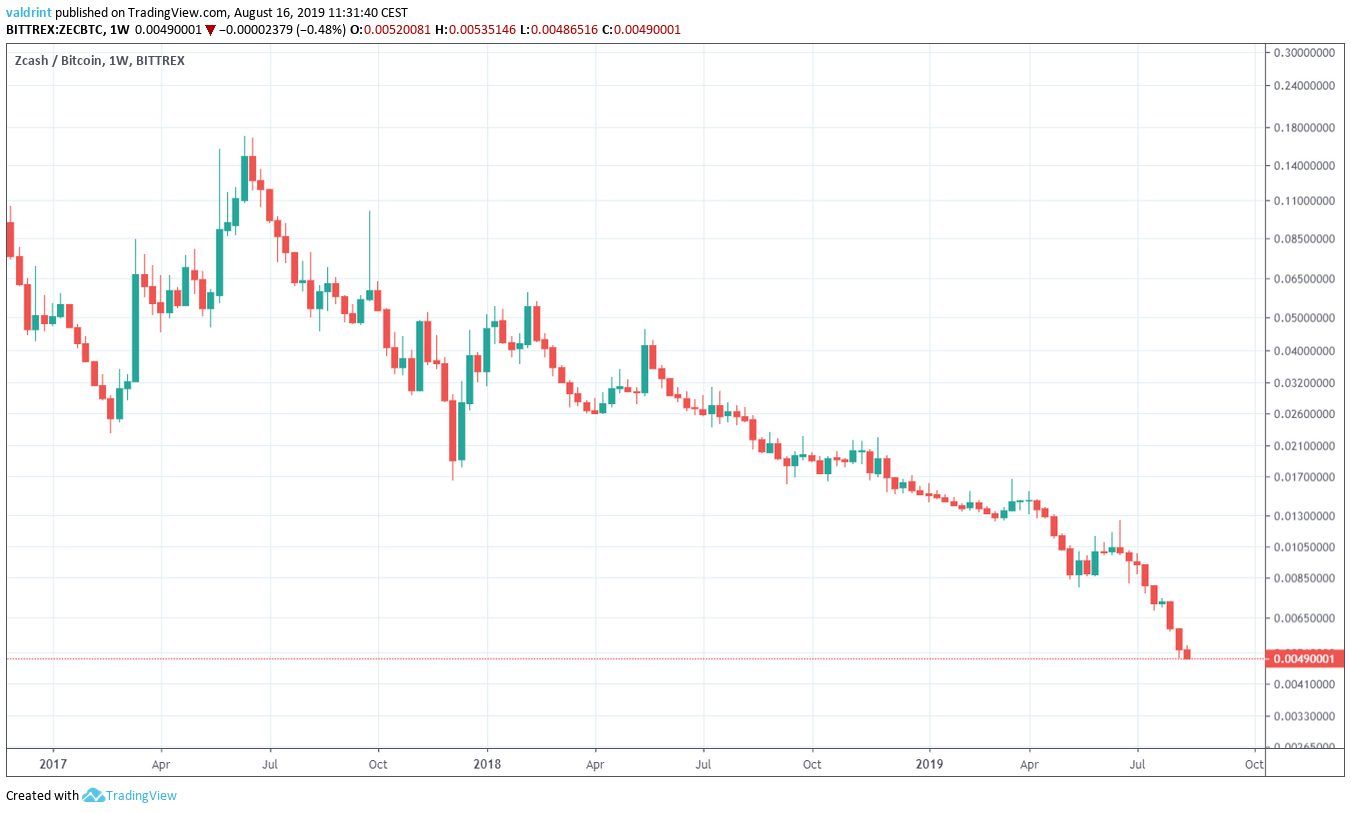
It first made an all-time low in December of 2018 and has been decreasing since.
The fact that there are no support areas left to provide a reversal makes it difficult to predict the bottom.
Reversal Levels
In order to do that, we will use a Fibonacci retracement tool on the most recent upward move from May 13 to May 17.
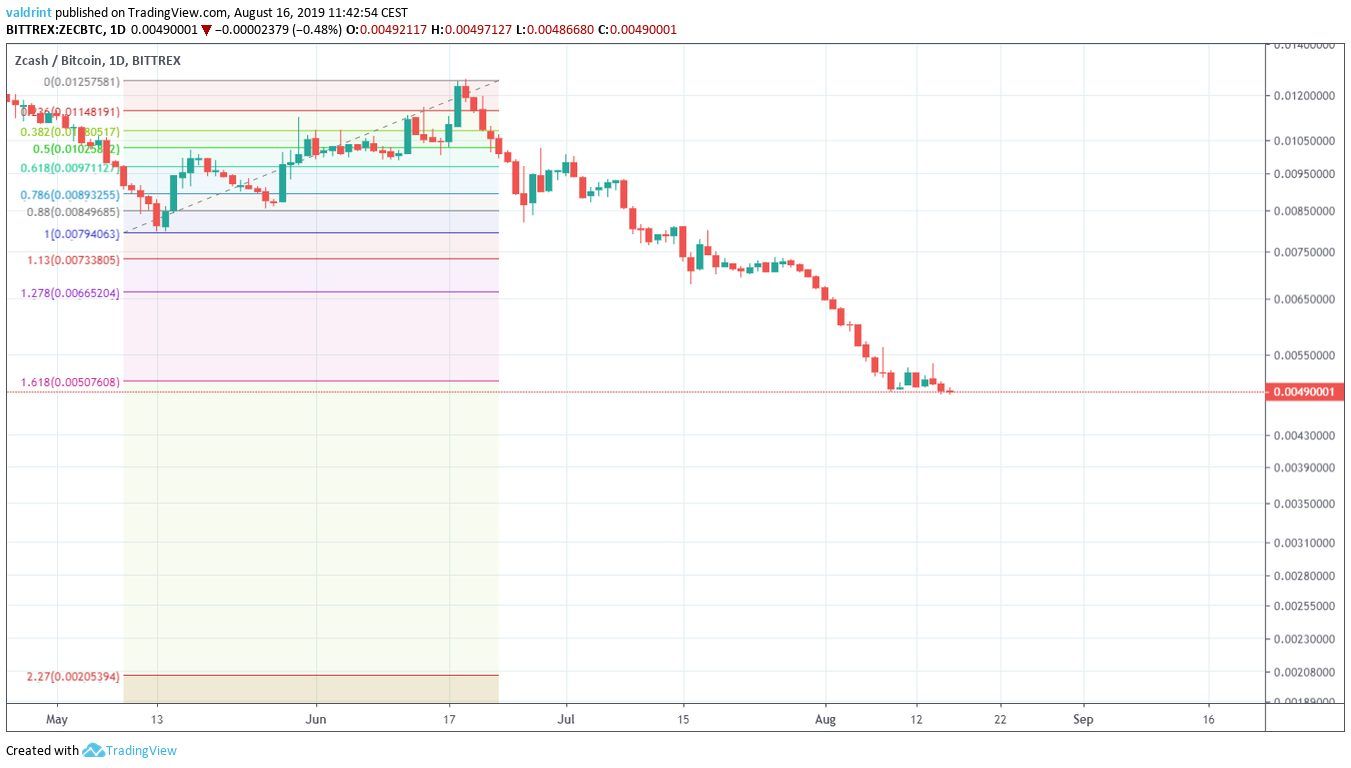
Doing that gives us a target of 500,000 satoshis for the subsequent low.
The next target for the Zcash price is found near 210,000 satoshis.
Since that one is quite far away, we are going to check for possible signs of reversal at the current level, which is very close to the first target.
Technical Indicators
The first such sign is given by the RSI.
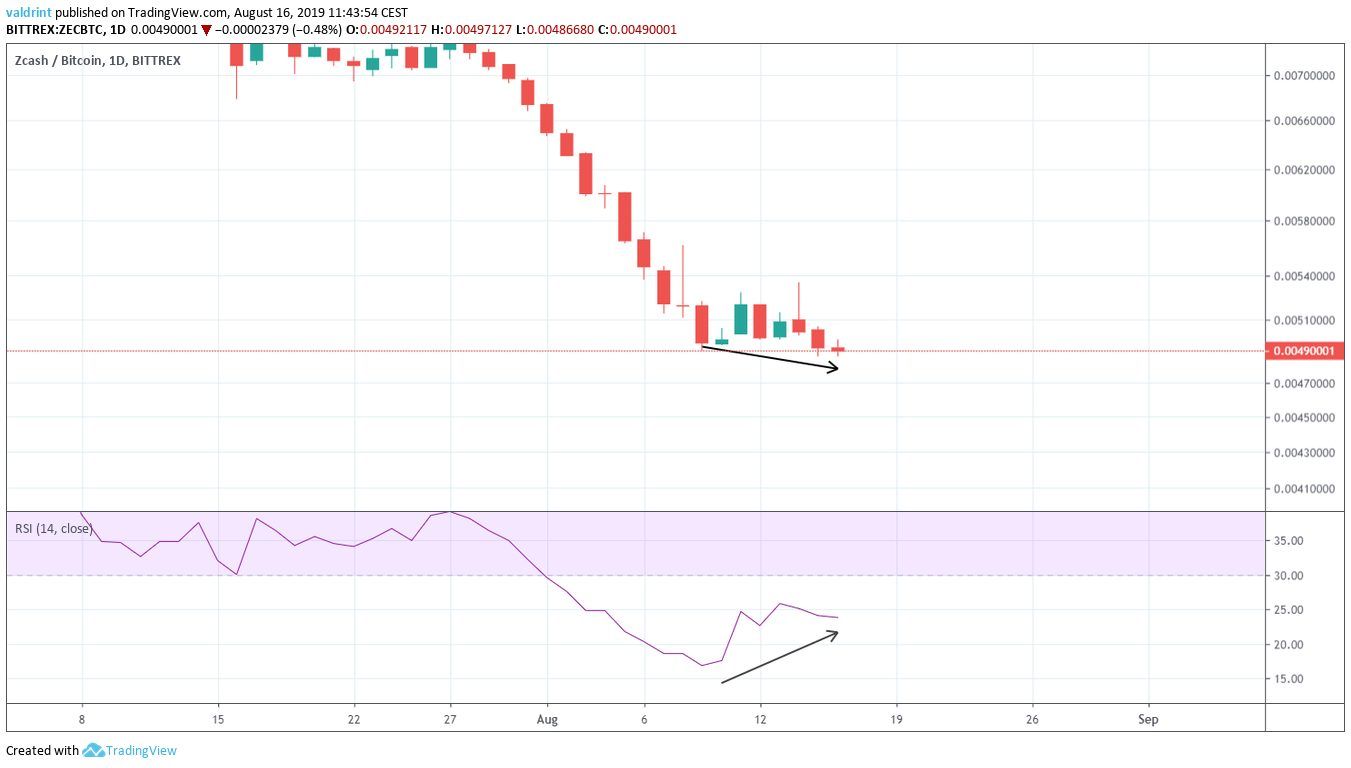
It has been developing bullish divergence since August 10.
The divergence is significant and is present in long-term time-frames such as the daily.
Additionally, we can see below that the MACD has made a bullish cross.
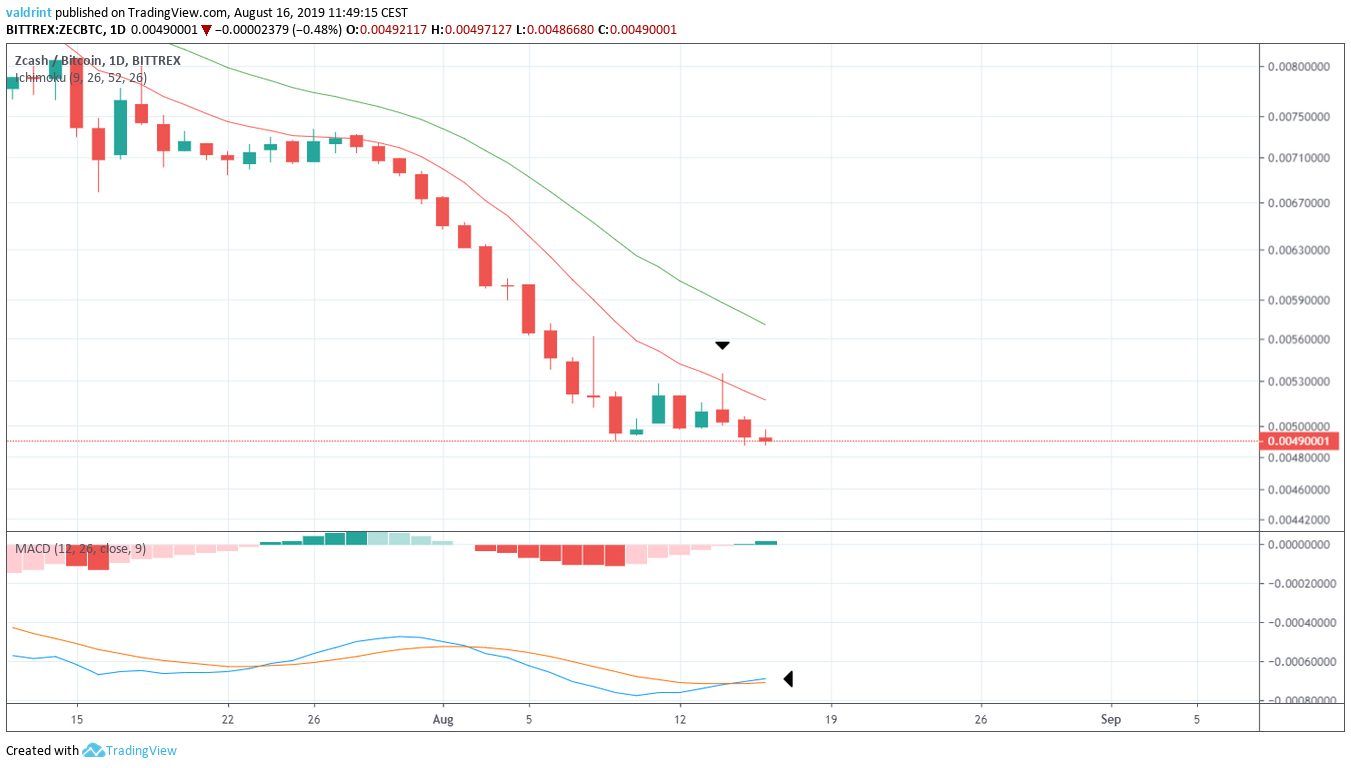
However, the Zcash price is still trading below the 10- and 20-day moving averages (MA).
During the time the bullish cross occurred in the MACD, the price made an unsuccessful attempt at breaking out above the 10-day MA.
This is a sign that the ZEC price is attempting to begin an upward move.
Future Movement
If it does, one resistance area is outlined below.
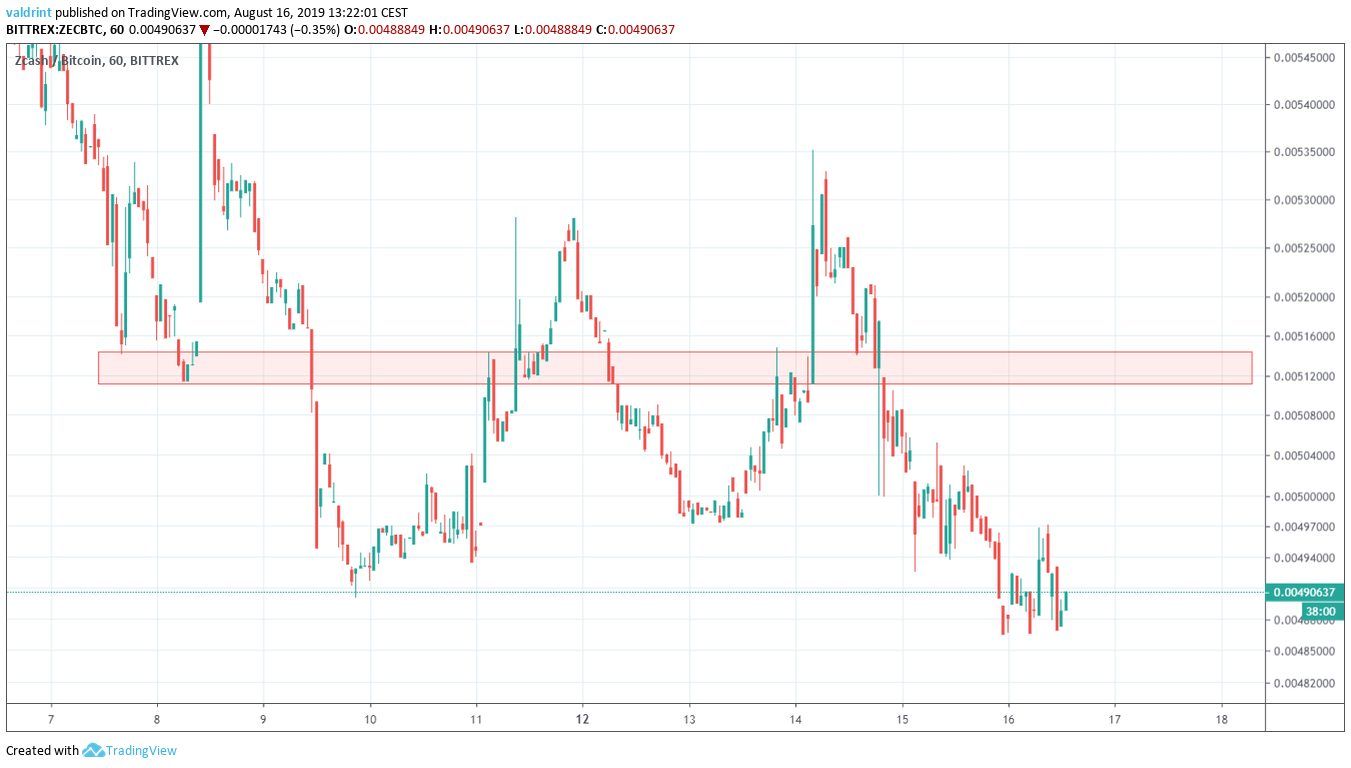
It is found at 513,000 satoshis.
We believe it is likely that the price will reach it.
Zcash Price Summary
The ZEC price is trading at an all-time low.
According to our analysis, it is likely to begin an upward move and reach the resistance area outlined above.
Do you think ZEC will reach the resistance area? Let us know in the comments below.
Disclaimer: This article is not trading advice and should not be construed as such. Always consult a trained financial professional before investing in cryptocurrencies, as the market is particularly volatile.
Images are courtesy of Shutterstock, Trading
