
Zcash price is extending its explosive rally, climbing 14% today and pushing monthly gains past 200%. The privacy token (ZEC) has surged more than 1,130% in the past three months, one of the sharpest recoveries in the market.
While indicators still flash bullish momentum, leverage-heavy trading could make the road to higher targets — including $1,567 — far from risk-free.
Hidden Bullish Divergence Keeps Zcash Rally Intact?
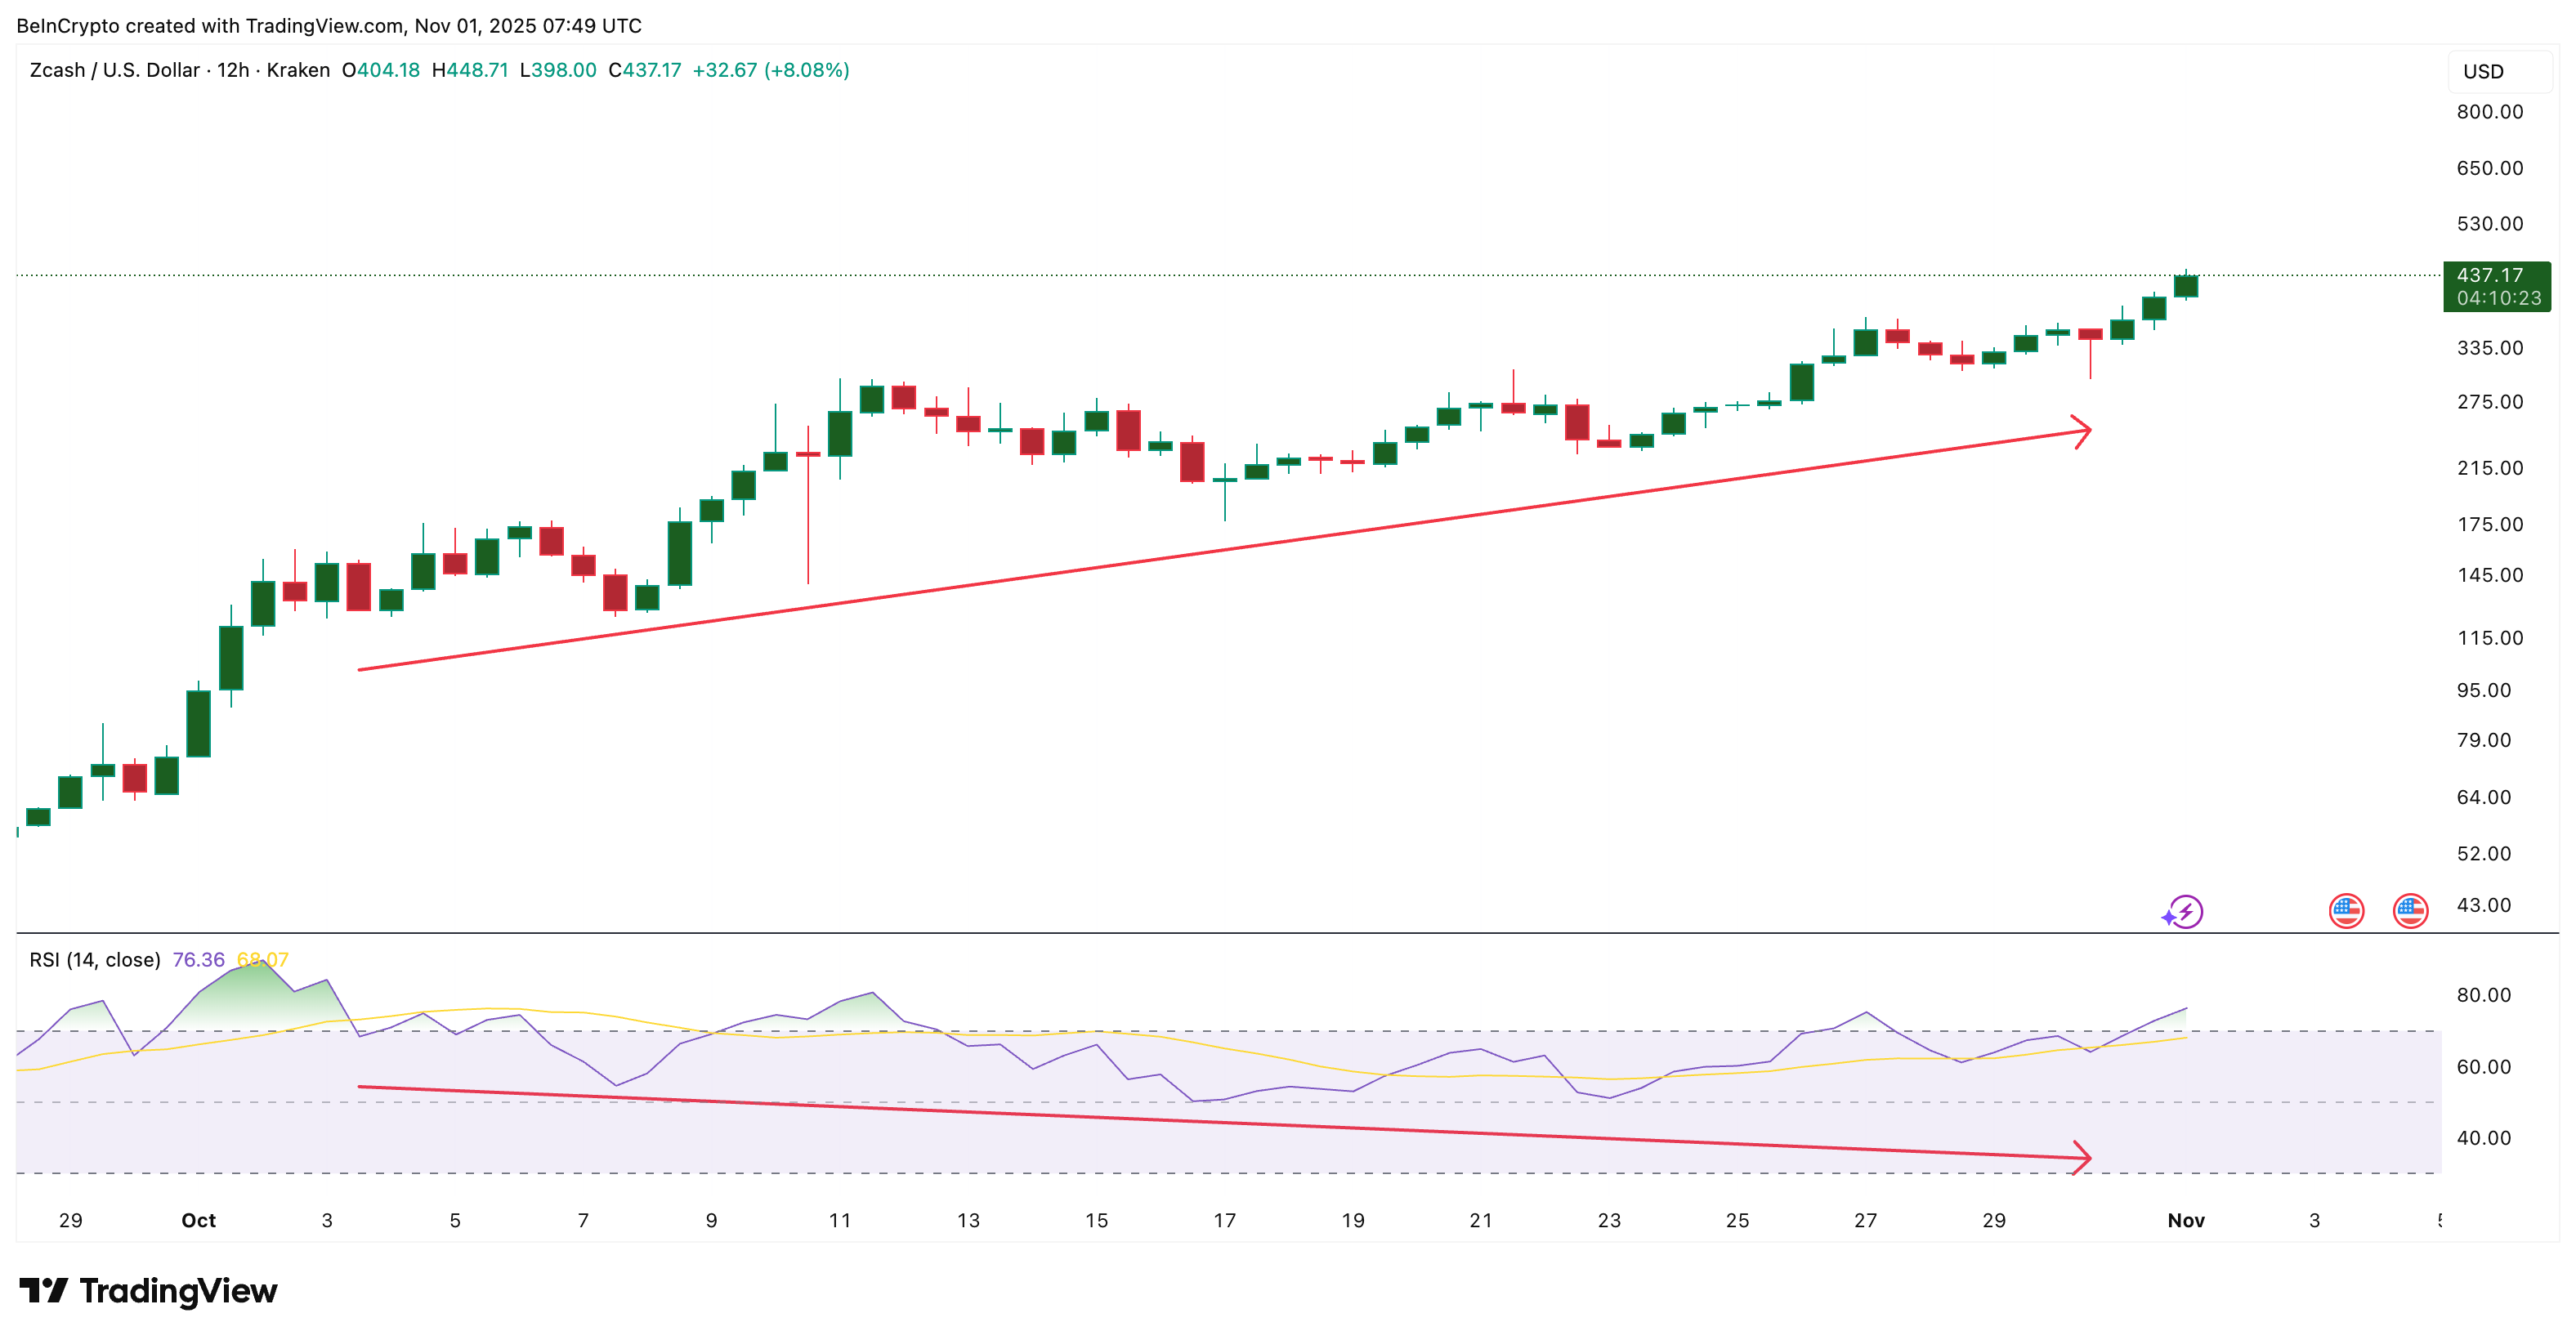
Between October 3 and October 30, ZEC’s price formed a higher low, while the Relative Strength Index (RSI) — a tool that tracks buying and selling strength — created a lower low.
This is known as a hidden bullish divergence, which often signals that an ongoing uptrend is likely to continue.
Want more token insights like this? Sign up for Editor Harsh Notariya’s Daily Crypto Newsletter here.
Zcash’s RSI remains above 70, showing strong buyer control despite short phases of profit-taking. The pattern suggests traders are re-entering rather than exiting, keeping the trend intact. Yet, a growing RSI number could eventually lead to a pullback-like scenario for Zcash.
Backing this overall bullishness, the Chaikin Money Flow (CMF) — which measures big money entering or leaving the market — remains positive.
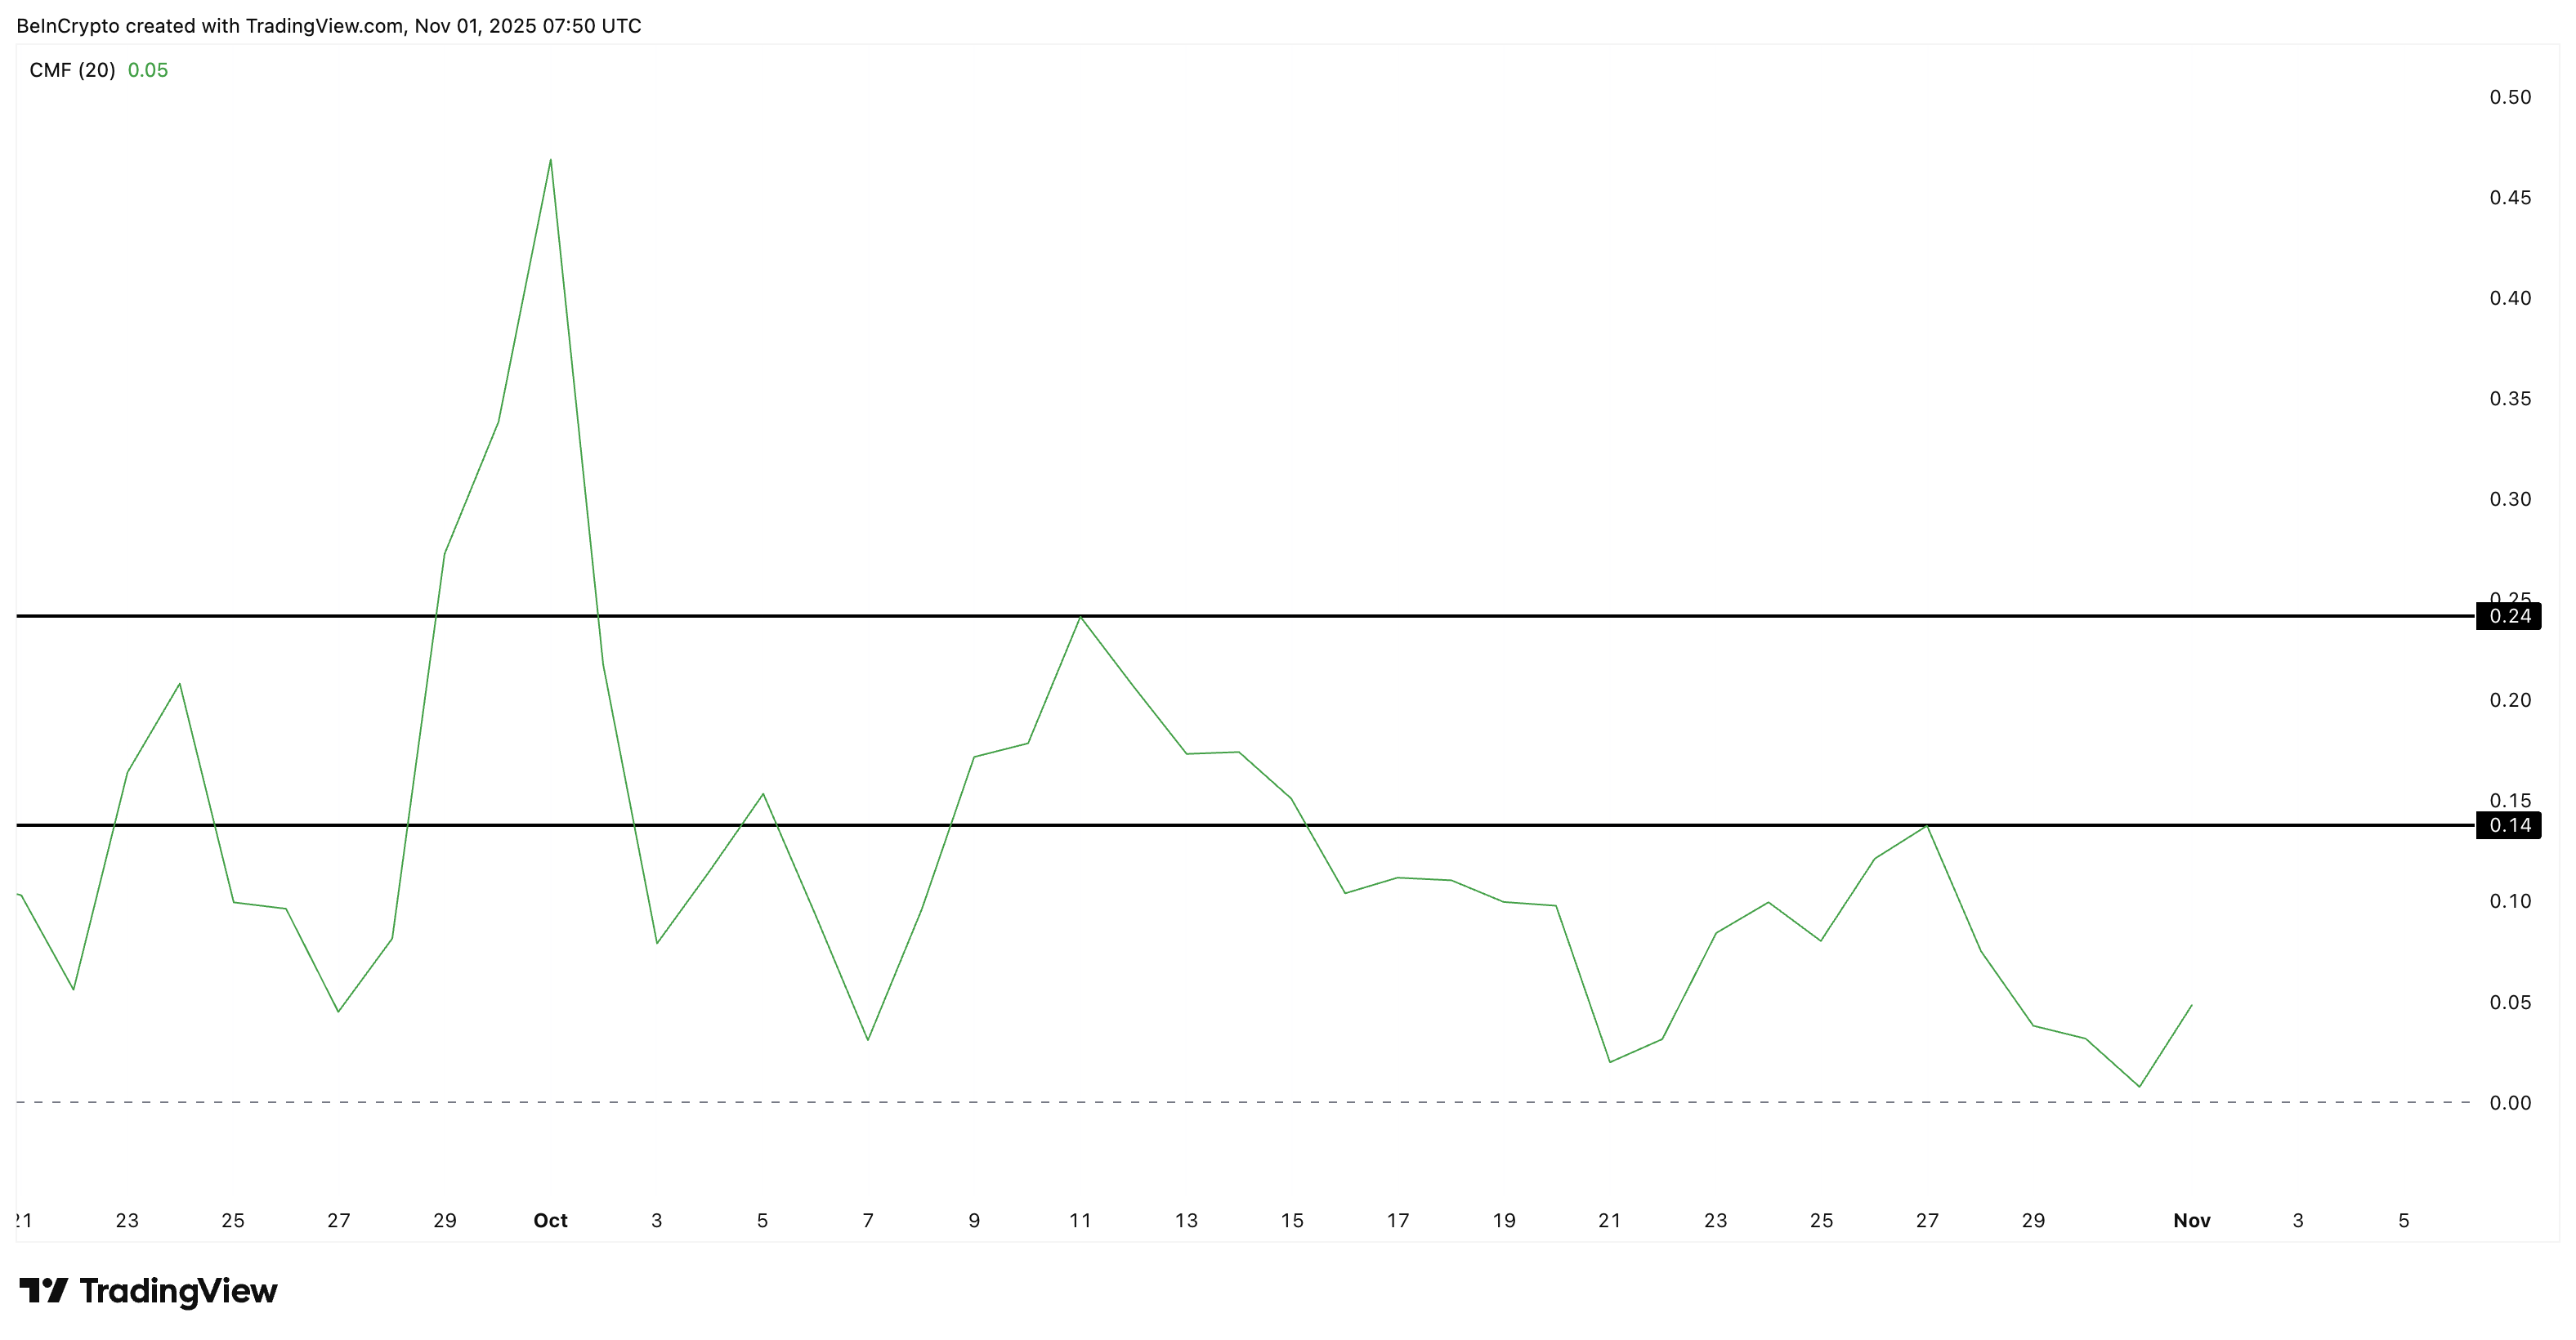
ZEC’s CMF hasn’t dipped below zero for weeks and currently sits around 0.05, showing steady inflows. If it climbs above 0.14 and pushes toward 0.24, it could trigger another wave of buying, potentially driving bigger gains in the near term.
It is worth noting that while large money flows exited ZEC towards the end of October, it never actually dropped under zero.
And the metric has already curled up on the first day of November, hinting at growing whale conviction.
Long Leverage Builds Confidence — and Risk
The bullish setup has attracted leveraged traders to record levels. According to Bybit’s liquidation map, total long leverage in ZEC/USDT pairs is about $32.45 million, while short leverage sits at $1.04 million — nearly 30 times lower.
The recent 24-hour rally may have already liquidated several shorts.
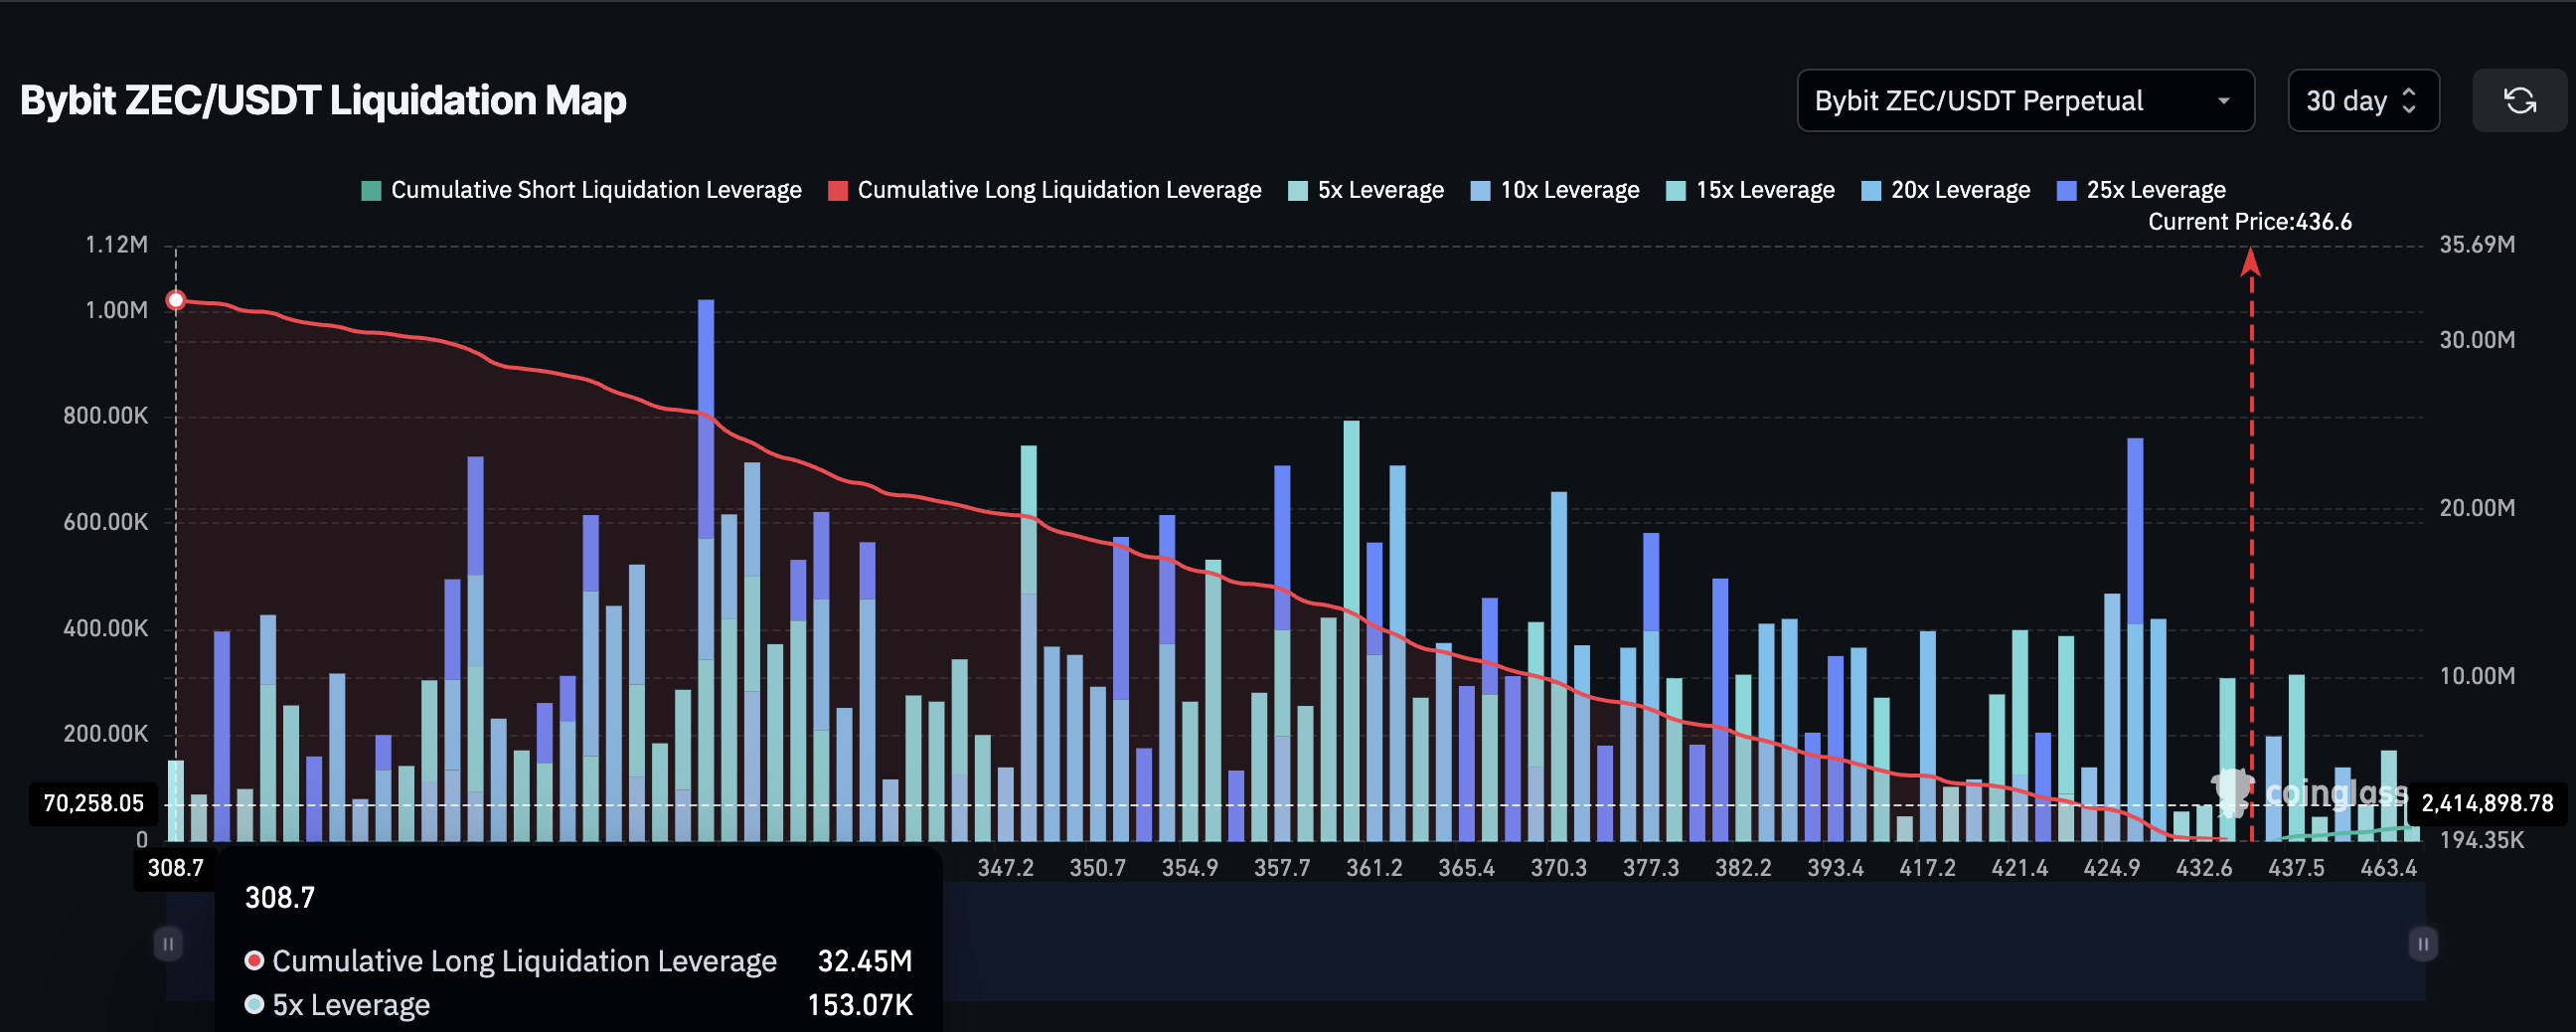
This also means most traders are betting on continued upside, but it also creates a fragile balance. If the Zcash price falls even slightly, overleveraged long positions could be liquidated rapidly, forcing additional selling pressure.
That makes $342 and $312 the most important short-term support levels, which we will see later. A drop below $312 could start a cascade of liquidations.
ZEC Price Prediction: Can the Rally Breach $1,500?
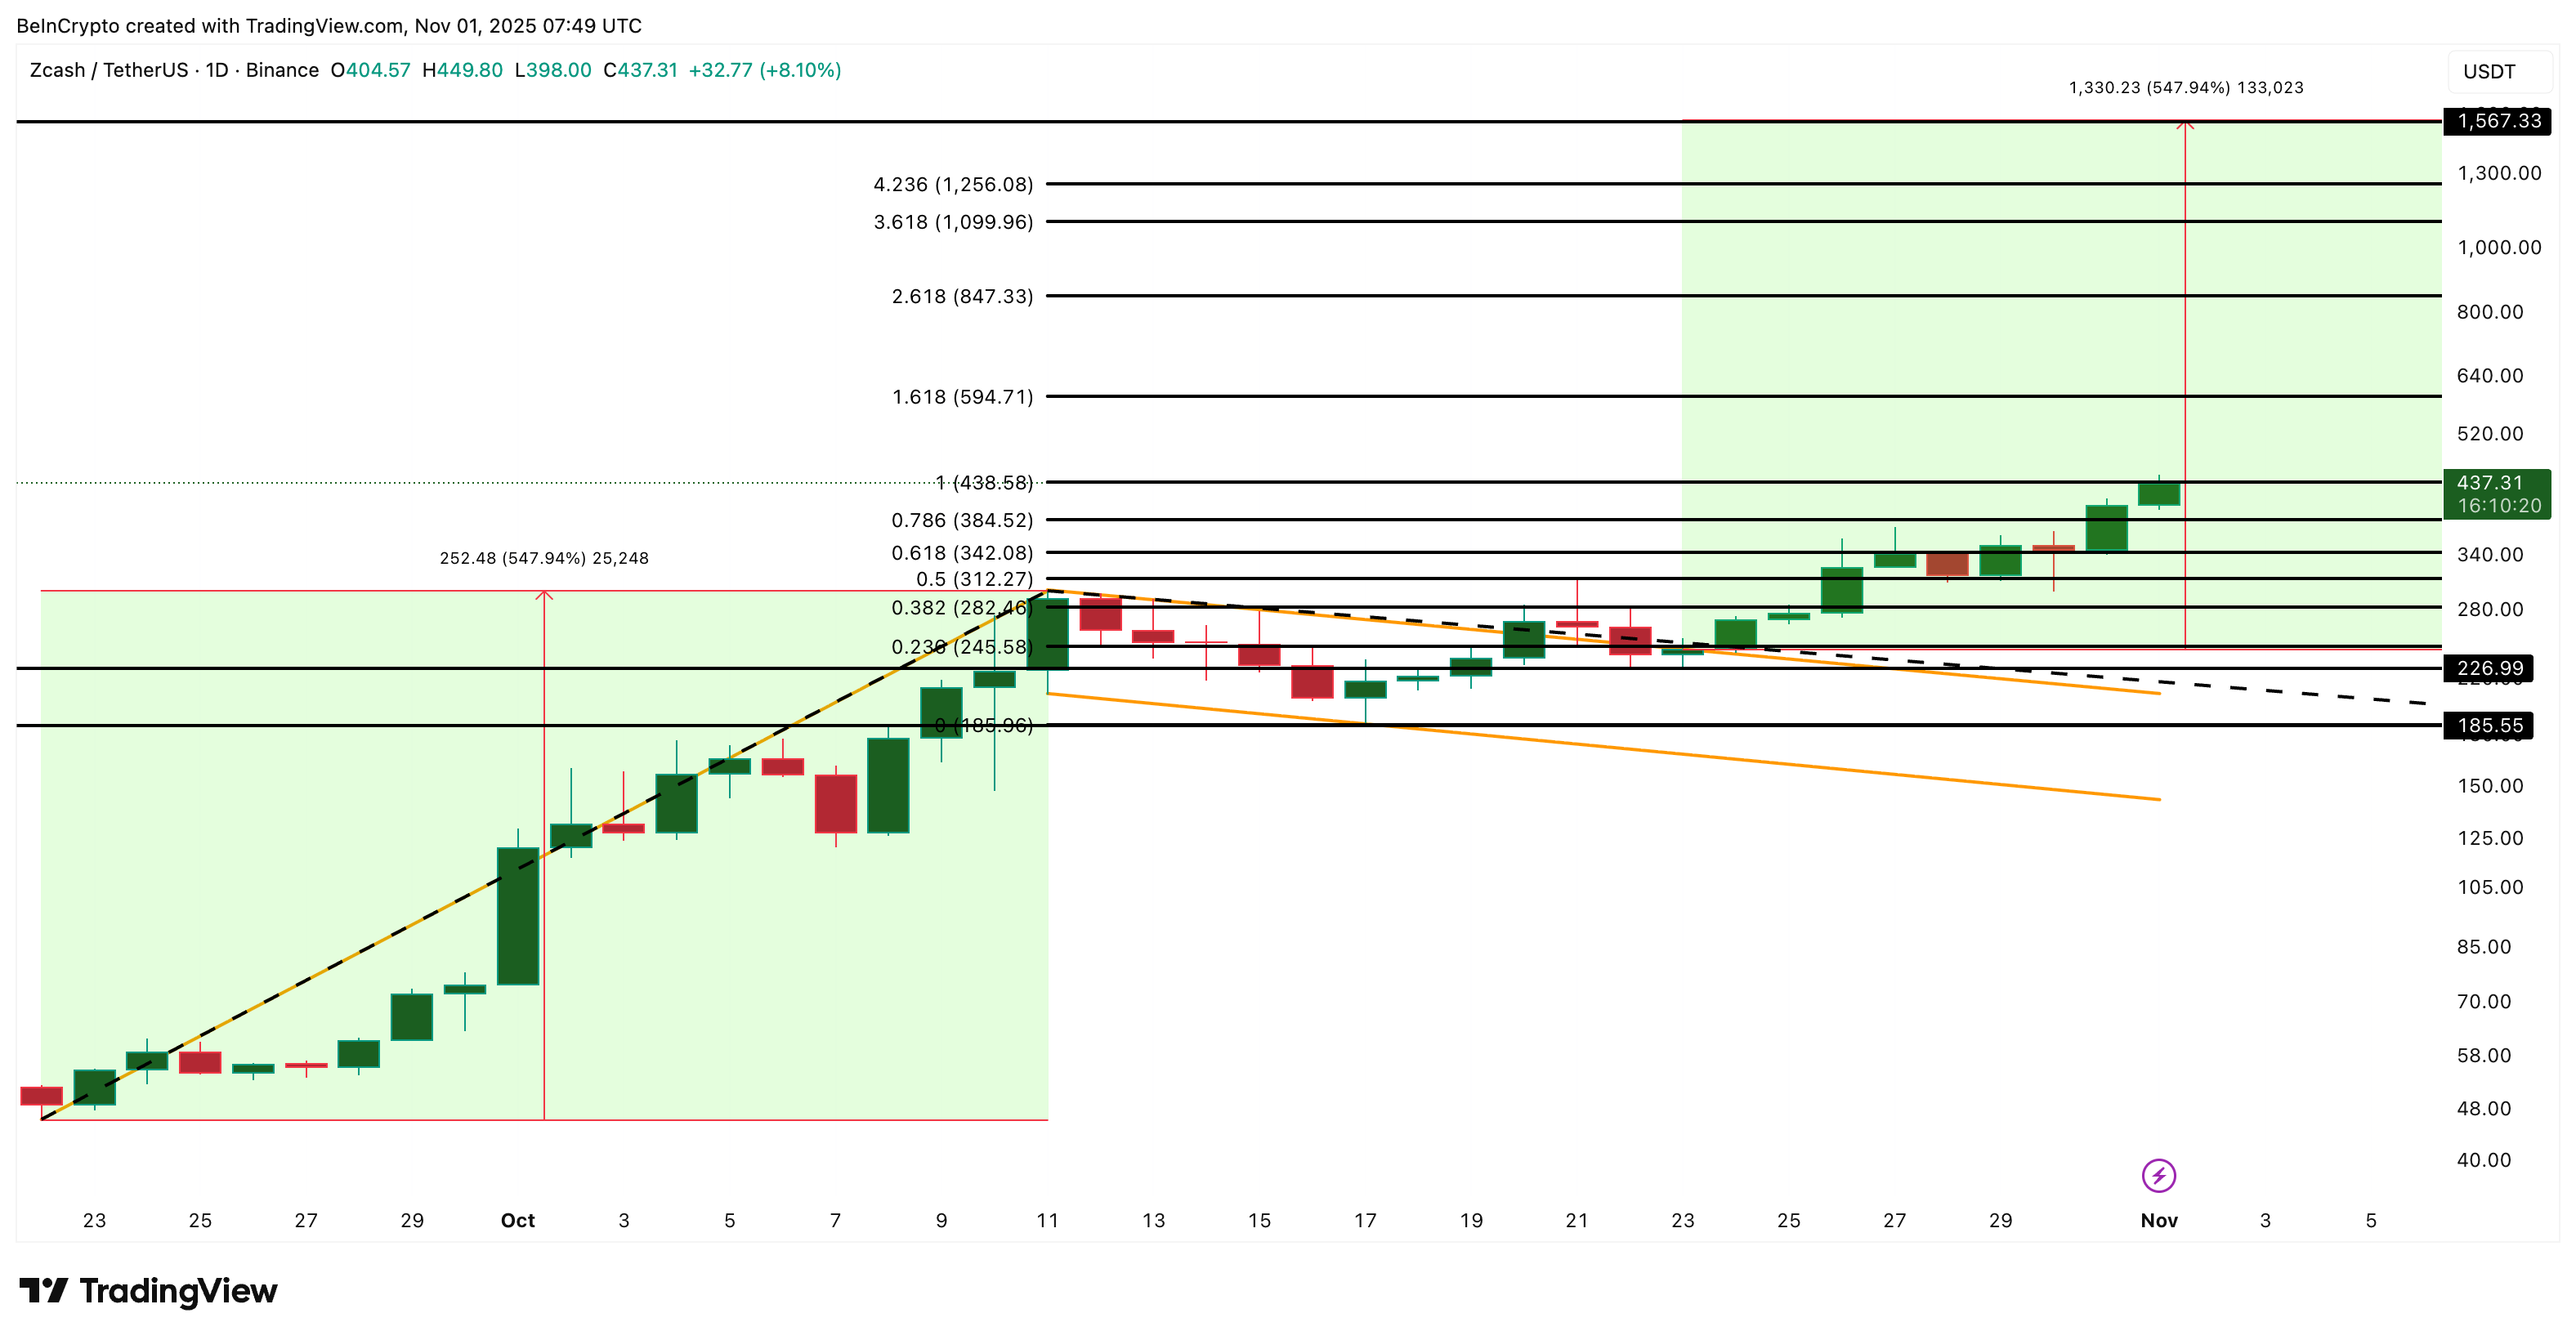
The Zcash price continues to trade within a flag-and-pole breakout pattern, as predicted earlier. It is a structure that often precedes large upward extensions.
The breakout above $438 confirmed the continuation of this move, and the next Fibonacci targets sit at $594, $847, and $1,256.
The full projection of the flag’s pole points toward a long-term target of $1,567 — or roughly a 250% upside from current levels near $437.
However, Zcash’s sharp rise also means volatility will remain high. The combination of a bullish structure, strong money inflows, and excessive leverage makes this run both promising and risky.
For now, the uptrend holds — but traders must watch $312 closely, as losing that level could quickly flip the narrative. Breaching this level would liquidate all existing long positions, as per the liquidation map shared earlier.
However, as long as the ZEC price stays above $342 (the 0.618 fib level, every move down would look like a healthy pullback.
If ZEC loses $245, the rally would weaken. And a break below $185 would cause the entire bullish structure to collapse.
