


Yearn.Finance (YFI) has broken out from a descending resistance line. It followed this up by reclaiming an important horizontal resistance level.
YFI is expected to continue increasing toward a new all-time high.
YFI Breakout
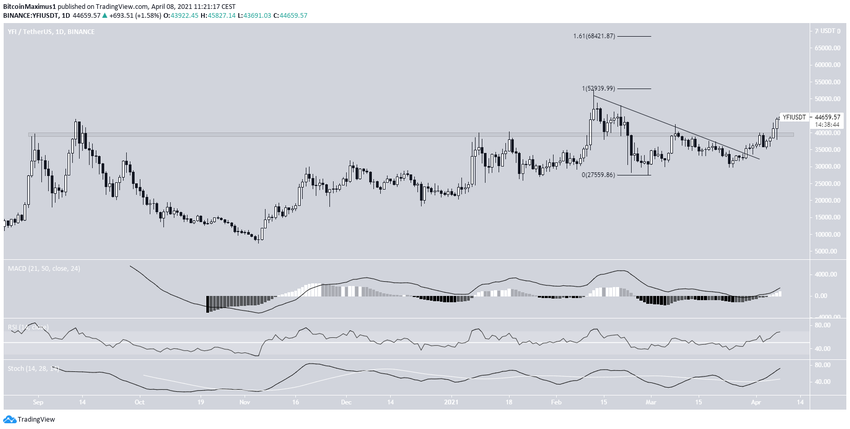
YFI had been moving downwards since reaching an all-time high price of $52,880 on Feb. 12. Throughout the decrease, it followed a descending resistance line.
After five unsuccessful attempts at breaking out, YFI finally managed to move above this line on March 29. Shortly after, it also reclaimed the $40,000 resistance area. This is a strong bullish development. Therefore, it indicates that the price is expected to move even higher.
If so, the next resistance levels are found at:
- $52,900 — all-time high resistance
- $68,400 — the 1.61 external fib retracement
Technical indicators are bullish and support further upward movement. The Stochastic oscillator has just made a bullish cross and both the RSI and MACD are increasing.
Short-Term Movement
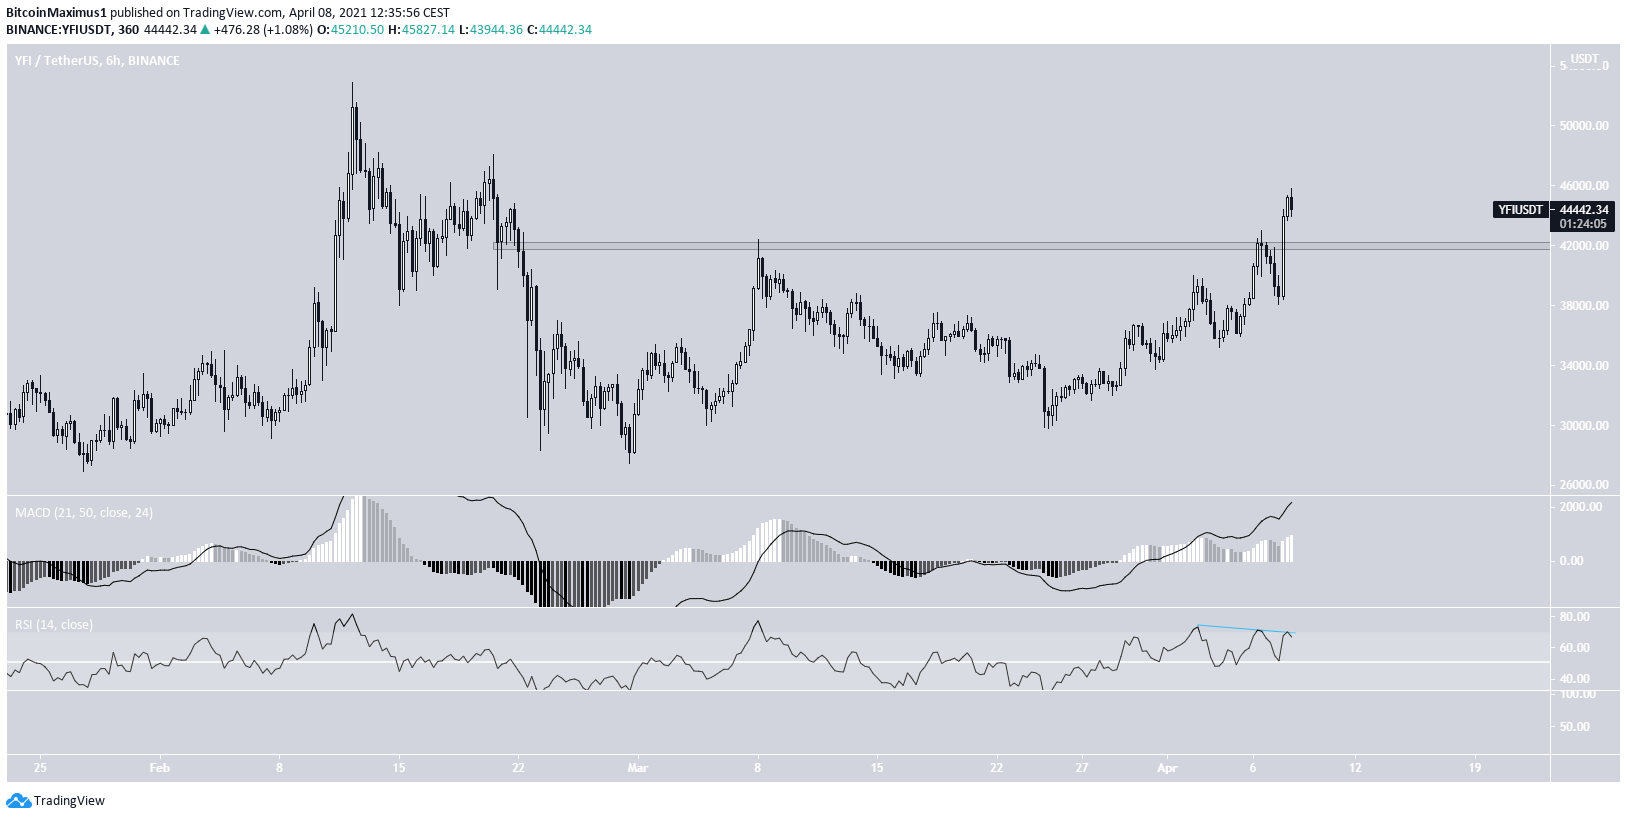
The six-hour chart is also bullish. It shows a breakout and subsequent reclamation of the minor $42,000 resistance area.
It could drop once more in order to validate this level as support. However, the trend is considered bullish as long as it is trading above it.
YFI/BTC
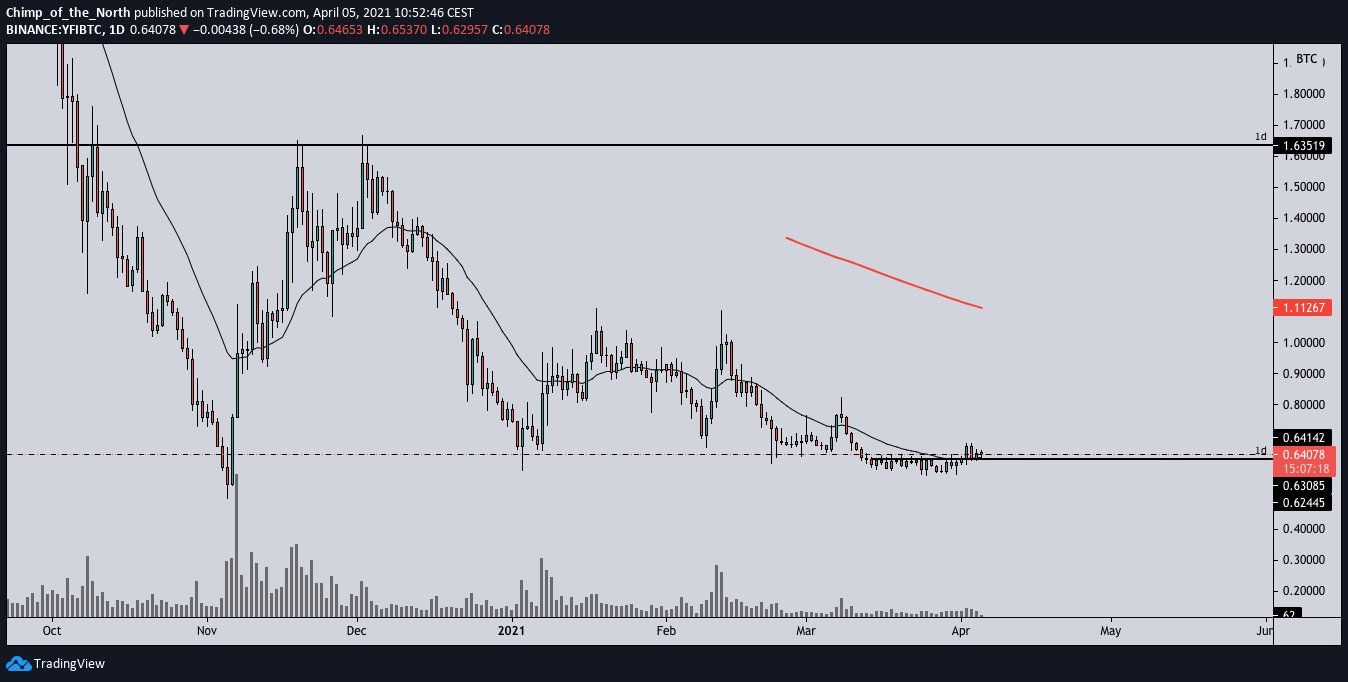
Cryptocurrency trader @Cryptochimpanz outlined a YFI/BTC chart and stated that despite being near its all-time lows, the pair is likely to move upwards.
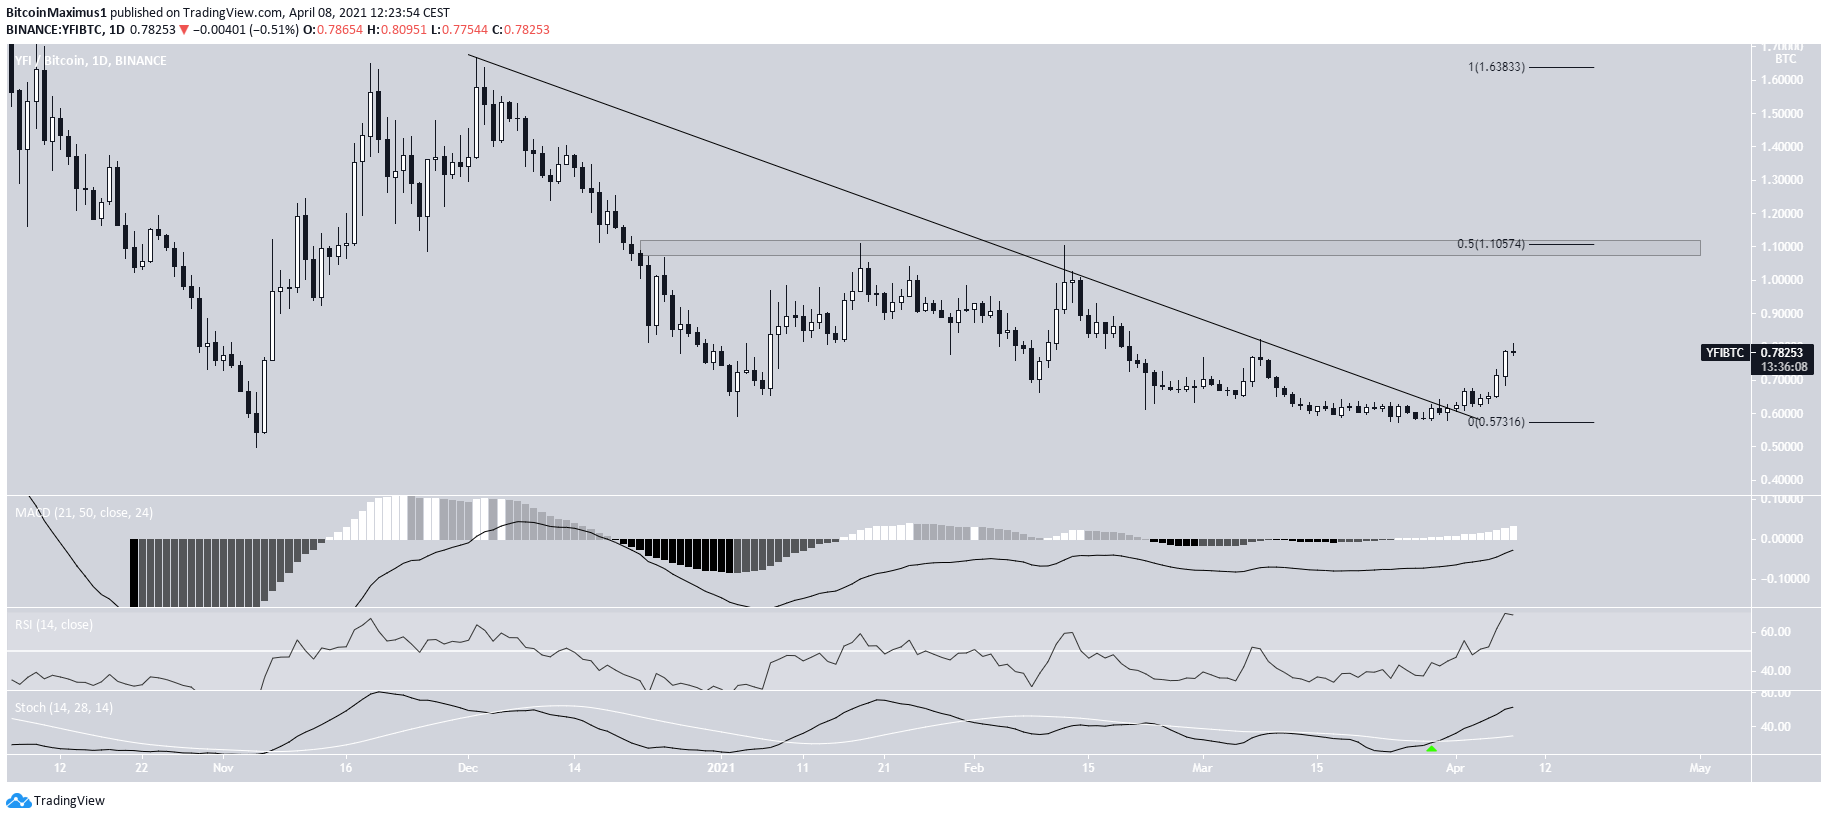
YFI/BTC has broken out from a descending resistance line. Similar to its USD counterpart, technical indicators are bullish. This is especially evident by the bullish cross in the Stochastic oscillator.
Its upward movement is expected to continue increasing. If so, the next closest resistance area would be found at ₿1.10. This is the 0.5 Fib retracement of the most recent downward movement. In addition, it is a long horizontal resistance area.
Conclusion
A breakout above resistance levels on both the YFI/USD and YFI/BTC charts suggests that their trends are bullish.
Both are expected to increase toward their next closest resistance levels.
For BeInCrypto’s latest bitcoin (BTC) analysis, click here.



