


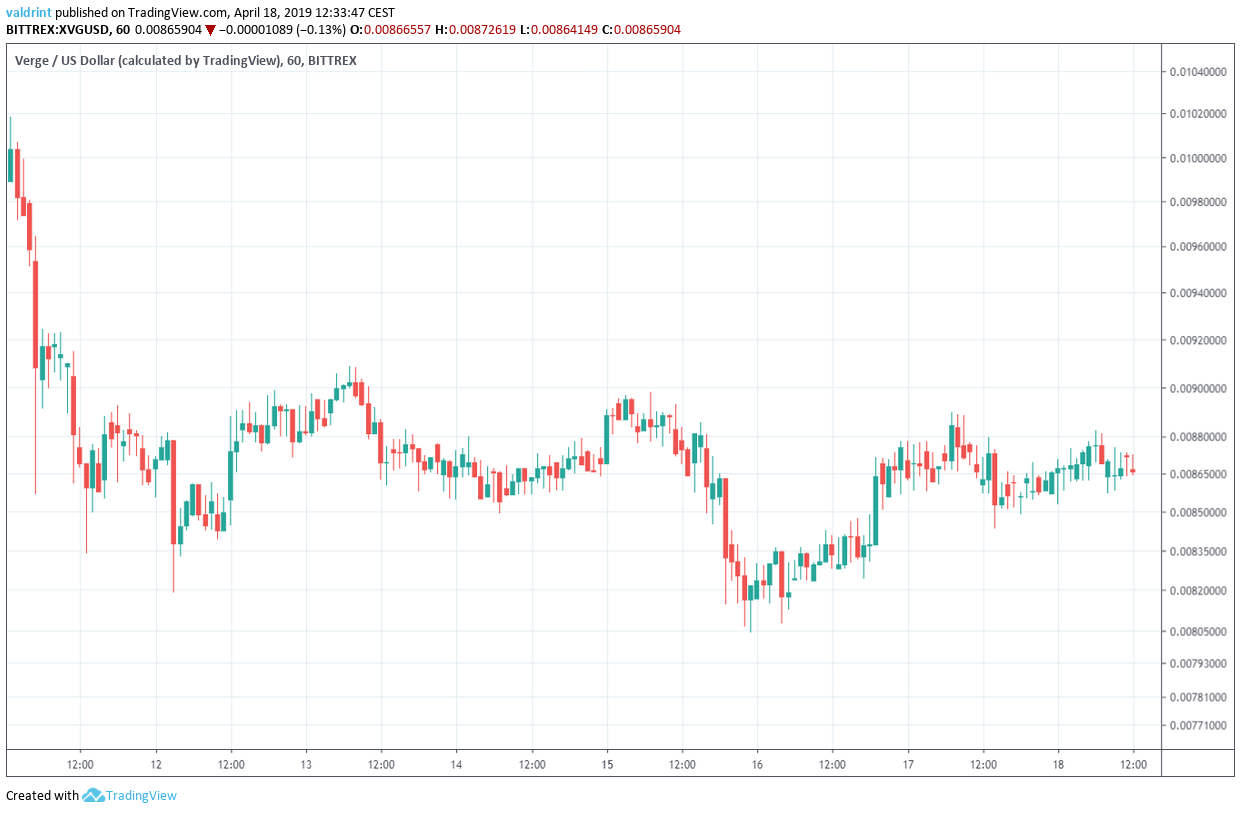
On Apr 11 2019, the price of XVG reached a high of $0.010. A sharp decrease ensued. The was followed by a gradual increase.
The price reached a low of $0.008 on Apr 15 and has been gradually increasing since.
Will the price of Verge keep going up or will a reversal bring lower lows?
Let’s find out:
Verge (XVG): Highlights for April 18, 2019
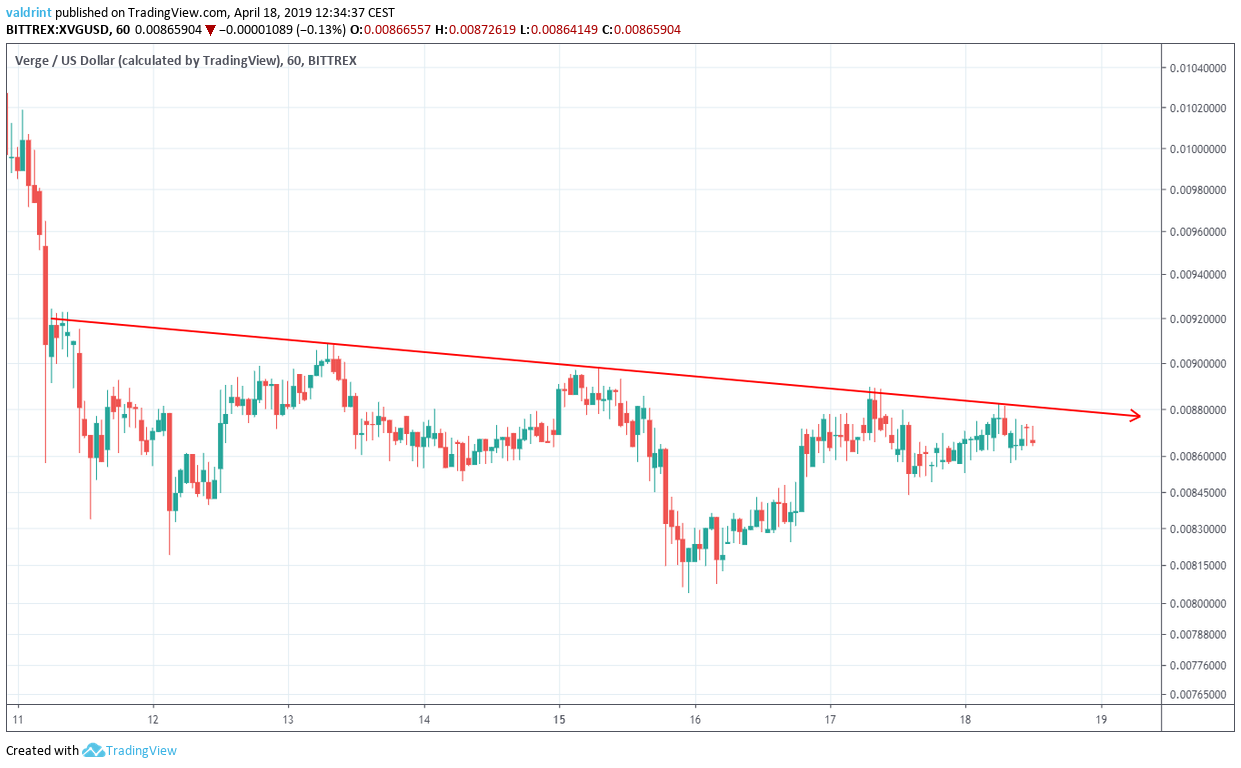
- The price of XVG has been on a downtrend since Apr 11.
- It is trading inside a descending channel.
- Bearish divergence is developing in the RSI and the MACD.
- There is resistance near $0.0096.
Current Trading Pattern
On Apr 11, the price reached a hourly high of $0.0092. Several market cycles have been completed, each time the price has reached lower highs.
Tracing these highs gives us a descending resistance line:
In addition. Verge reached a low of $0.0083 on Apr 11. This low was followed by a sharp increase. However, prices subsequently fell.
Lower lows experienced during this time are traced by a descending support line the graph below. Together, the support and resistance lines combine to create a descending channel:
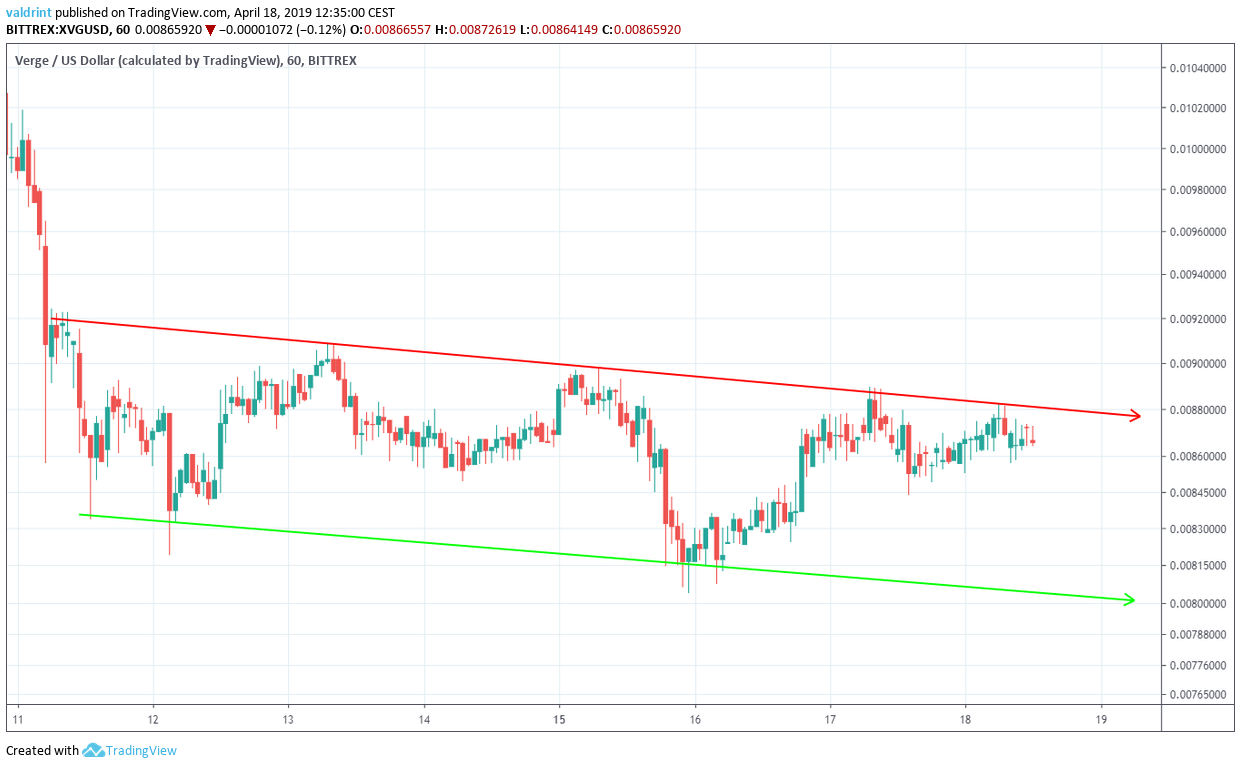
It is likely that the price will keep trading inside the confines of this channel until a decisive move occurs.
In order to predict the direction of the move, we need to take a look at some technical indicators.
Technical Indicators
We begin with the MACD and RSI.
The relative strength index (RSI) is an indicator which calculates the size of the changes in price in order to determine oversold or overbought conditions in the market.
Both of these are shown in the chart below:
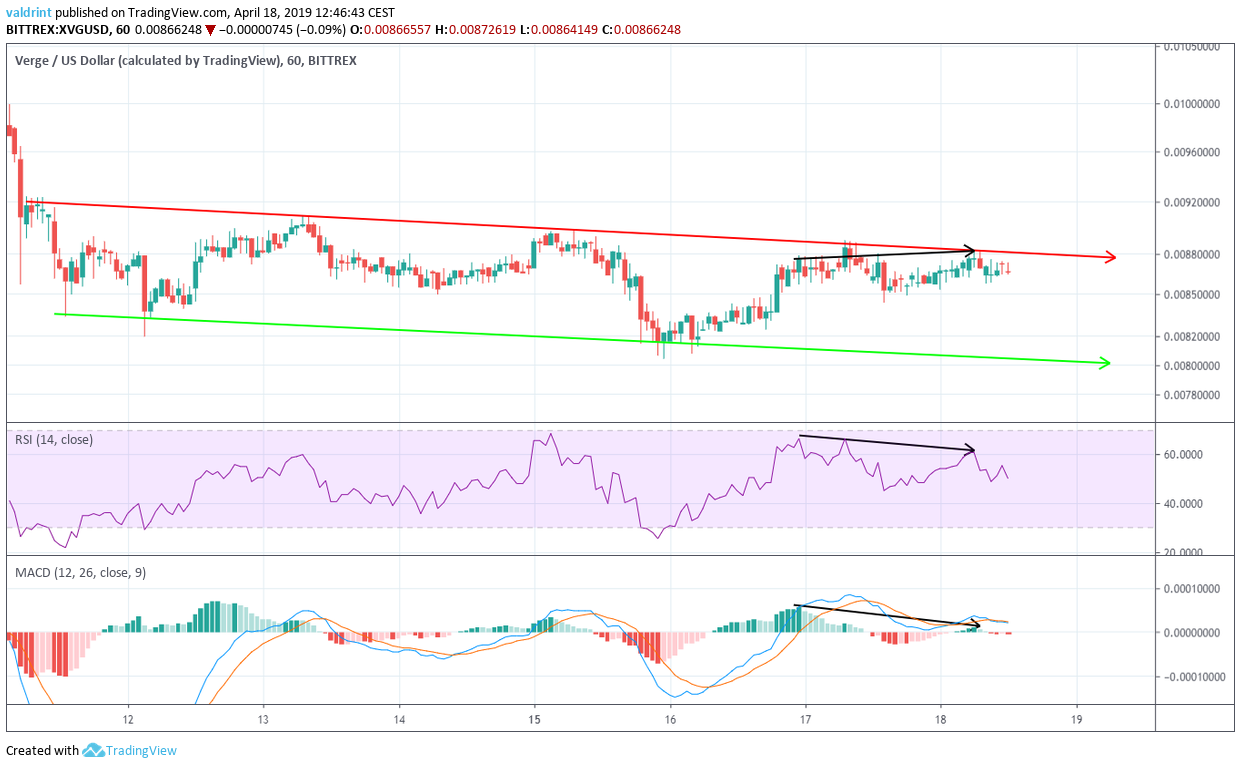
Similarly, the RSI and the MACD made the first high on Apr 16. However, they have continued to generate lower values since.
This is known as bearish divergence and often precedes price decreases.
The use of these indicators suggests that the price will eventually drop towards the support line of the channel.
However, it is possible that a sharp move occurs. If it does, where will price begin a reversal?
Reversal Areas
To determine the actual possible future price levels, we incorporate resistance areas into the analysis.
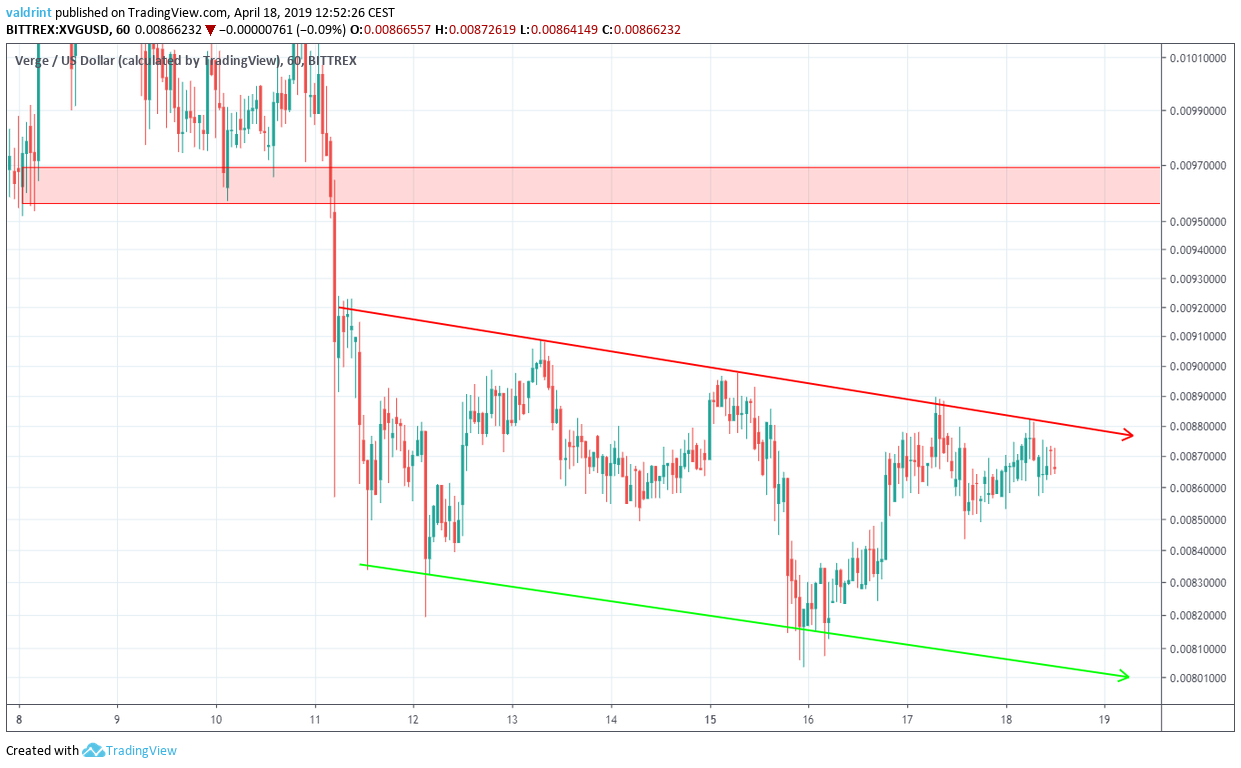
The closest resistance area is found near $0.0096. If the price breaks out of the channel it is likely to reach this area. We do not believe this will occur in the short-term.
Summary of Analysis
Based on this analysis, the price of XVG is likely to drop towards the support line of the channel. We cannot confidently predict a breakout or a breakdown.
Do you think the price of XVG will break out from the channel? Let us know in the comments.
Interested in 2019, 2020, and 5 year Bitcoin price predictions? Click on the green button below:
Disclaimer: This article is not trading advice and should not be construed as such. Always consult a trained financial professional before investing in cryptocurrencies, as the market is particularly volatile.


