
Tezos (XTZ) is not yet listed on most major exchanges. Furthermore, the USD/XTZ pair is not available on Tradingview. For this reason, we used the BTC/XTZ pair during this price analysis.
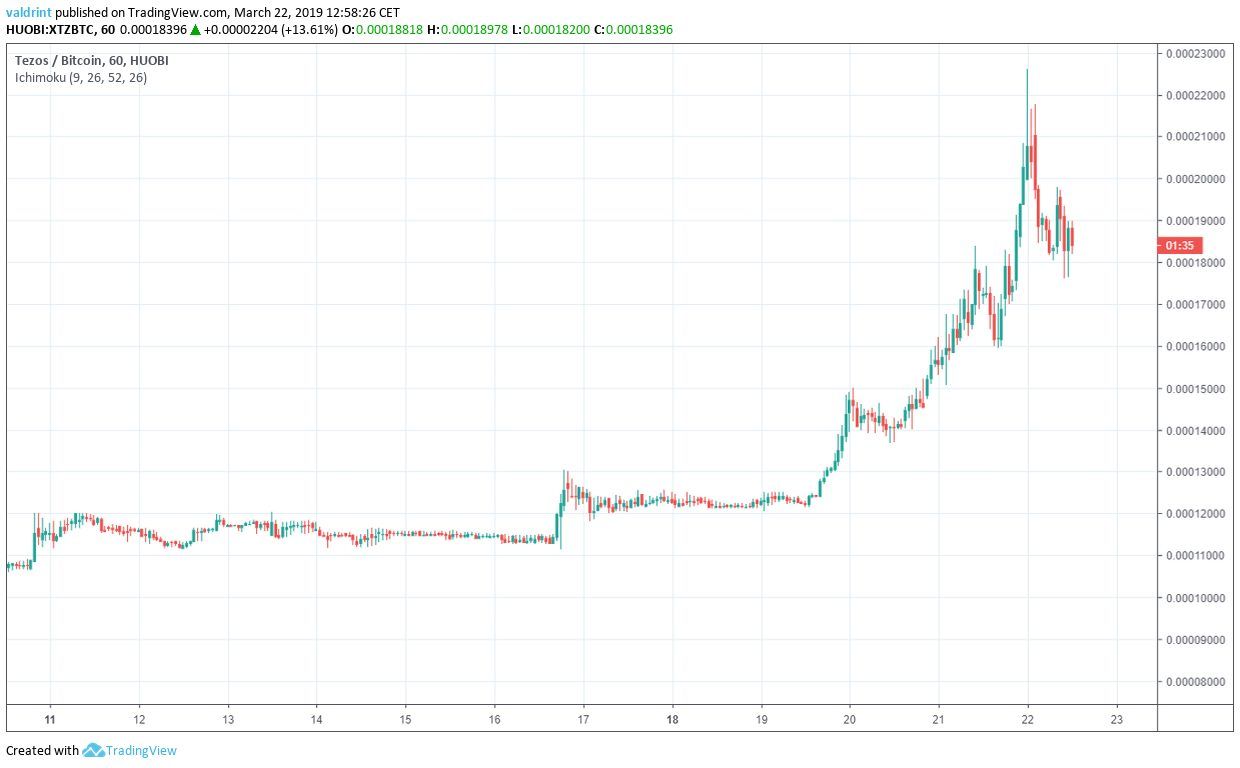
The price of Tezos (XTZ) made a low of BTC(₿)0.000103 on Mar 10. Since then, Tezos has seen significant price increases with a high of ₿0.000225 reached on Mar 22.
Will the price of XTZ keep going up? Or is this just another cryptocurrency fad that will quickly be forgotten?
According to today’s analysis, we predict that the price of XTZ is likely to make a top in the near future and before beginning a significant reversal.
Tezos (XTZ): Trends and Highlights for March 22, 2019
- The price of Tezos has been on an uptrend since Mar 11.
- The uptrend accelerated its rate of growth on Mar 16.
- A second acceleration commenced on Mar 19.
- There are support areas at ₿0.000160, ₿0.000140 and ₿0.000127.
- There is resistance near ₿0.000266.
Ascending Support
The price made a low of ₿0.000106 on Mar 10. A rapid upward ensued followed by a gradual decrease. The price made a higher low of ₿0.00011 on Mar 16.
Tracing these lows gives us an ascending support line.
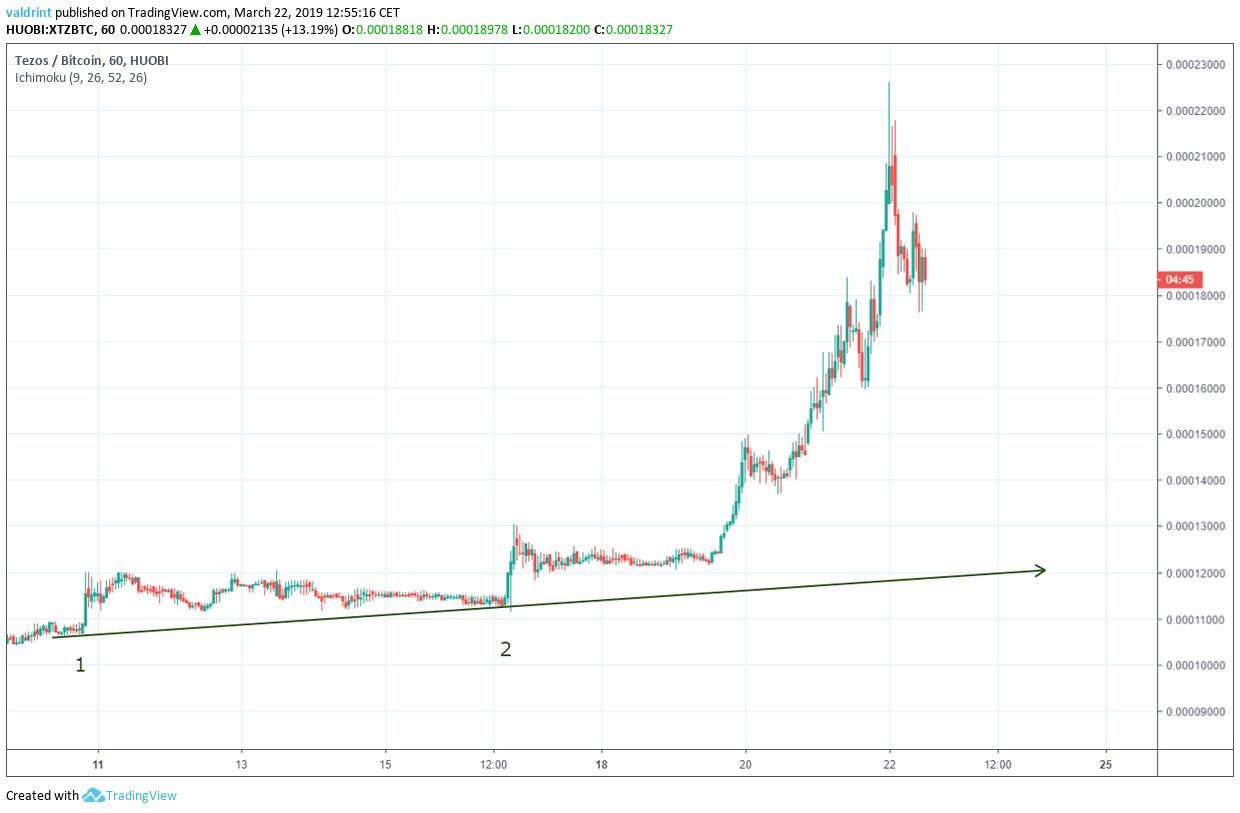
The support line can act as a floor to price, preventing further downward movement. It theoretically traces the lower limits of the price while also measuring the rate of increase.
Price initially increased at the same rate as predicted by the line, before accelerating on Mar 16. Since that time, the support has ceased to be an accurate indicator of future price fluctuations.
Accelerating Rate of Increase
The price made a low of ₿0.00011 on Mar 16. A rapid upward move followed by a gradual decrease which led to a lower high of ₿0.0001215 on Mar 19
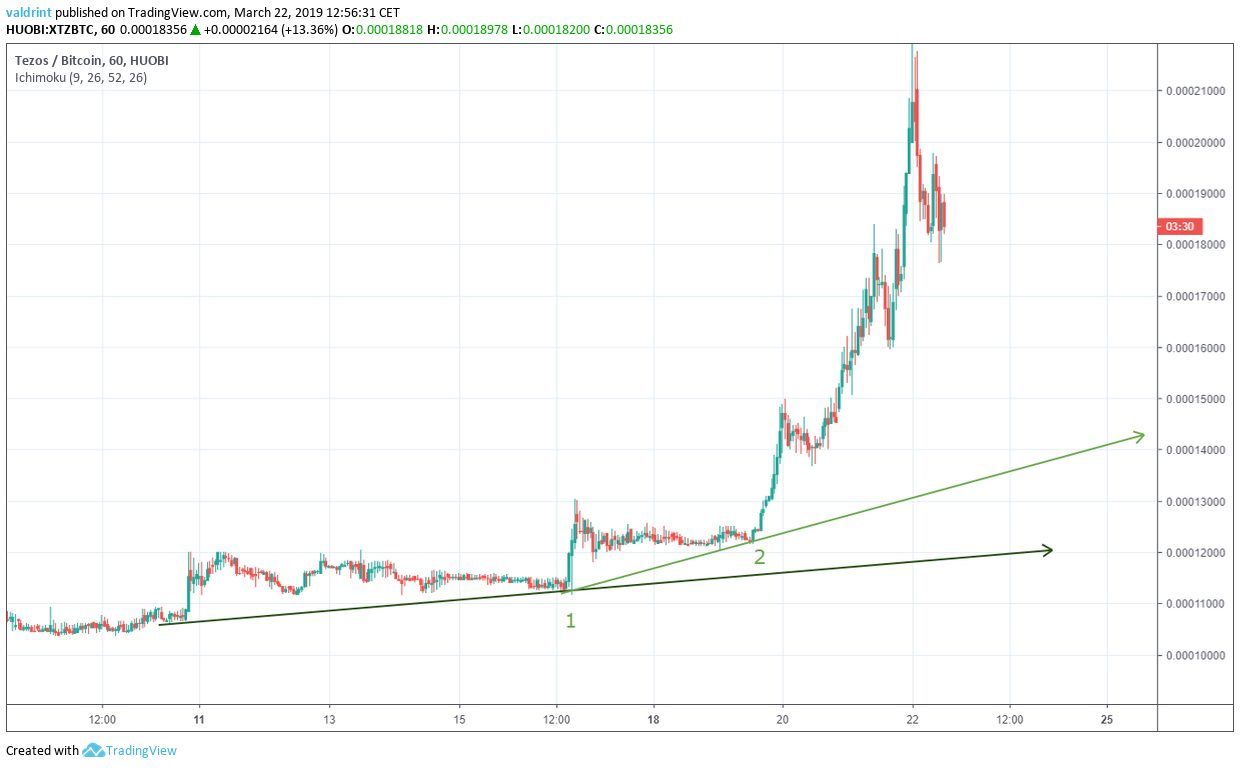
While this new support does indicate that a new trend has emerged, it is also inaccurate. It gauges the trend following the first incidence of accelerating price increase. However, a second acceleration followed a few days later.
This invalidates the current accuracy of the second support.
Rate of Increase Becomes Parabolic
The price made a low of ₿0.0001215 on Mar 19. Several rapid upward moves followed, with each low being higher than the previous one.
Tracing these lows gives us an ascending support line.
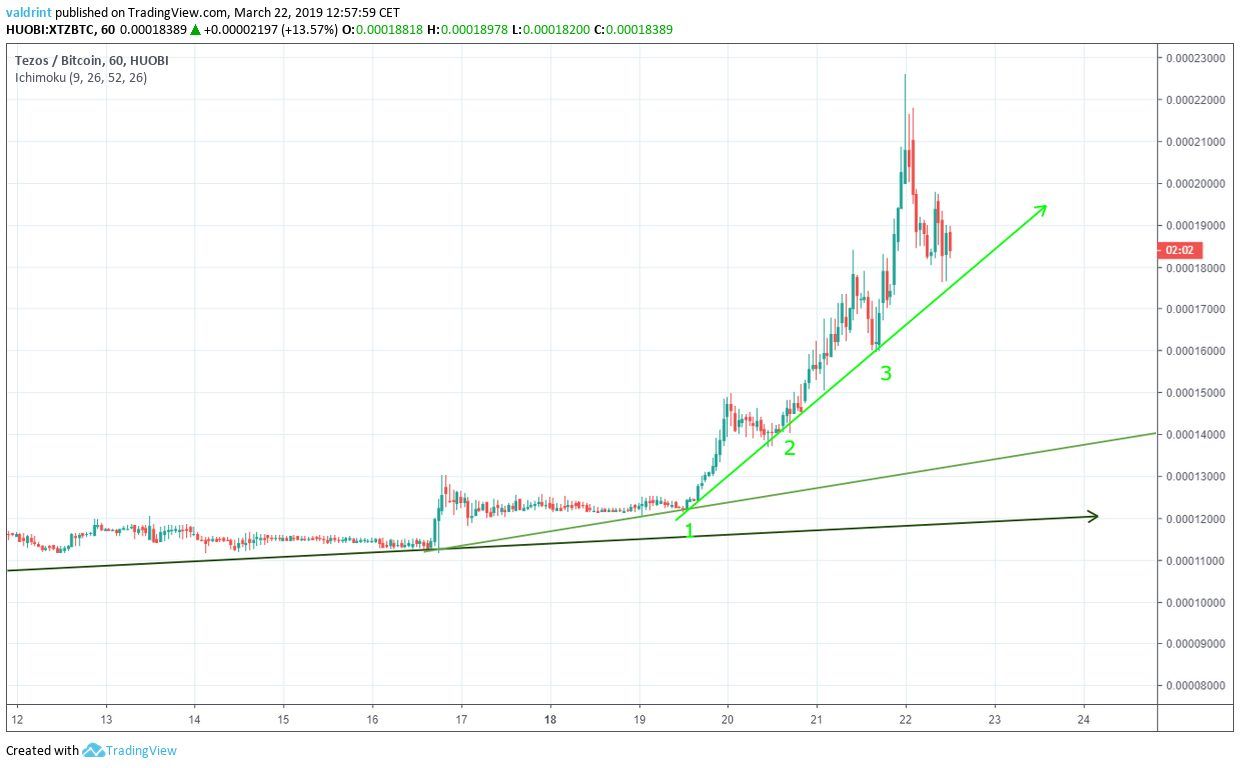
At the current time, this third support appears the most accurate indicator of future price fluctuations. It shows a steady price increases at rates greater than those suggested by the earlier two lines. Furthermore, the rate of increase currently appears to be following the most recent support very closely.
In other words, since Mar 19, the price of XTZ has increased at the same rate as predicted by the third line (in green). Because two other accelerations have so far occurred, a third acceleration appears possible in the near future. However, increases can only accelerate for so long before an inevitable breakdown.
Possible Top
To better determine future possible prices, we examine TXZ from Mar 19-22 using technical indicators.
The relative strength index (RSI) is an indicator which calculates the size of the changes in price in order to determine oversold or overbought conditions in the market.
Combining RSI bullish/bearish divergence with support/resistance essentially predicts price fluctuations.
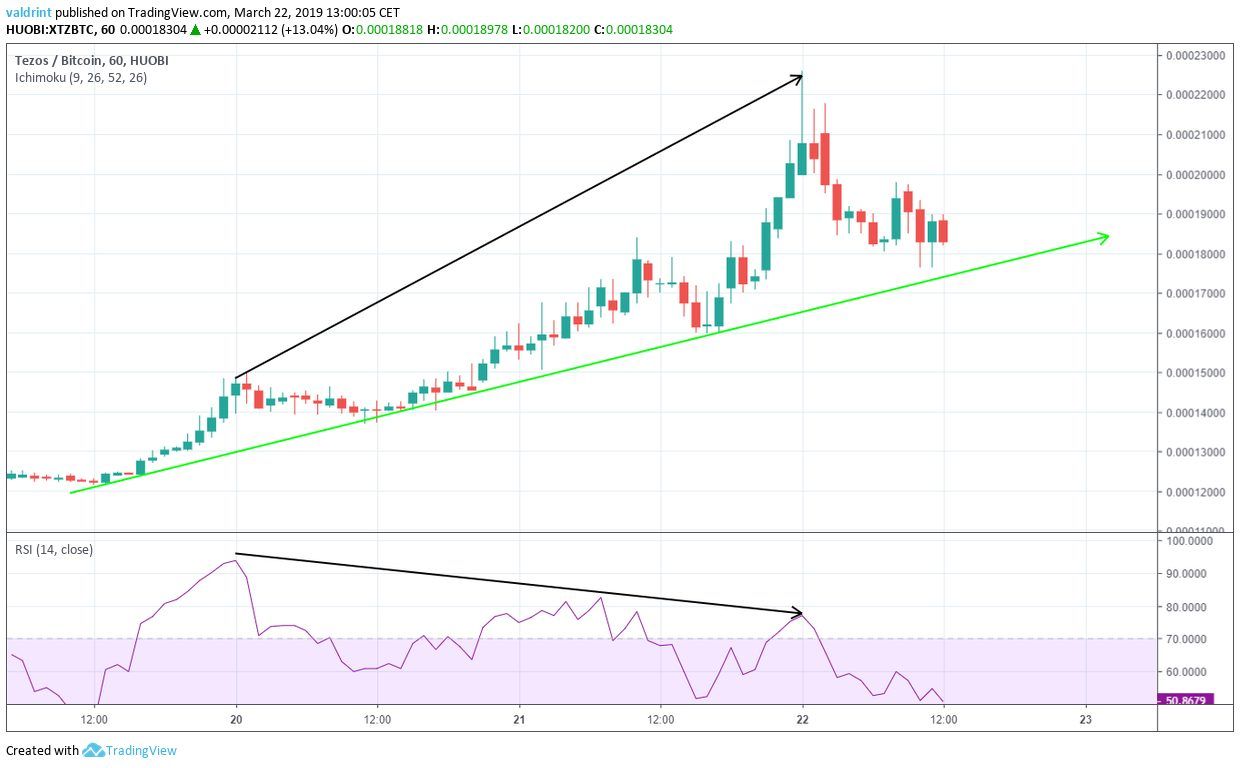
The price made a high of ₿0.000149 on Mar 20. It has been increasing since. The RSI made a high of 92 on Mar 20. However, it has continued to generate lower values since.
This is known as bearish divergence and often precedes decreases in price.
It is especially effective if bearish divergence occurs in a bearish pattern. Tezos, however, is not in a bearish pattern.
Price decreases are not certain but these indicators combined with the continually accelerating price increases does suggest an impending reversal. However, the indicators alone do not conclusively determine this.
On the contrary, the price of XTZ could either accelerate a third time or consolidate. Based on the data analyzed so far, it is difficult to determine which is more likely.
Support Areas
Support and resistance areas are created when the price revisits the same level several times.
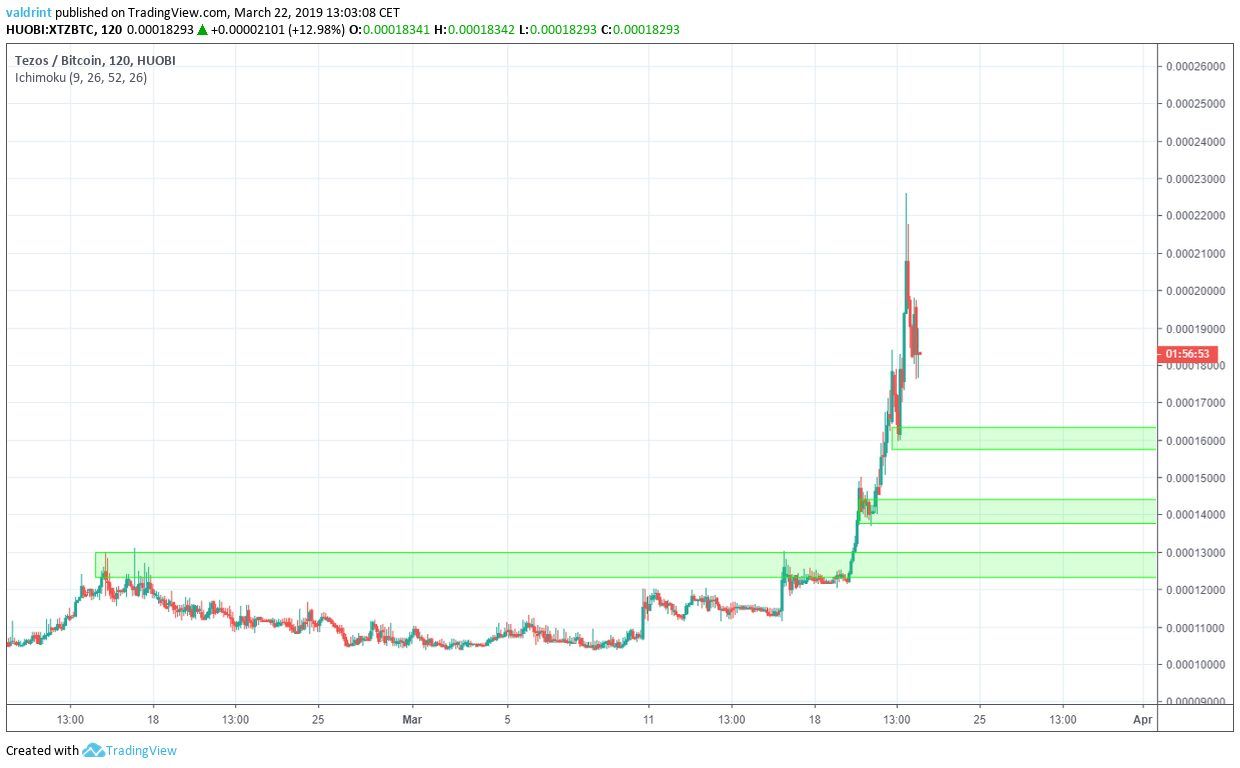
The first support area is found near ₿0.000160, followed by support areas at 0.000140 and 0.000127. If the price breaks down from the support line, these would provide likely reversal areas. Even if there is a third acceleration or maintained increases for a period, a breakdown still appears inevitable. When it occurs, we believe these prices may be reached.
A top may still have yet to be reached, however. To determine when this will be reached demands deeper analysis.
Resistance Areas
A Fibonacci retracement is a term used to refer to areas of support or resistance. Fibonacci retracement levels present horizontal lines that indicate possible resistance and support levels.
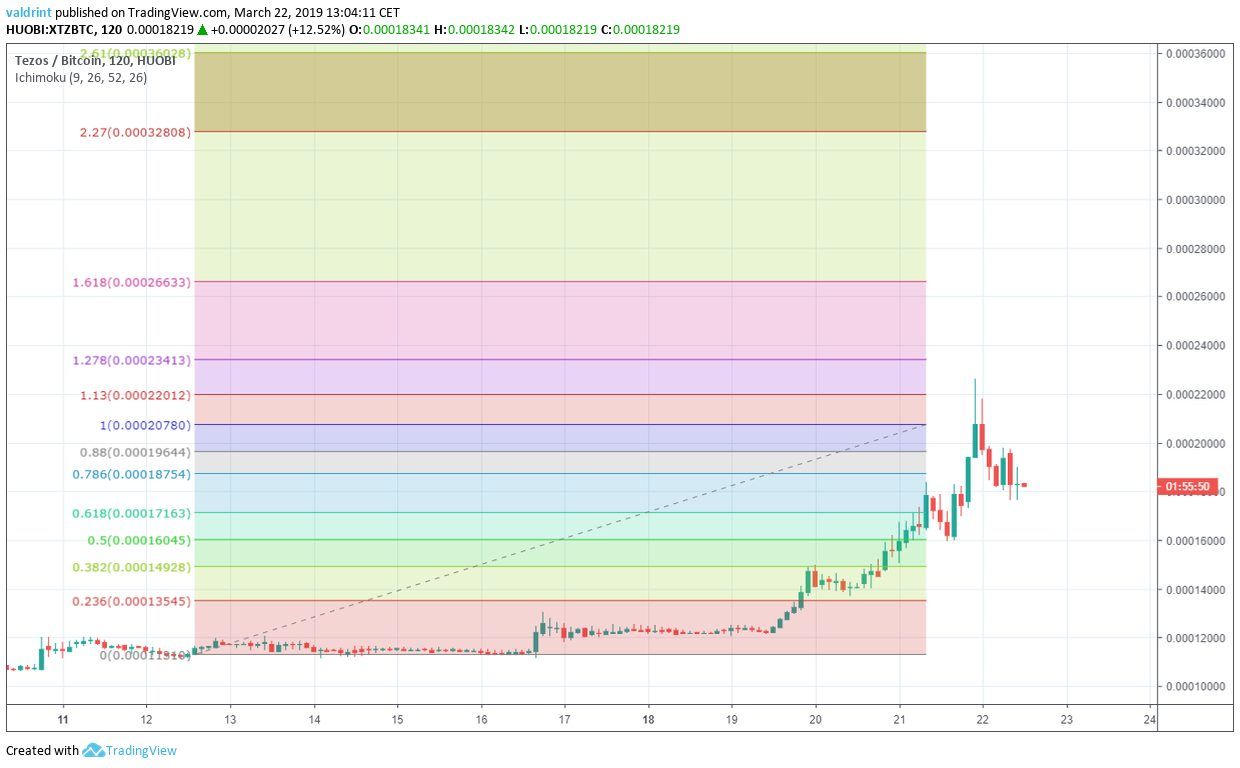
Price fluctuations for XTZ are measured from Dec 18, 2018 to Mar 19, 2019. Currently, the price is at an all-time high. It has broken out above all possible resistance areas.
Therefore, we are going to use Fibonacci retracement levels to try and predict where the price will make a top.
While not as accurate as resistance and support areas, Fibonacci retracement levels can be useful in predicting where an upward move will end.
The entire move was measured from the ₿0.00011 bottom to the ₿0.00207 closing price on Mar 22.
The most probable reversal area is found at the 1.618 fib level at ₿0.000266. If the price accelerates its growth again, it is likely that the price reaches this area.
Summary of Analysis
Based on this analysis, the upward move for XTZ is likely to end in the near future. If the price breaks down from the support line, this prediction will be partially validated. If it reaches the second support area before a breakdown, it will be fully validated. A breakout above 0.00024 would invalidate our prediction.
When do you think the upward move for XTZ will end? Let us know in the comments below
Disclaimer: This article is not trading advice and should not be construed as such. Always consult a trained financial professional before investing in cryptocurrencies, as the market is particularly volatile.
