
The Tezos (XTZ) price has been falling rapidly since the beginning of August and has just broken down from a neutral pattern.
The price should decline until it reaches the support levels outlined below.
Descent to Support
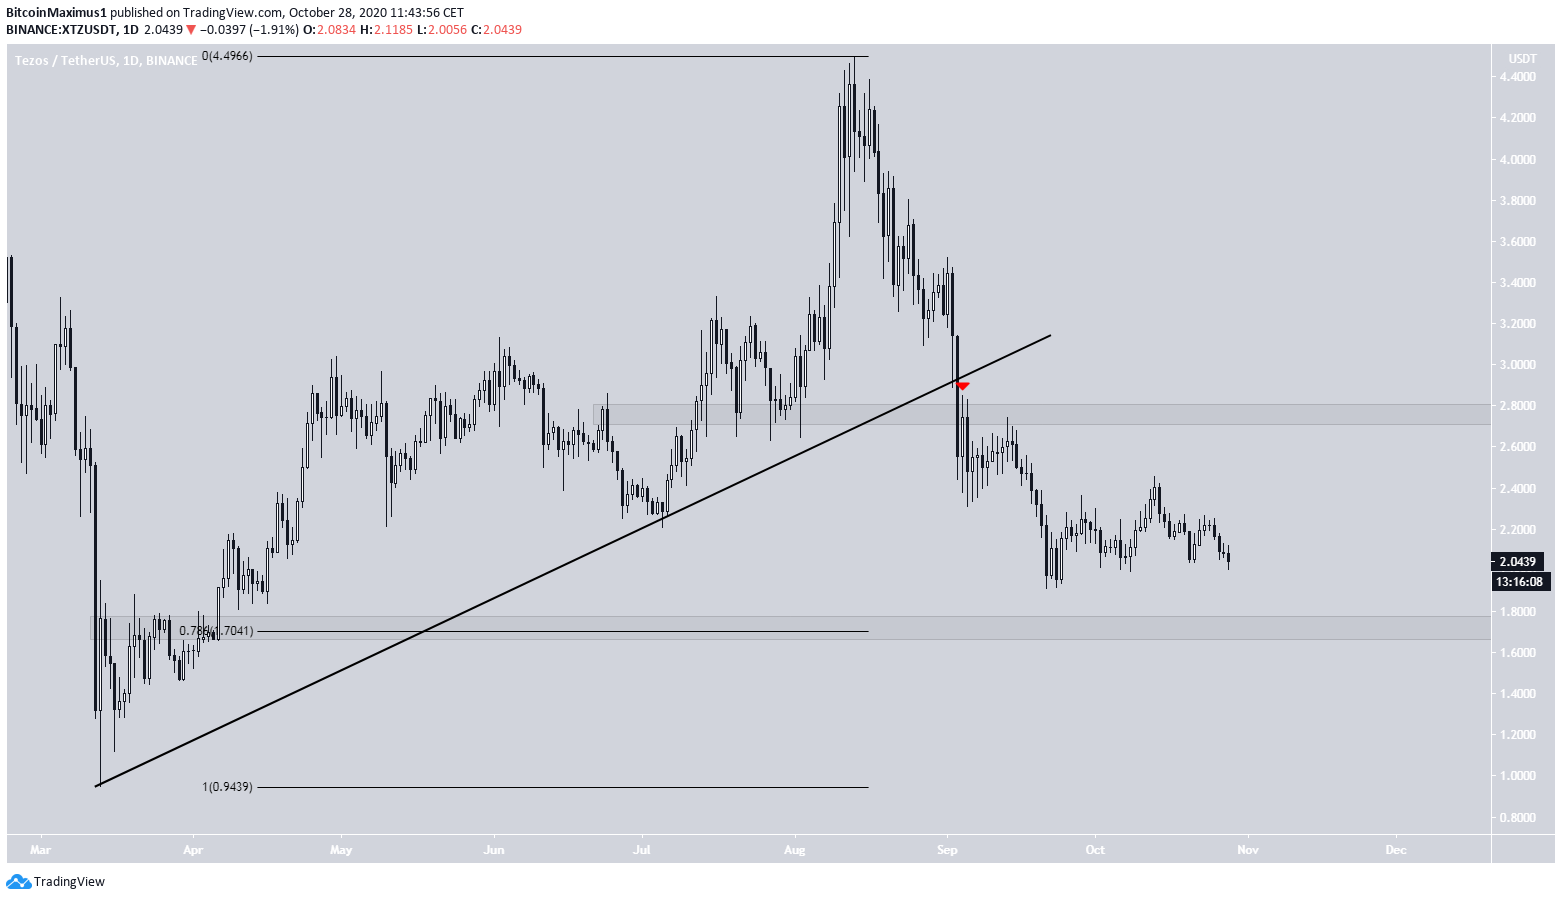
The XTZ price has been falling since a high of $4.49 was reached on Aug. 13. The price proceeded to break down from an ascending support line and the $2.75 area afterward. It validated the latter as resistance before resuming its downward move.
The price reached a low of $1.91 on Sept 21. If XTZ continues falling, the closest support area is found at $1.70, a previous resistance area, and the entire decline’s 0.786 Fib level.
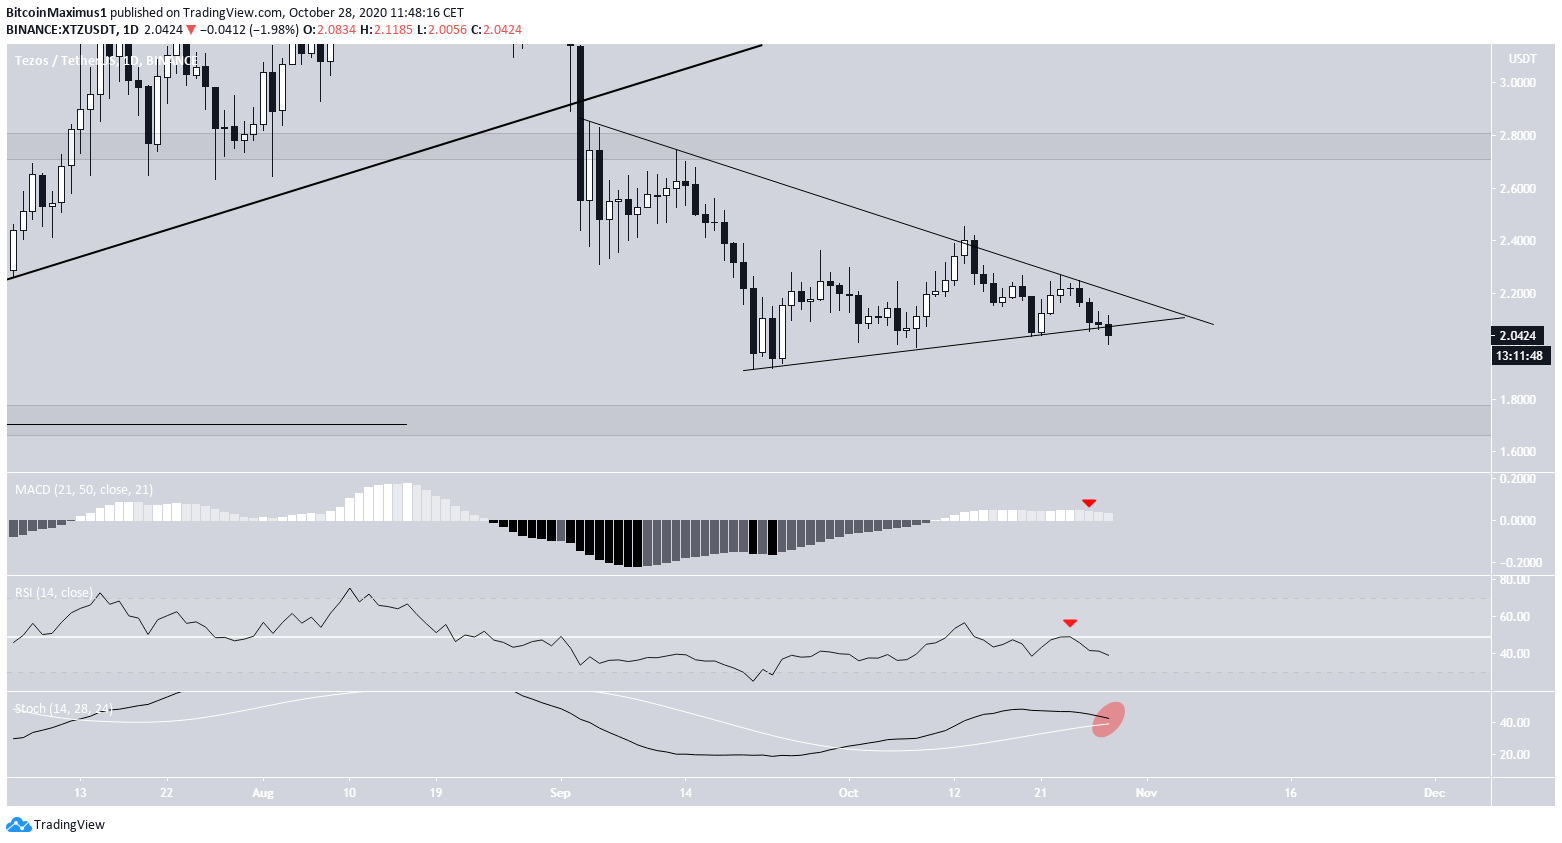
A closer look reveals a possible breakdown from a symmetrical triangle, which had been in place since the beginning of September. While the breakdown is not yet confirmed, XTZ touched a low considerably below the triangle’s ascending support line.
Furthermore, technical indicators are bearish. The RSI was rejected at the 50 line and is falling. The MACD is also falling even though it’s currently positive. The Stochastic Oscillator is in the process of making a bearish cross.
Therefore, the price should decline towards the $1.70 support area.
Wave Count
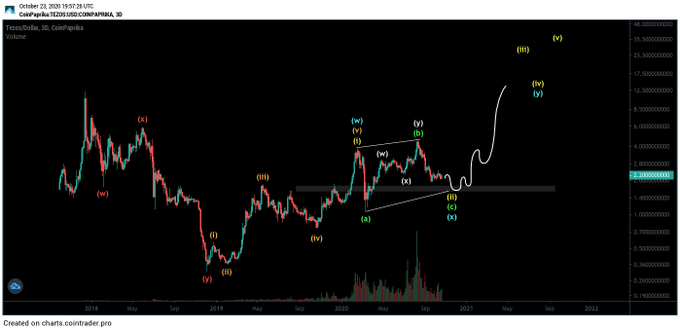
Cryptocurrency trader @Cryptotony_ outlined a long-term XTZ count, stating that the price will decline once more until around $1.70 before beginning to move upwards. The low coincides with the support area we have outlined above.
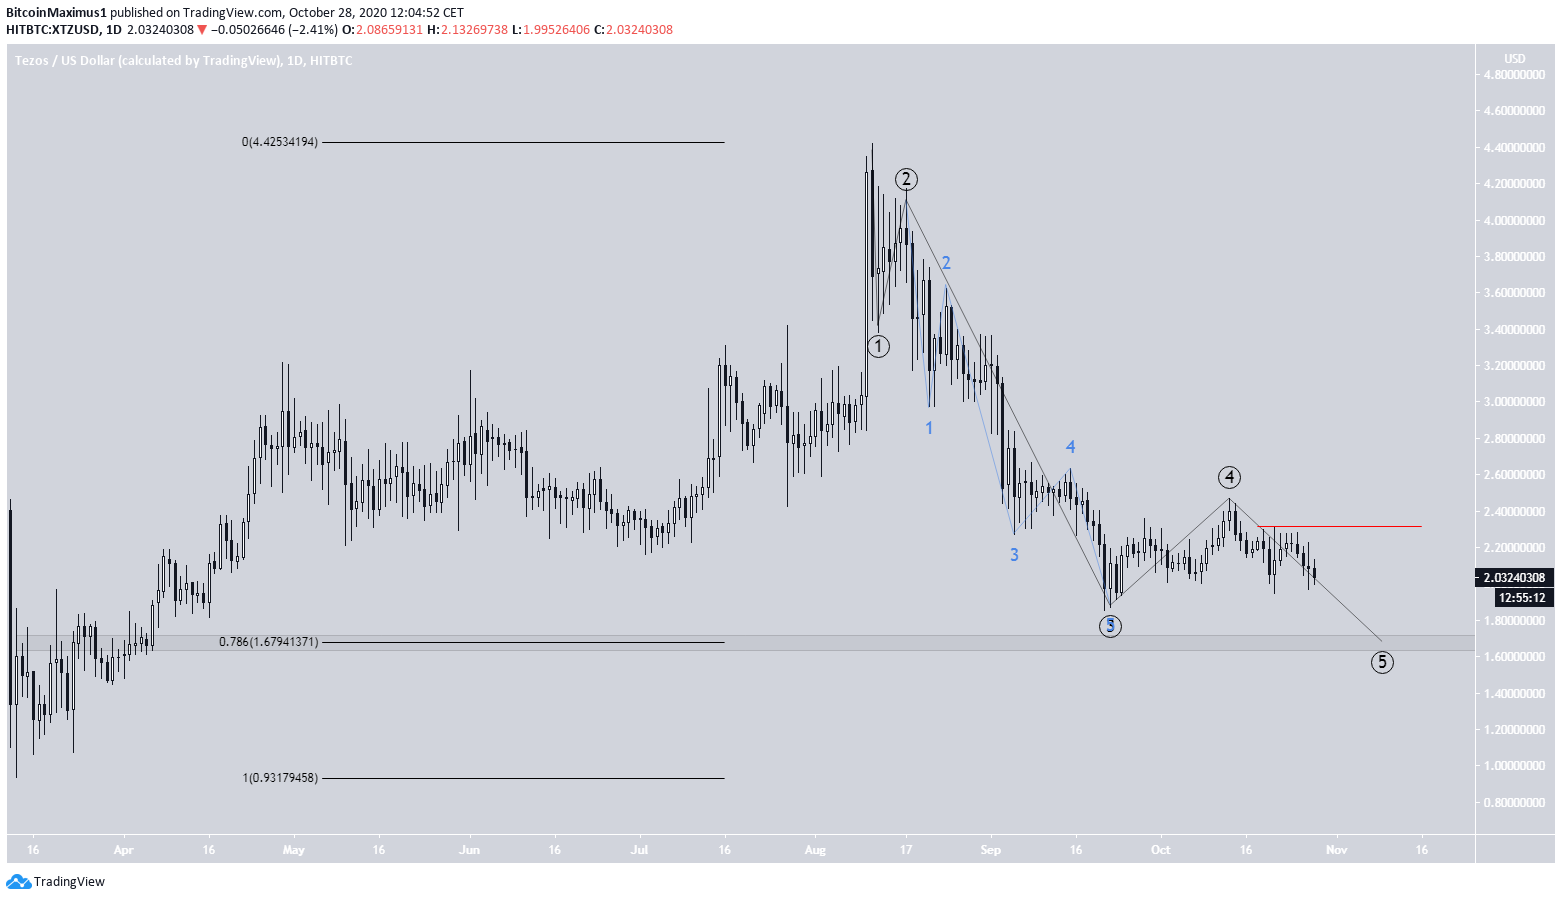
Since the previous Aug 11 high, the XTZ price seems to have begun a bearish impulse, outlined in black below. If correct, the price has just completed wave 4, after an extended third wave. Therefore, the fifth and final wave would likely take the $1.70 support area price and possibly lower.
A rally above the most recent high at $2.32 would invalidate this particular wave count. However, since the wave count, price action, and technicals are in alignment, the most likely scenario is a fall towards support.
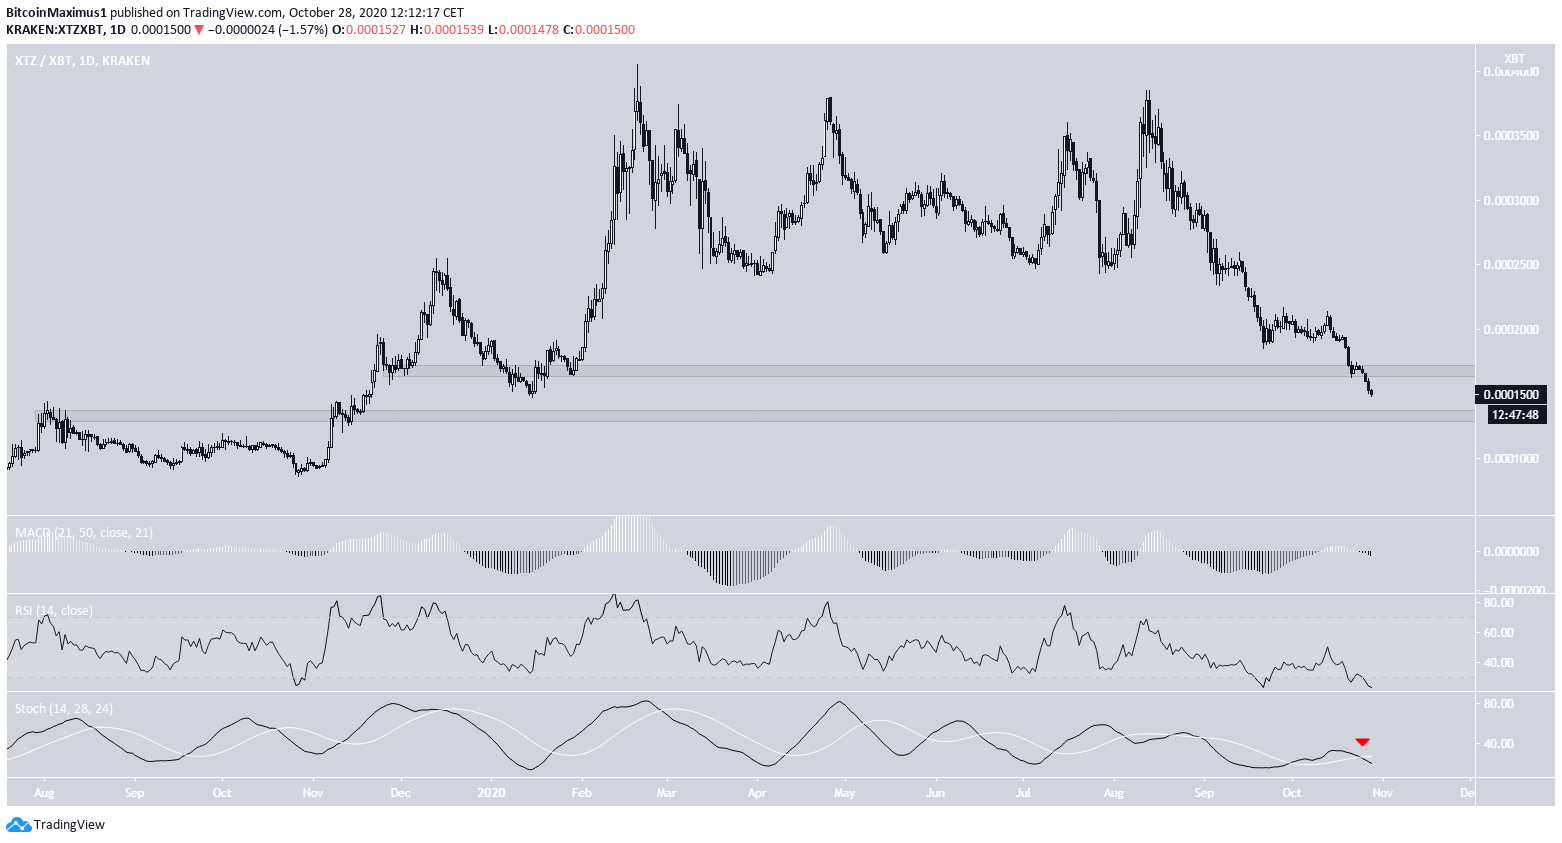
XTZ/BTC
The XTZ/BTC chart is considerably more bearish than its USD counterpart. The price has just broken down from the 16,800 satoshi area, something it had not done since Jan 2020, and is currently approaching the next support level at 13,400 satoshis.
Even though the daily RSI is oversold, there are no reversal signs yet, and the Stochastic Oscillator has just made a bearish cross.
Therefore, the price is likely to continue falling towards 13,400 satoshis.
To conclude, both the XTZ/USD and the XTZ/BTC pairs will likely decline towards the support levels outlined above.
For BeInCrypto’s previous Bitcoin analysis, click here!
Disclaimer: Cryptocurrency trading carries a high level of risk and may not be suitable for all investors. The views expressed in this article do not reflect those of BeInCrypto.
