


The tezos (XTZ) price has bounced at an important support area and began an upward movement.
XTZ is expected to continue increasing and eventually reach a new all-time high price.
Long-term XTZ levels
XTZ reached an all-time high price of $7.75 on April 16. It has been moving downwards since then. Despite the drop, it has bounced above the $4.40 long-term support area. As long as the token is trading above this level, we can consider the trend bullish.
Furthermore, technical indicators are also bullish. The MACD & Stochastic oscillator are both moving upwards. In addition, while the RSI is decreasing, it has generated considerable hidden bullish divergence. This is a strong sign of trend continuation.
Therefore, XTZ is expected to continue increasing towards new highs.
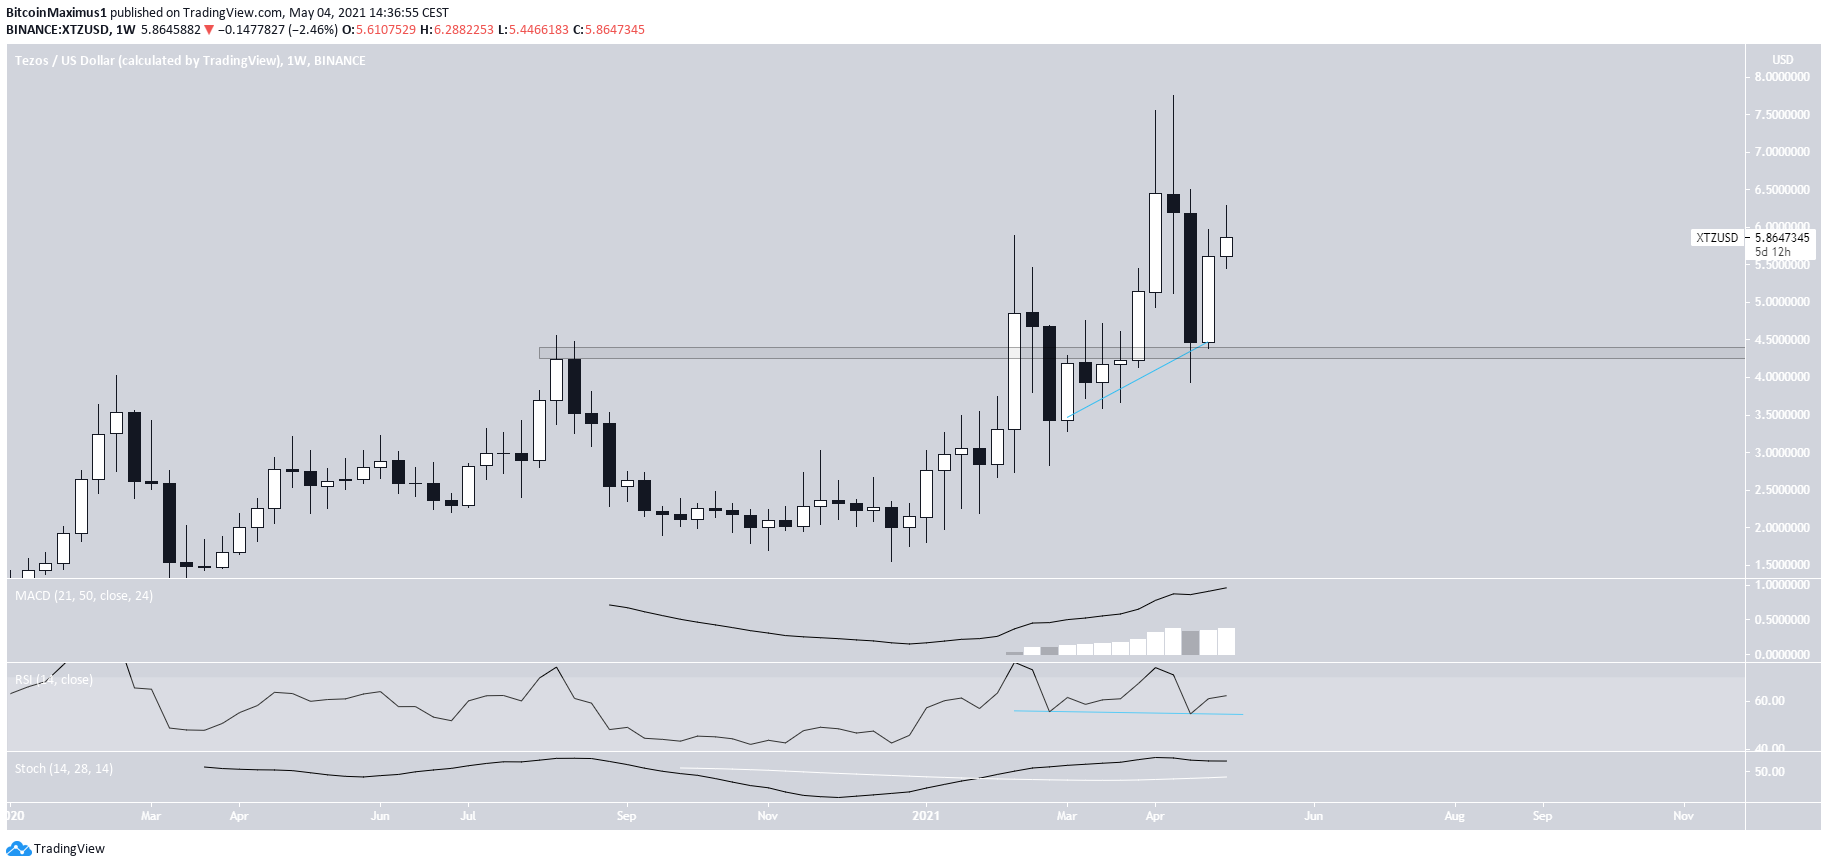
Cryptocurrency trader @damskotrades stated that XTZ will surprise many people. If the hidden bullish divergence outlined transpire, it could indeed move towards a new all-time high.
Completed correction
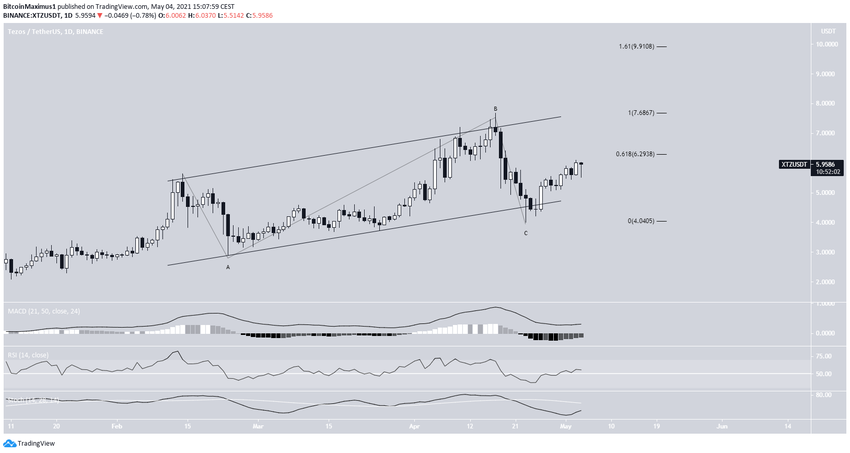
The daily chart supports the readings from the weekly one. The RSI, Stochastic Oscillator, and MACD are all increasing, a sign of a bullish trend.
Furthermore, the movement since the beginning of Feb. shows a completed running flat correction. If so, XTZ would be expected to break out upwards with strength.
Currently, it is facing resistance at the 0.618 Fib retracement level at $6.30. Afterwards, the next resistance levels are found at the all-time high of $6.86 and then $9.91, the 1.61 external Fib retracement.
XTZ/BTC
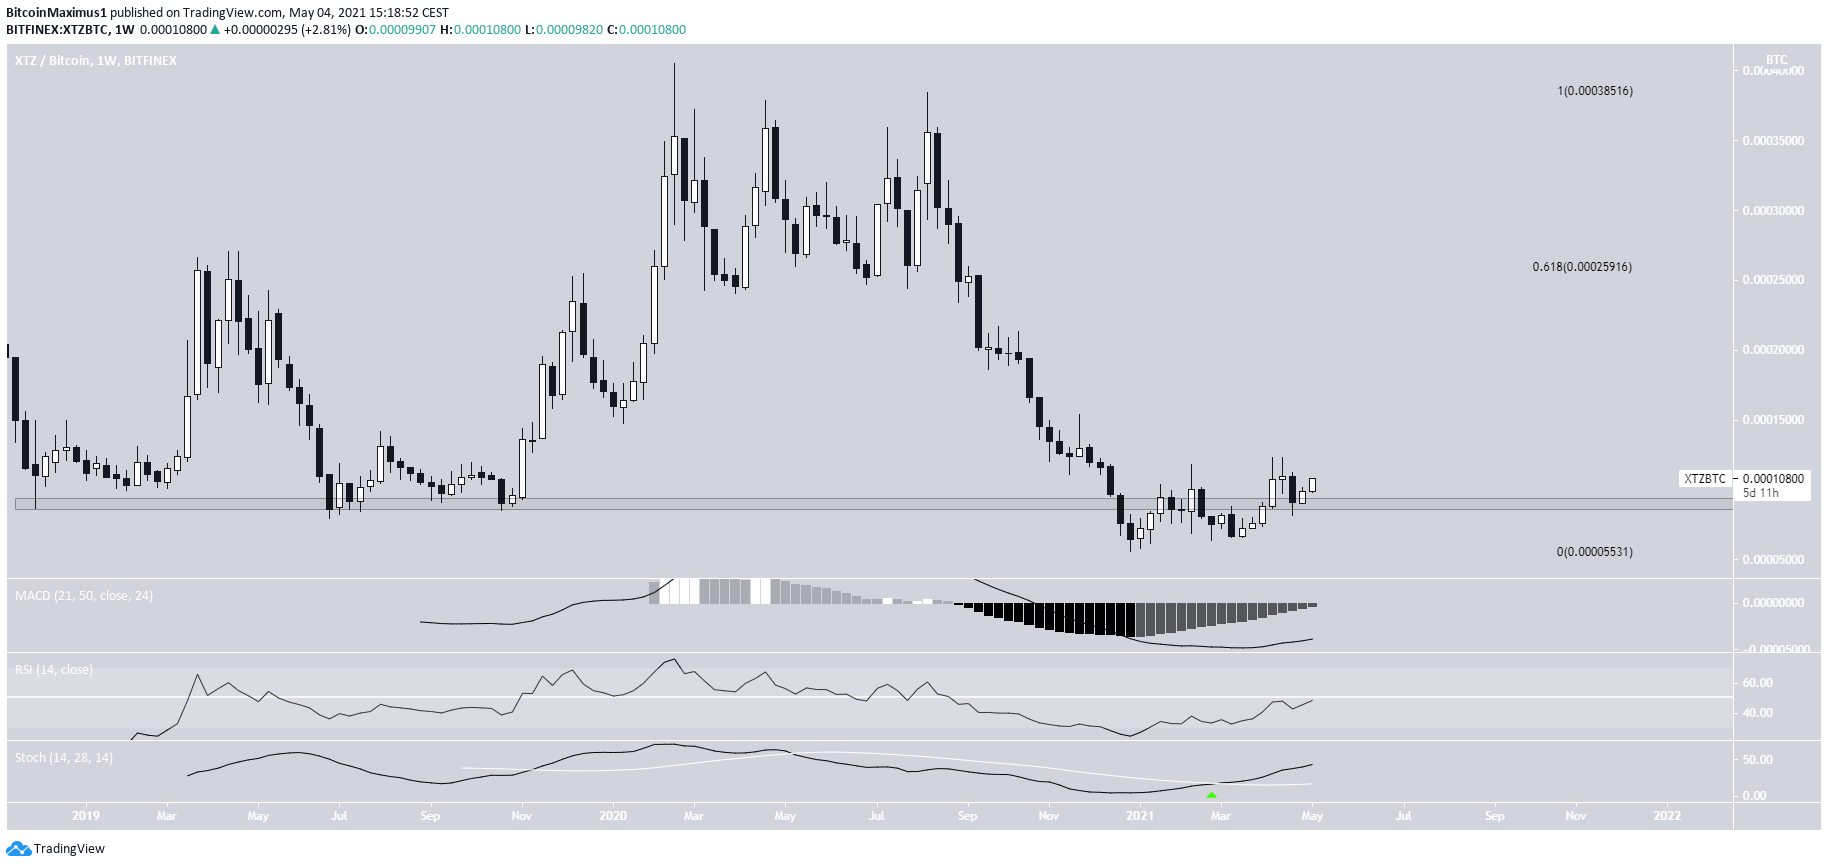
The XTZ/BTC chart is also bullish.
Previously, the 9,000 satoshi area had held as support since late 2018. The token fell thrice to this level, before initiating very significant upward movement.
While it fell below it in December 2020, the price has moved above it since. This is a strong bullish sign that often leads to an upward movement. Technical indicators also support this possibility.
If so, the next closest resistance level is found all the way at 25,916 satoshis.
To conclude, XTZ/USD is expected to gradually increase towards a new all-time high.
XTZ/BTC is expected to increase towards the 0.618 Fib retracement resistance at 25,916 satoshis.
For BeInCrypto’s latest bitcoin (BTC) analysis, click here.


