


The prices of XRP (XRP), Stellar (XLM), and Neo (NEO) have broken out from or are very close to breaking out from long-term resistance levels.
Technical indicators and the price action for all three suggest that a breakout will soon occur, initiating upward movements with an accelerated rate.
XRP (XRP)
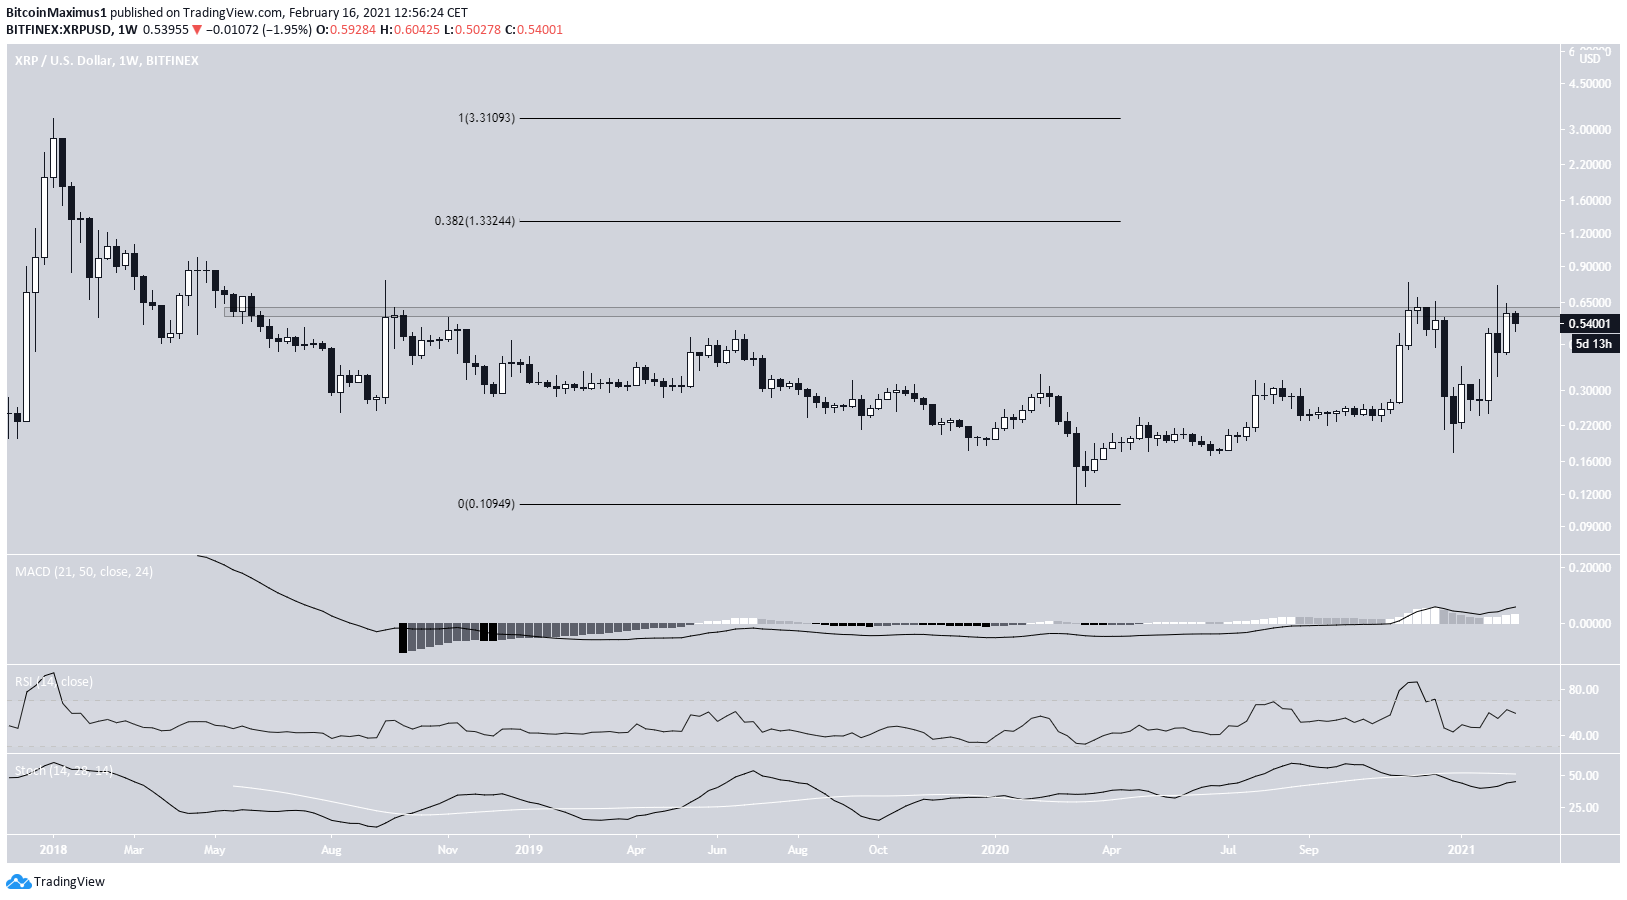
The weekly chart shows that XRP is attempting to break out above the $0.60 resistance area. It has made three unsuccessful attempts so far, and except for a few wicks, has been trading below this level since May 2018.
If successful in moving above this area, the next resistance would be all the way at $1.33, the 0.382 Fib retracement level measured from the all-time high price of $3.31.
Despite being so close to a breakout, technical indicators fail to confirm the upward trend. The Stochastic Oscillator has yet to make a bullish cross, and the RSI is below 70.
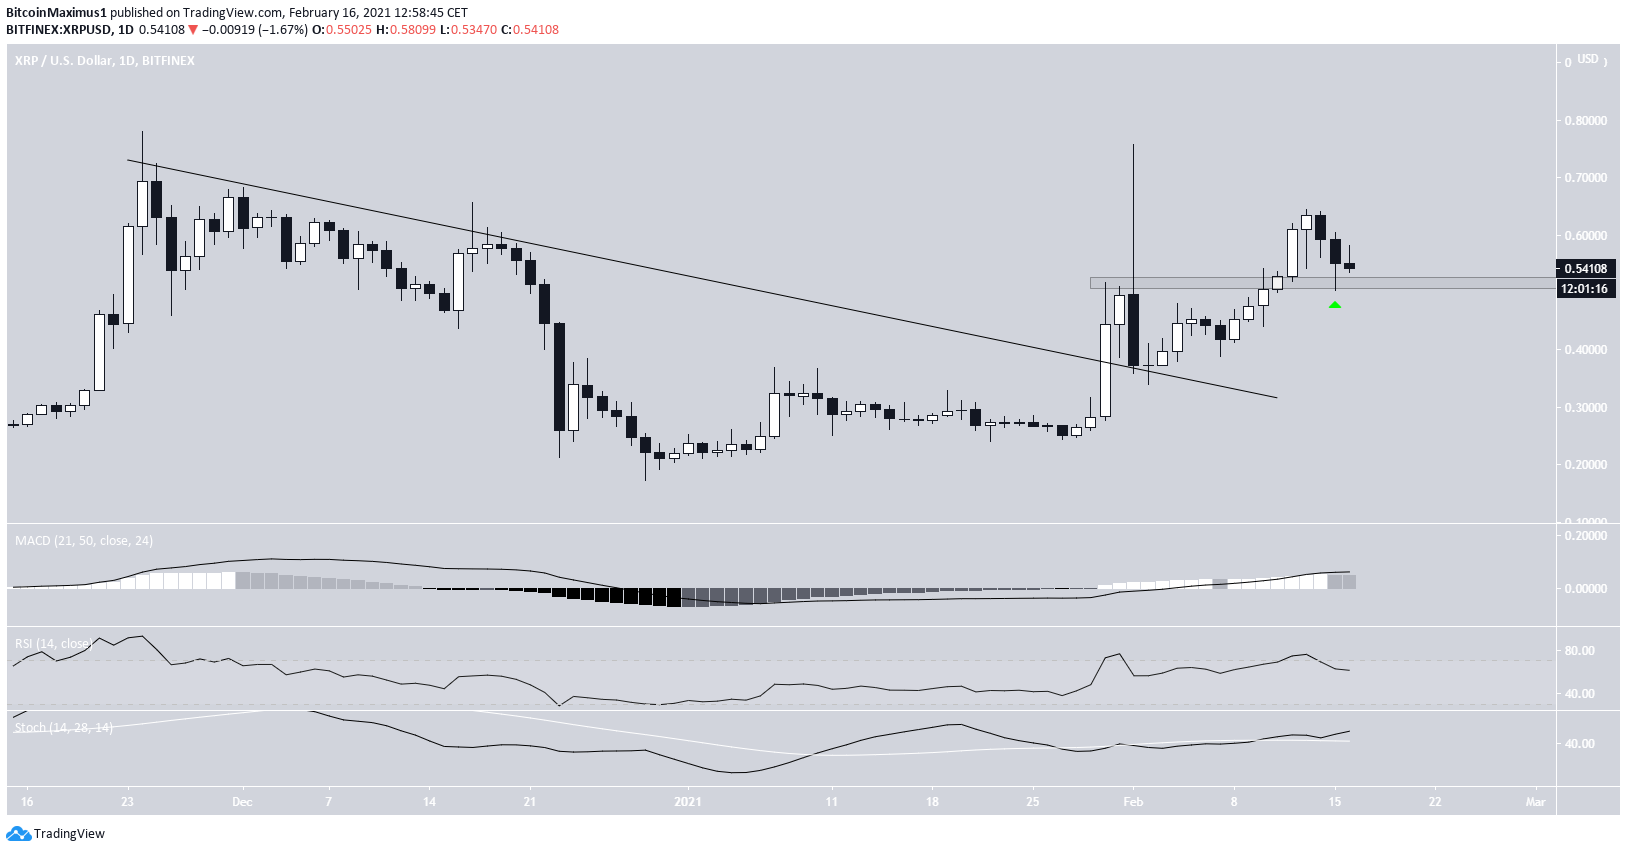
The daily chart is more bullish, indicating that XRP is likely to break out above the $0.60 resistance area.
First, we can see that XRP has already broken out from a descending resistance line and validated it as support afterward. Furthermore, XRP has reclaimed the minor $0.53 resistance area, which is now likely to act as support.
Therefore, as long as XRP is trading above this area, it should break out and continue moving higher.
Highlights
- XRP is trying to break out above the long-term $0.60 resistance area.
- It has already broken out from a short-term descending resistance line.
Stellar (XLM)
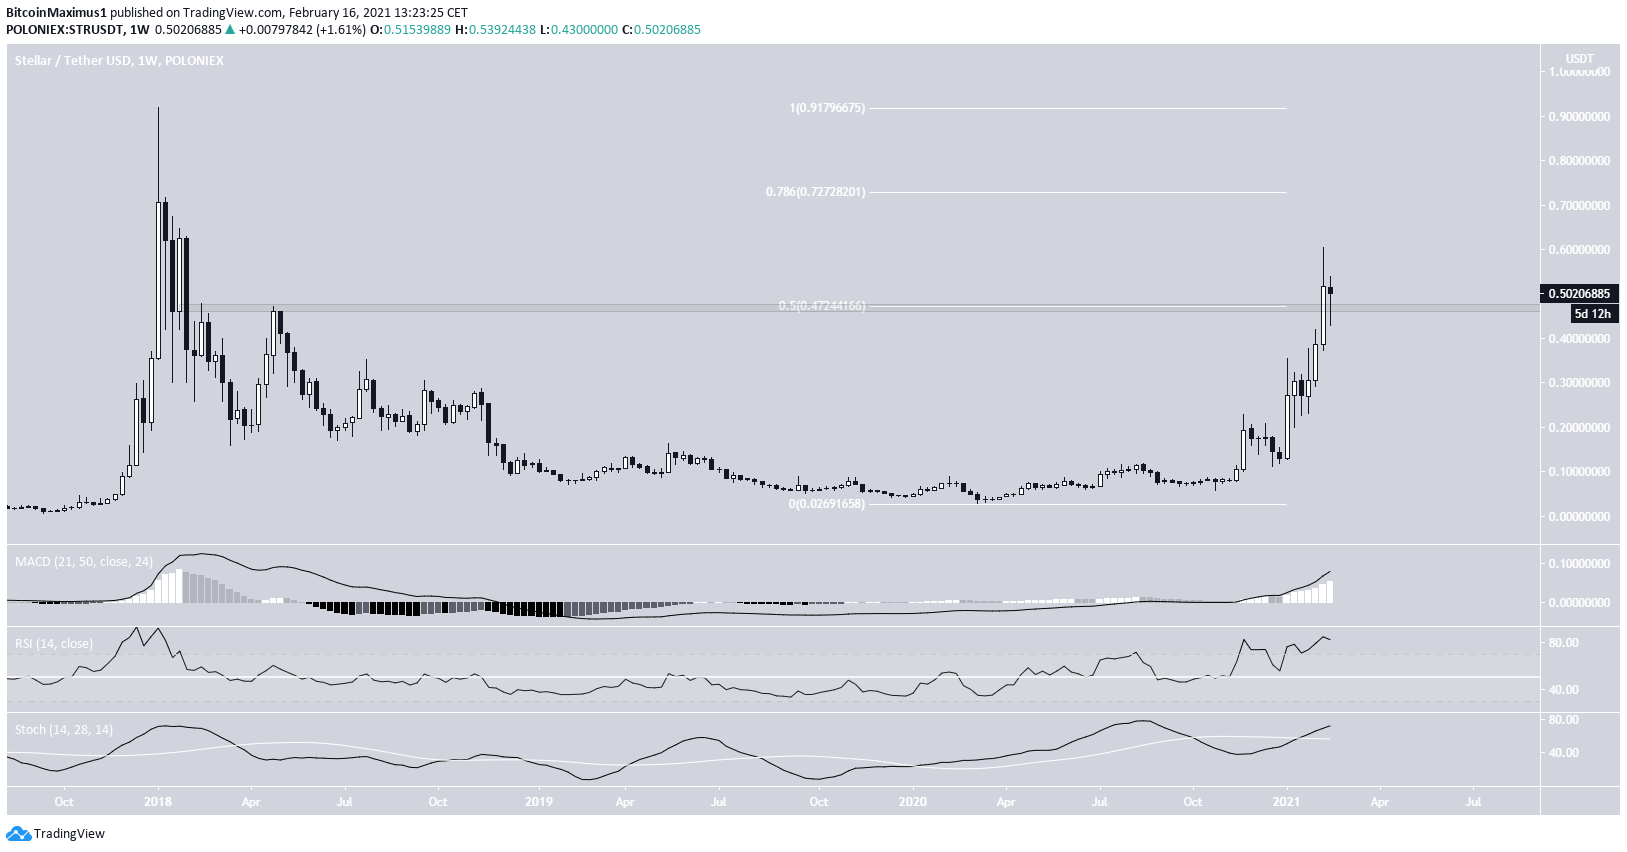
The weekly chart shows that XLM has already reclaimed the $0.47 resistance area and validated it as support afterward. This area is important because it is the 0.5 Fib retracement level. It is also a horizontal resistance area, having twice rejected XLM in early 2018.
Nevertheless, XLM has created a long lower wick above it, and all three of the RSI, MACD, and Stochastic Oscillators are increasing, supporting a continuation of the upward move. The latter has also made a bullish cross.
Therefore, XLM should increase towards the next resistance area at $0.72 and possibly break out towards a new all-time high price.
Highlights
- XLM has reclaimed the $0.47 resistance area.
- Technical indicators support an increase towards $0.72 and possibly a new all-time high price.
Neo (NEO)
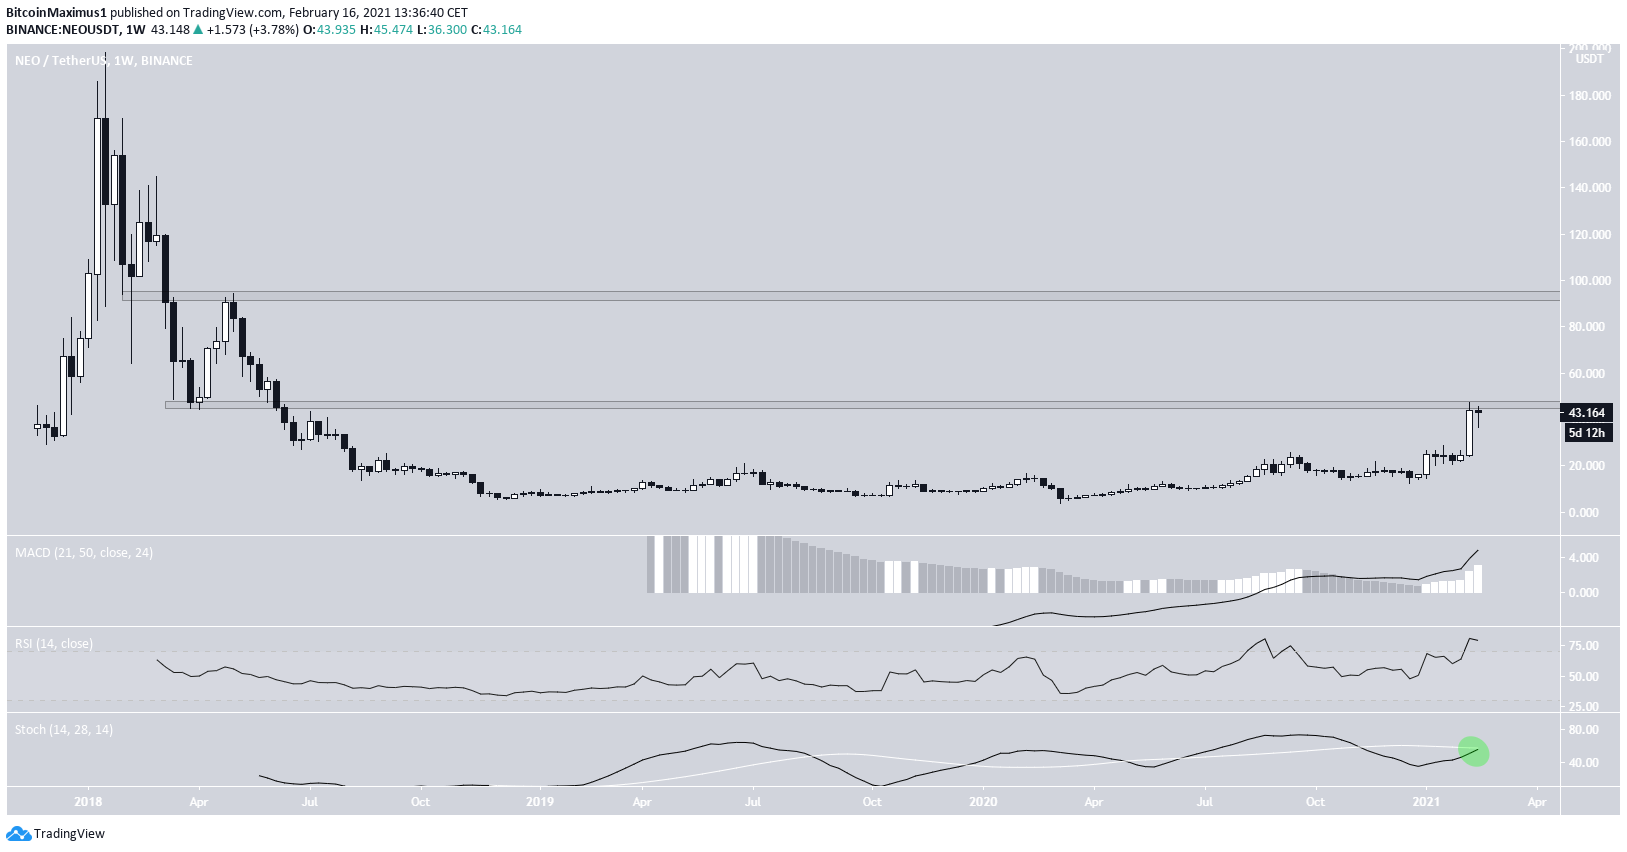
NEO is currently trading very close to the $47 resistance area. While NEO reached that area last week, it was rejected and has decreased slightly since then. NEO has not traded above this level since Apr. 2018.
If successful in breaking out, the next resistance area would be all the way at $95. Technical indicators are bullish, as evidenced by the bullish cross in the Stochastic Oscillator, indicating that NEO is likely to break out.
If it clears the $47 area, it should move at an accelerated rate towards $95.
Highlights
- NEO is attempting to break out above the $47 resistance area.
- Technical indicators support the possibility of a breakout and a rally towards $95.
For BeInCrypto’s latest Bitcoin (BTC) analysis, click here.


