


The Ripple (XRP) price has retraced all the way back to an important support level.
If the support holds and can give XRP a bounce, there is a lot of room to the upside for the price to go.
XRP Long-Term Breakout
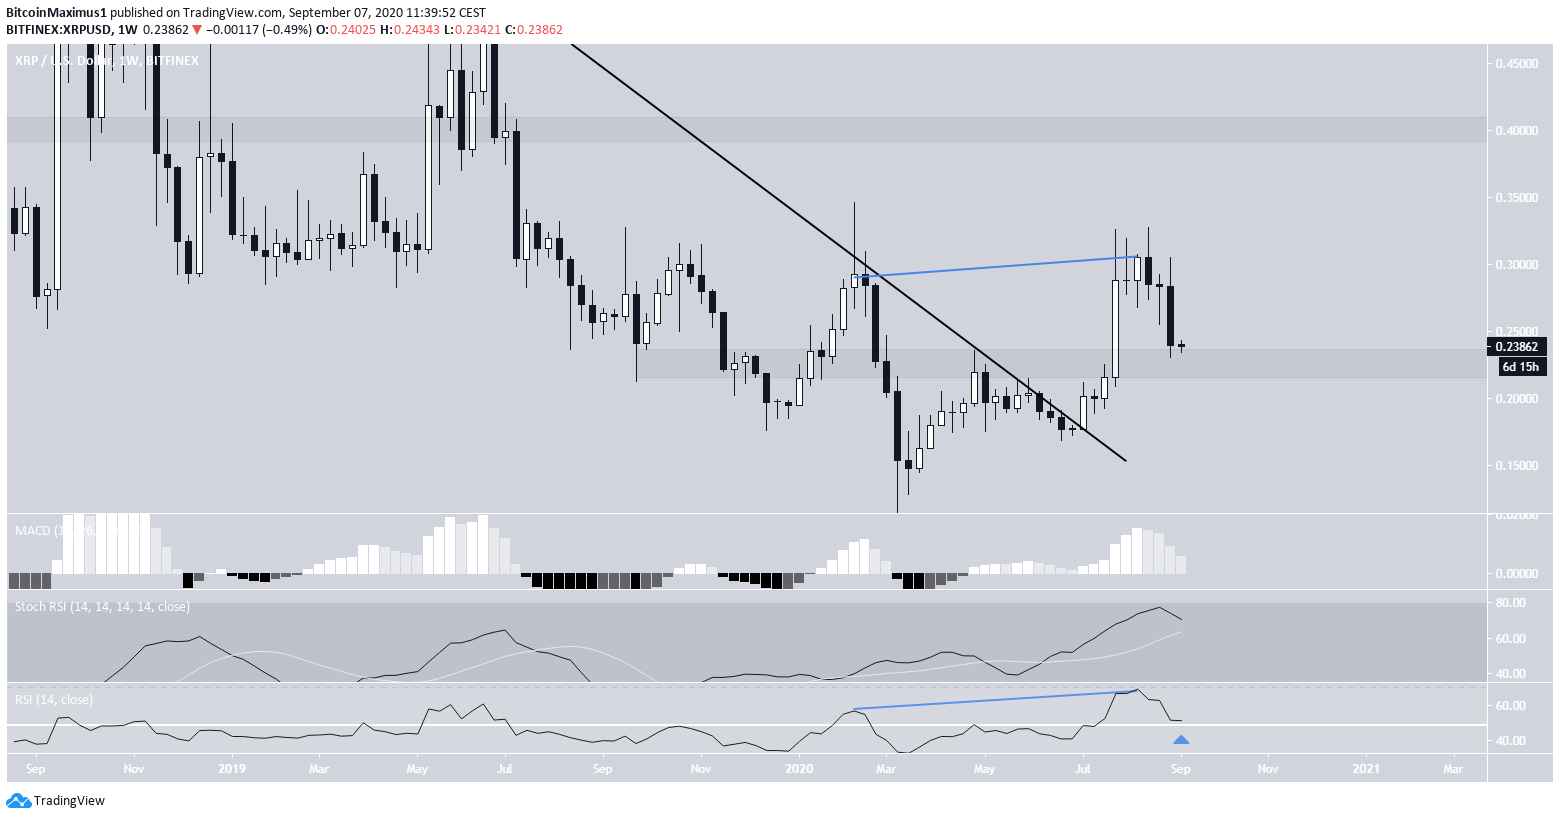
At the beginning of July, the XRP price broke out from a long-term descending resistance line and continued to increase until it reached a local high of $0.327 on Aug 27.
After retracing, XRP has fallen back to the $0.23 support area, which had previously acted as a resistance. The next resistance area is found at $0.40.
Technical indicators are neutral, leaning on bearish. While there is a bearish reversal sign in the MACD, there is no bullish divergence in the RSI or Stochastic RSI. Furthermore, the RSI is approaching the 50-line from above, a likely level to initiate a bounce.
Short-Term Reversal
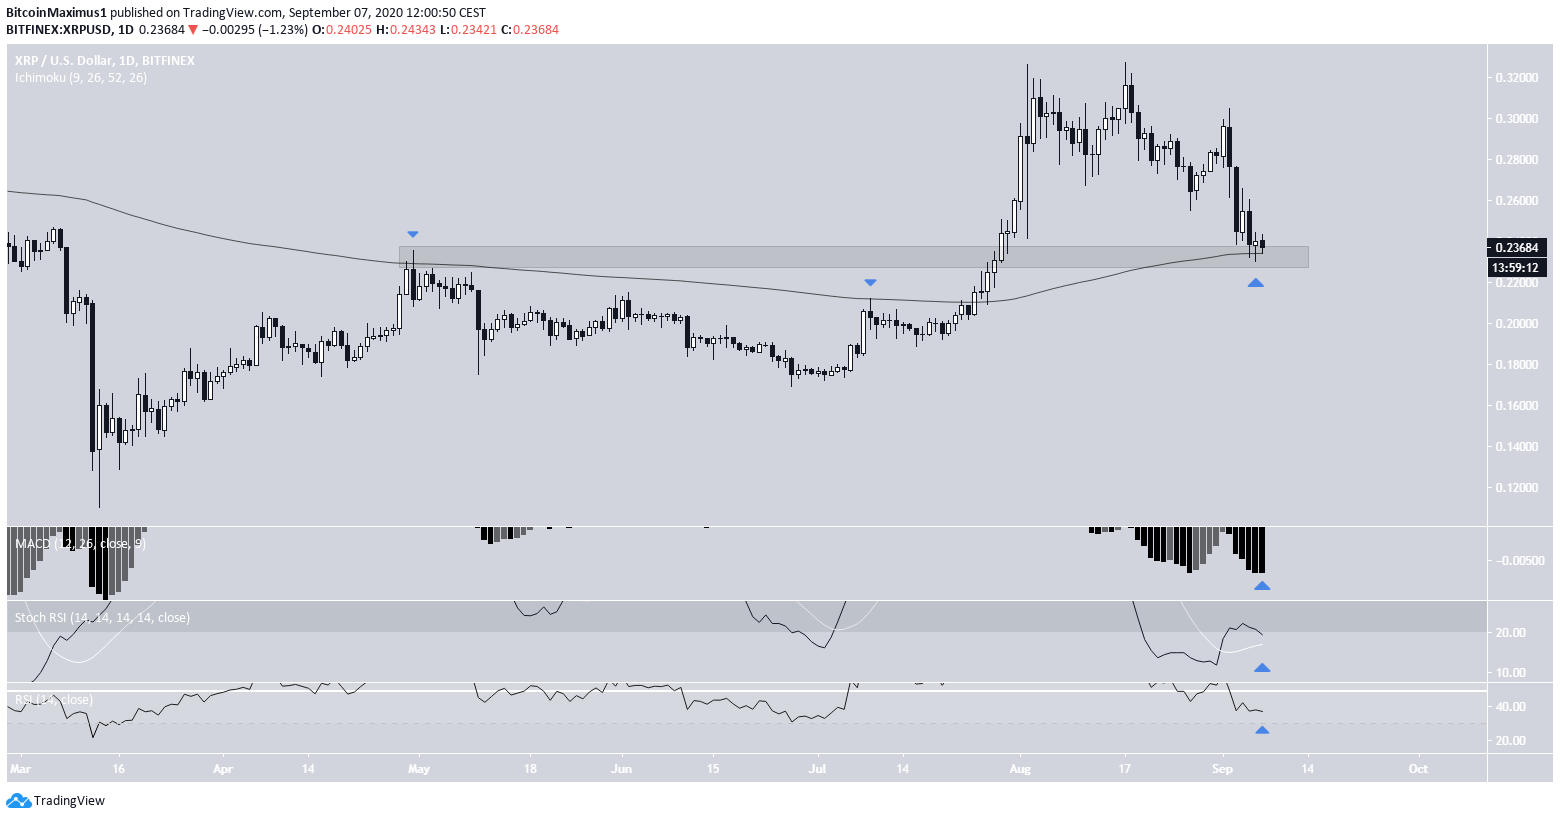
The daily chart shows that besides being in a support area, the price has also found support at the 200-day moving average (MA). The same MA has previously acted as resistance prior to the breakout.
While technical indicators do not confirm a reversal, they show that the market is extremely oversold and at its lowest level since the March crash.
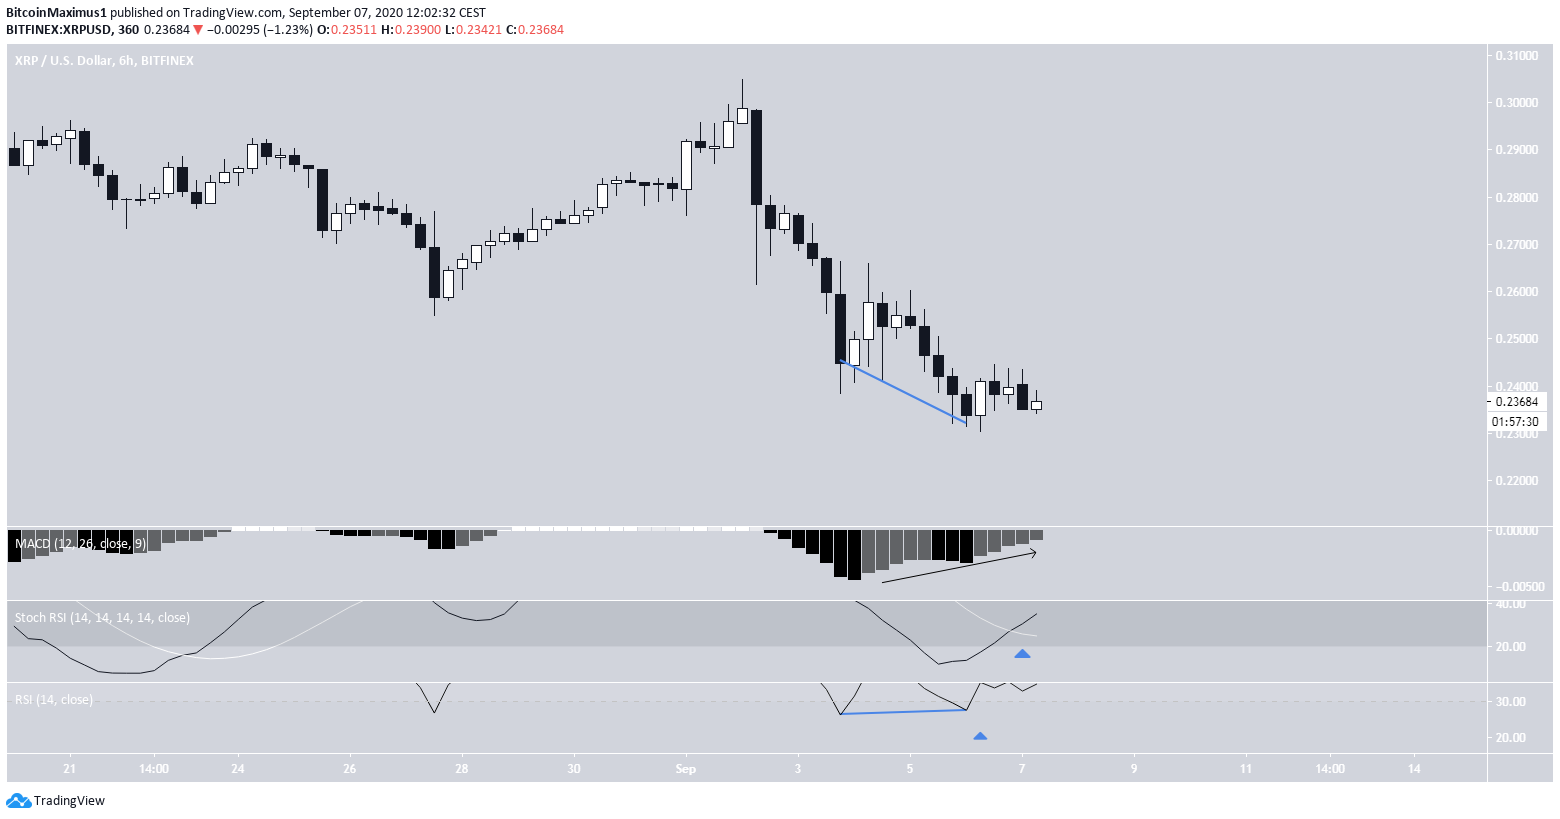
In lower time-frames such as the six-hour, there is already a considerable bullish divergence in both the RSI and the MACD, while the stochastic RSI has made a bullish cross.
This is a sign that the price is likely to move upwards towards $0.26.
Wave Count
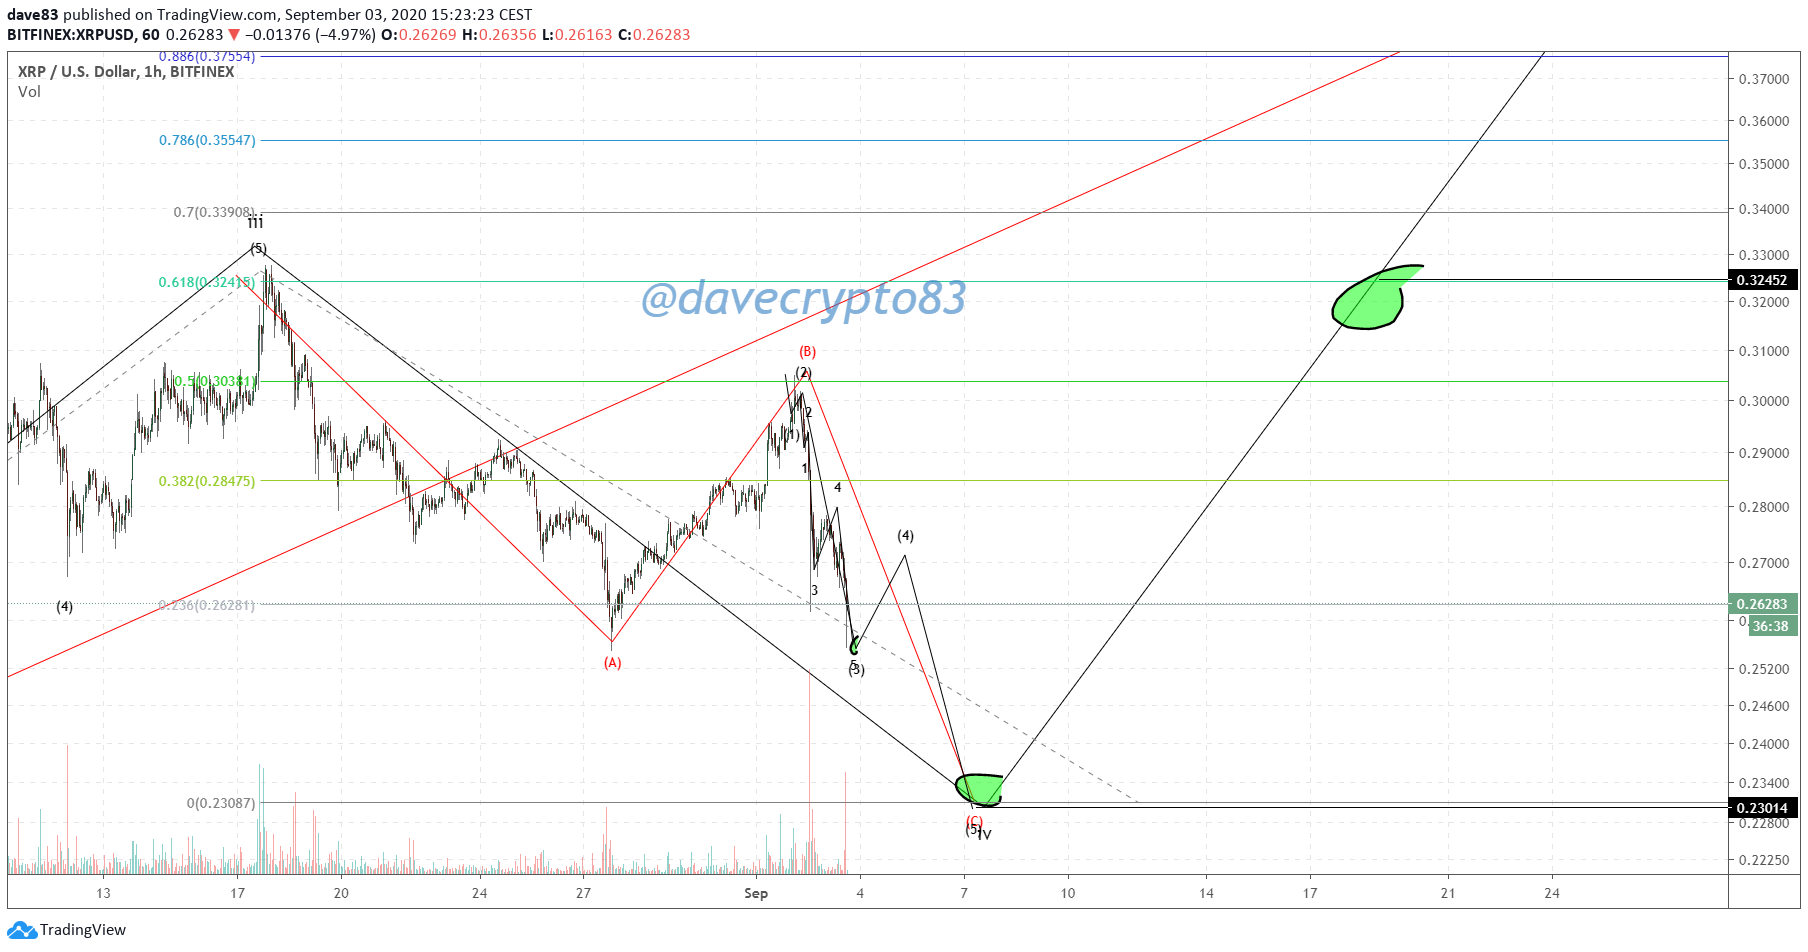
Cryptocurrency trader @Davecrypto83 outlined an XRP chart, stating that the price should reach a bottom near $0.23, before beginning an upward move towards $0.39.
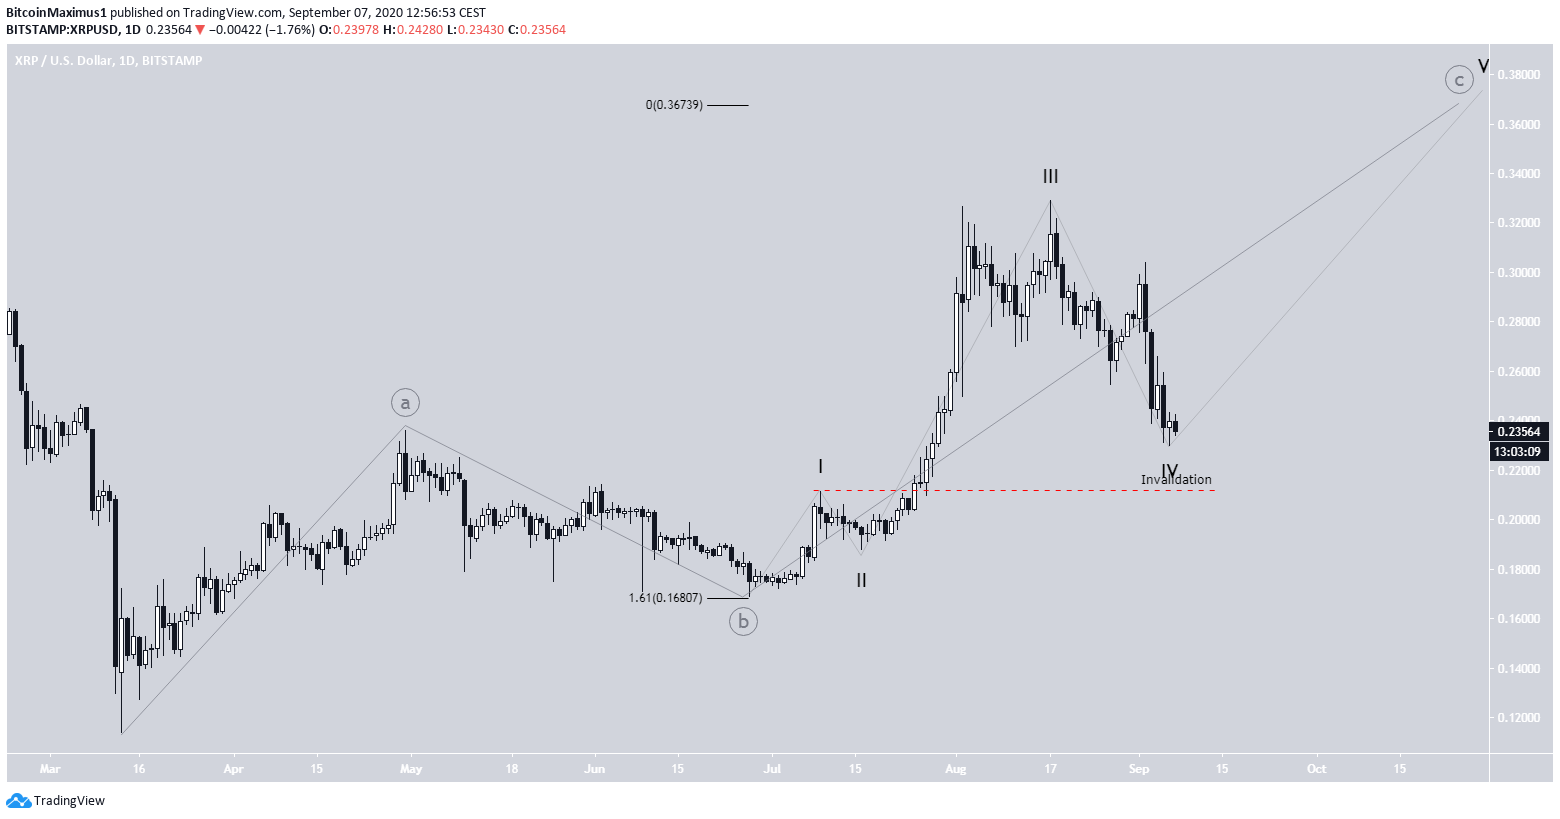
In BeInCrypto’s previous XRP analysis, we stated that it was likely that the price began a bullish impulsive five-wave formation from the March 13 low, but last week’s decrease has invalidated that possibility.
The price movement still looks bullish based on Elliot Wave theory. It looks likely that the price is completing an A-B-C upward formation (in grey below), and has just completed sub-wave 4 (black) of the C wave.
The C wave has already gone above the 1:1 level of the A wave, so the next target is found at the 1.61 level at $0.367.
A decrease below the wave 1 high at $0.211 would invalidate this final bullish count, suggesting that the price will head lower.
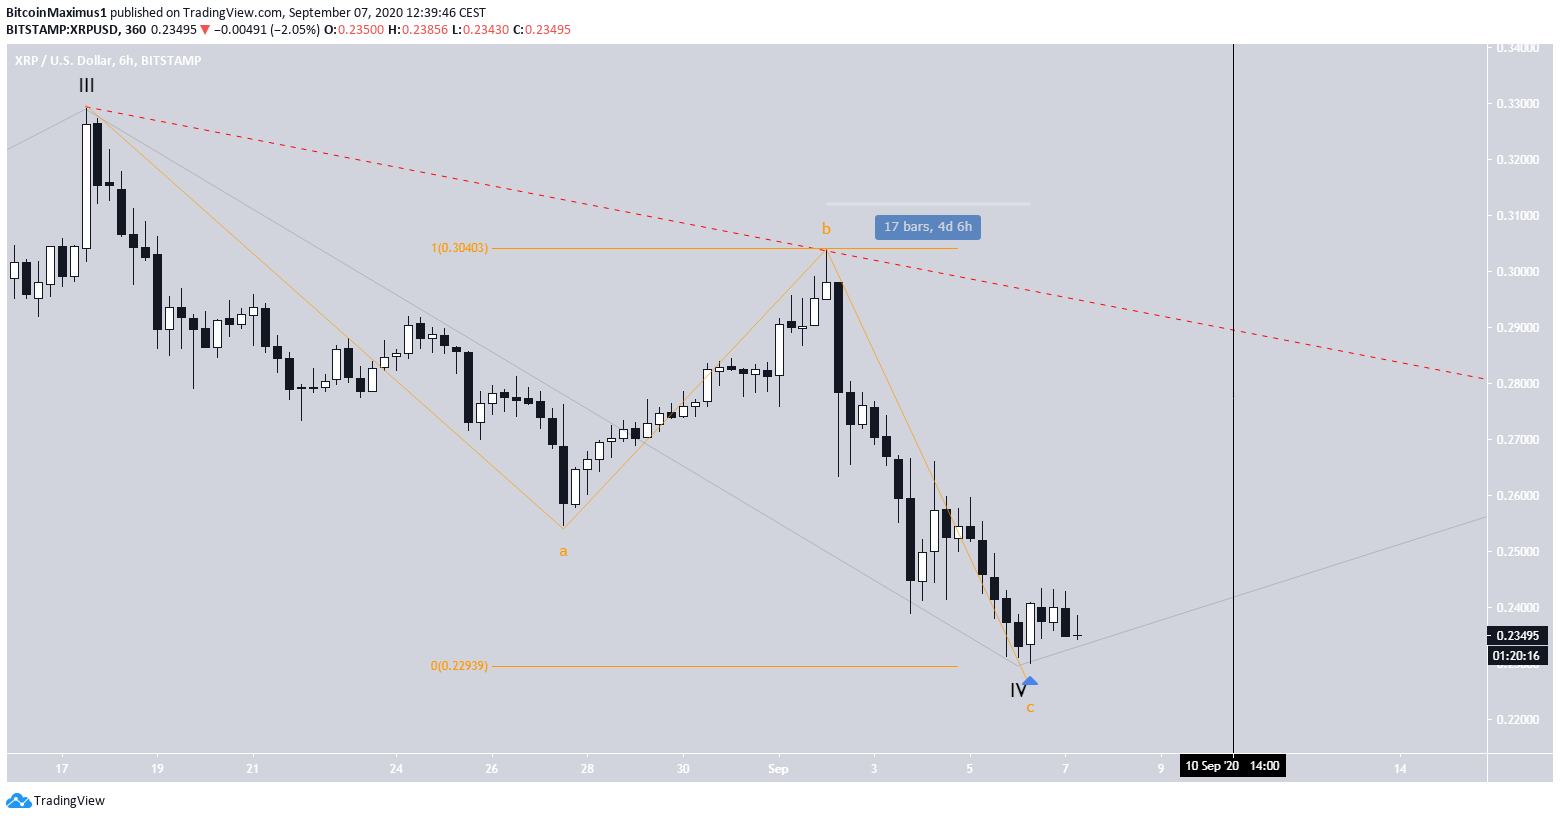
In the short-term, we can see that sub-wave 4 has transpired with an A-B-C formation (orange). If the price has already reached a low, then waves C and the A had an exact 1:1 ratio, which is common in such corrections.
However, in order to confirm the upward move, the XRP price would have to break out from the descending resistance line connecting the beginning and the end of waves A and B (in red below) in less time than it took for the C wave to be completed.
This means that XRP has to break out above the resistance line near $0.28 before Sept 10. Failure to do so could mean that the correction is not yet over and the price will head lower.
To conclude, the XRP price has likely either ended its correction or is very close to doing so. A decrease below $0.211 would invalidate the bullish scenario, while a breakout above the descending resistance line at $0.28 would confirm it.


